Tag: 3D data

  • Seen & Heard: GM sued over data collection; archaeologists uncover hidden empire and more

    Seen & Heard: GM sued over data collection; archaeologists uncover hidden empire and more

    “Seen & Heard” is a monthly feature of GPS World magazine, traveling the world to capture interesting and unusual news stories involving the GNSS/PNT industry.


    Texas Sues GM for Allegedly Selling Drivers’ Data

    Photo: baona / iStock / Getty Images Plus / Getty Images
    Photo: baona / iStock / Getty Images Plus / Getty Images

    The Texas Attorney General’s Office has filed a lawsuit against General Motors (GM), alleging that the company unlawfully collected and sold driving data from more than 1.5 million Texas drivers. The lawsuit claims that GM gathered detailed information from vehicles manufactured since 2015. Additionally, the lawsuit alleges that GM deceived customers by compelling them to enroll in data collection services during the vehicle “onboarding” process, without fully disclosing how their information would be used. The collected data was reportedly used by third-party companies to generate “driving scores” which were then sold to insurance providers.

    3D Scans Reveal Medieval Secrets

    Photo: Stichting Grote Kerk Naarden
    Photo: Stichting Grote Kerk Naarden

    The Grote Kerk in Naarden, Netherlands, known as the “Sistine Chapel of the North,” is undergoing a 3D scanning project to uncover the secrets of its medieval ceiling murals. A team of researchers from various Dutch universities are collaborating to create a detailed digital 3D model of the church’s barrel vault, covering 700 square meters of painted planks and beams. The project aims to shed light on long-standing mysteries surrounding the artwork’s origins, including the identities of the artists and the precise timeframe of their creation. Researchers will use advanced 3D scanning technology to produce high-resolution digital replicas of the murals, allowing researchers to examine the artwork in extraordinary detail.

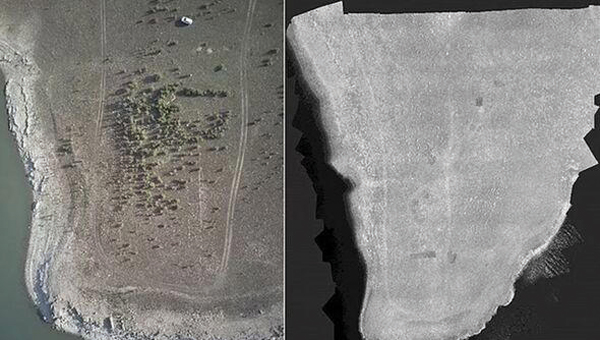
    Archaeologists Unearth Hidden Empire

    Photo: University of Cádiz
    Photo: University of Cádiz

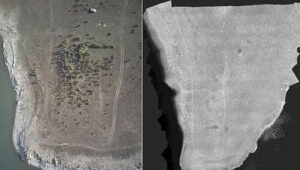
    Archaeologists from the University of Cádiz in Spain have discovered 57 Roman Empire-era sites in the Sierra de Cádiz regions, revealed what researchers believe to be an undiscovered part of the Roman empire. The team used multispectral cameras and lidar to detect these hidden sites. The team has begun on-site excavations, including work at the Roman villa of El Canuelo in Bornos, and plans to continue its research to gain a more comprehensive view of Roman settlement in the region.

    Mapping Secrets of the Seafloor

    Photo: SuBastian/Schmidt Ocean Institute via CNN
    Photo: SuBastian/Schmidt Ocean Institute via CNN

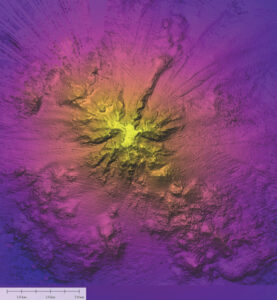
    Oceanographers from the Schmidt Ocean Institute used advanced sonar technology to map a massive underwater mountain in Nazca Ridge, 900 miles off the coast of Chile. The team employed a hull-mounted sonar system on their research vessel, R/V Falkor, to create detailed maps of the seafloor. In addition to sonar mapping, the team used an underwater robot to explore the mountain and surrounding areas. This robotic technology allowed them to document rare marine life, including the ghostly white Casper octopus and unusual siphonophores nicknamed “flying spaghetti monsters”.

  • UP42 partners with Intermap for high-resolution elevation data

    NEXTMap digital surface model (Image: Intermap Technologies)
    NEXTMap digital surface model (Image: Intermap Technologies)

    The NEXTMap Elevation Data Suite from Intermap Technologies is now offered on the UP42 developer platform for Earth observation data and analytics. UP42 gives users direct access to extensive Earth observation datasets and advanced processing algorithms, and Intermap Technologies, based in Englewood, Colorado, is a provider of geospatial datasets, solutions and software.

    The NEXTMap 3D elevation products are available as digital surface models and digital terrain models at one-, five- and 10-meter resolution. According to Intermap, NEXTMap One offers 1-meter spatial resolution, 1-meter vertical and 3.5-meter horizontal accuracy; NEXTMap 5 offers 5-meter resolution, 1.6-meter vertical and 3.5-meter horizontal accuracy; and NEXTMap 10 offers 10-meter resolution, 8.4-meter vertical and 17.5-meter horizontal accuracy.

    “We are excited to add NEXTMap elevation models to the UP42 platform. Our customers need this data for a range of use cases, including monitoring of vital infrastructure projects such as pipelines, powerlines and railway corridors,” said Sean Wiid, CEO of UP42. “High-quality 3D data is critical in every phase of infrastructure management from construction planning to ongoing monitoring of vegetation encroachment.”

    The addition of NEXTMap datasets to the UP42 marketplace enables users to build even more powerful geospatial solutions in the areas of infrastructure management, construction planning, geologic mapping, land cover classification, forestry, resource conservation and contour generation, UP42 said.

    “Our goal at UP42 is to create a single platform where our users have access to all the geospatial data, analytics and processing infrastructure they need to build solutions that solve critical real world problems,” said Wiid. “Intermap’s NEXTMap elevation models dramatically expand our core data offering and, as a result, expand the range of use cases we can help our customers address.”

    The NEXTMap datasets join a variety of Earth observation information already on the UP42 marketplace, including Pleiades 1A/B, SPOT 6/7, Landsat-8, TerraSar-X, Sentinel-2 and MODIS satellite imagery, Getmapping U.K. aerial data, exactEarth AIS data, and Meteomatics weather and ocean data.

  • Enview unveils 3D AI as a web application, Enview Explore

    Enview unveils 3D AI as a web application, Enview Explore

    Screenshot: Enview
    Screenshot: Enview

    Application empowers users with expert visualization and analysis of lidar

    Enview, a pioneer in the scalable processing of 3D geospatial data, has launched Enview Explore, a powerful web application that leverages artificial intelligence (AI) and cloud computing to automatically process 3D data at a high speed and scale.

    Also, Robert Cardillo, former director of the National Geospatial-Intelligence Agency (NGA), has joined the company’s board of directors. Following an oversubscribed round of funding in May, the company continues to experience growth and momentum in the market.

    Enview’s technology has been deployed on thousands of square miles worldwide to protect vital infrastructure and support mission-critical operations. Its unique method for classifying 3D data using neural networks and deep learning techniques reduces time to action by focusing on finding meaningful insights in 3D data.

    Previously offered as custom services for organizations such as Pacific Gas & Electric and the United States Air Force, this groundbreaking technology is now available for the first time as an easy-to-use, self-service web application.

    Screenshot: Enview
    Screenshot: Enview

    “Enview has built the world’s most scalable AI platform for transforming 3D point clouds into insight and action,” said San Gunawardana, Ph.D., co-founder and CEO of Enview. “We are solving one of the hardest problems in machine perception, and applying it to some of the most grounded and impactful challenges facing society. It is our goal to empower people with the confidence to perceive and navigate a rapidly changing world; Enview Explore is the natural next step in this journey and our team is excited to place this groundbreaking capability directly into the hands of operational end-users.”

    Key benefits of Enview Explore include:

    The power of 3D data. Three-dimensional unstructured data, such as lidar, contains incredible detail but is painfully slow to analyze manually. Enview solves this problem by combining its novel AI with the power of cloud computing to automate 3D classification and segmentation, giving users scalability that can support even nation-sized datasets.

    High speed. While current methods can take weeks or more to process data, Enview provides actionable insights in minutes. Enview Explore utilizes a new and innovative approach that applies AI to 3D data, yielding significantly faster results than traditional lidar software.

    Total data control. Enview Explore removes the need for outsourcing lidar to a third party by giving users the ability to perform classification, segmentation, terrain modeling, change detection, feature extraction, and intuitive visualization directly inside the application.

    Screenshot: Enview
    Screenshot: Enview

    “With this release, we wanted to show the world that you don’t need to be a professional to get expert analysis from lidar,” said Anthony Calamito, VP of Products for Enview. “Lidar and other 3D data hold tremendous value and provide unparalleled insight over 2D data sources. While unlocking that value traditionally has required an in-depth understanding of specialty software, Enview Explore lets anyone create meaningful insight from 3D data with just a few clicks.“

    The company also announced that Robert Cardillo has joined its Board of Directors. Cardillo served as the sixth director of the NGA from 2014 through 2019. In that position, he led the NGA under the authorities of the secretary of defense and director of National Intelligence to transform the agency’s future value proposition through innovative partnerships with the growing commercial geospatial industry.

    “Mapping the world in 3D opens new possibilities for national security and mission-critical infrastructure, including some of the most important challenges facing our nation today,” said Cardillo. “Enview has completely changed the game when it comes to what’s possible with lidar visualization and analysis, making unstructured data accessible and easy to use: in other words, creating coherence out of chaos. With a shared purpose and commitment, I look forward to working with the Enview team toward the future the world demands and our customers deserve.”

  • Cesium to collaborate with Smithsonian to stream high-resolution 3D models online

    Streaming 3D geospatial technology company Cesium will support the Smithsonian Institution by streaming 3D models of massive objects in its collection, such as the Space Shuttle Discovery. The models will be streamed over the internet in high resolution for the first time.

    The collaboration is part of the Smithsonian’s Open Access Initiative. Through the initiative, the Smithsonian will release about 2.8 million 2D and 3D images, public collections metadata, and institutional research data sets as Creative Commons (CCo) for any purpose, such as education, research, commercial endeavors, creative reuse, computational analysis, and innovative explorations.

    “The Smithsonian Open Access Initiative aligns perfectly with Cesium’s vision to make the world’s collection of data more useful and accessible,” said Cesium CEO Patrick Cozzi. “We are proud that our technology will give researchers, educators, and the public the ability to study 3D models in the Smithsonian’s collection in the highest resolution detail from anywhere in the world.”


    Cesium Stories enable 3D storytelling

    Cesium Stories enable creation and sharing of 3D geospatial presentations on the web, without requiring any writing of code. An intuitive interface enables story creation using Cesium’s 3D world terrain basemap, the user’s own 3D data, or a combination of multiple datasets, fused into interactive scenes. Learn more here.


    Making massive high-resolution 3D models shareable begins at the intersection of Cesium’s core competencies of computer graphics, 3D data and open standards. With Cesium, glTF models are converted to 3D Tiles, an open specification developed by the company and adopted by the Open Geospatial Consortium (“OGC”) to make sharing massive amounts of 3D data as simple as sending a link.

    Cesium develops, supports, and promotes open standards with organizations like the OGC and The Khronos Group to advance technology, encourage collaboration and fuel cross-disciplinary innovation.

    The Space Shuttle Discovery — on display at the James S. McDonnell Space Hangar at the National Air and Space Museum’s Steven F. Udvar-Hazy Center in Chantilly, Virginia — is one of the largest objects in the Smithsonian’s collection. It is more than 122 feet long and weighs more than 4.5 million pounds.

    Now, a shareable, high-resolution 3D rendering will enable anyone to rotate, zoom in, and study its details from anywhere in the world.

    Explore the 3D model at www.cesium.com/smithsonian.

  • Golden Software Grapher 14 offers enhanced plotting functions

    Image: Golden Software
    Image: Golden Software

    Golden Software, a developer of software for data visualization and analysis, has released Version 14 of the Grapher scientific graphing package with new plotting and customizing functionality. Available today, Grapher 14 is downloadable by all users with active maintenance agreements.

    A preview version of Grapher 15 is now available, giving active users pre-release access to new fit curve and statistical plotting capabilities.

    “Grapher users will find we have focused overall on making the software easier to use in version 14 and the version 15 Preview,” said Leslie McWhirter, Grapher product manager. “New plotting functions were created as a direct result of feedback from users.”

    The Grapher software gives users deeper insights into their data by providing them with 80 flexible and easy-to-use 2D and 3D graphing tools for plotting, analyzing and displaying scientific data sets. The package is used extensively by scientists and engineers in oil & gas operations, hydrologic/geochemical studies, environmental consulting, mineral exploration and academic research.

    The most notable new or upgraded features in Grapher 14 include the following:

    • Enhanced Plotting – Ability to plot data in rows and columns, perform one-button Durov class plots, and easily generate multi-plot reports.
    • Improved Bar Charts – Bar charts are more versatile, offering variable bar widths and differentiated fill colors for negative and positive.

    With Grapher 14 now available, Golden Software developers have already begun creating the Preview version of Grapher 15. This allows customers to try new functions relatively early in the development process and provide feedback before the final version is released.

    “In Grapher 15 Preview, we are developing new features related to fit curve, axes and statistical functionality,” said McWhirter. “These will improve the ability of Grapher users to model, analyze and interpret their data.”

    Specifically, these Grapher 15 upgrades will include:

    • Fit Curve Improvements – At the request of geologists, geophysicists, mining and oil-and-gas professionals, it is now possible to add X=F(Y) fit curves to model borehole log data. Fit curves can now also be added to class plots to model all or individual classes.
    • Axes Upgrades – Break Axes are enhanced so users can customize the break mark and add a break distinguisher to the plot itself. Ternary plots have also been upgraded to enable users to rotate the axis direction, a useful option in geochemical analysis.
    • Statistical Enhancements – Grapher 15 Preview will give users greater control over how values in Box-Whisker plots are graphed. In addition, there will be new mathematical options to expand on the functionality of the summation plot.

    Other upgrades in Grapher 15 Preview will include the following:

    • Vary color fills above and below the intersection of two plots
    • Specify custom colors via RGB values to color scatter plot symbols
    • Assign colors from a gradient to scatter plot symbols based on numeric worksheet values

    Grapher exports integrate seamlessly with all Golden Software packages, including Surfer for data visualization and mapping, Voxler for 3D data rendering, and Strater for subsurface modeling.

    Details on Grapher 15 Preview may be accessed here: What is Grapher Preview.

  • Golden Software enhances 3D data visualization in Surfer 16

    Topographic surface with well sample data and water level. (Image: Golden Software)
    Topographic surface with well sample data and water level. (Image: Golden Software)

    Golden Software, a developer of scientific graphics software, has enhanced the visualization capabilities in version 16 of its Surfer gridding, contouring and 3D surface mapping package. Geologists, environmental consultants and geospatial professionals can use Surfer 16 to interpret complex scientific data.

    “We have improved every aspect of core functionality in Surfer 16 so it’s faster and easier to make meaningful custom maps,” said Golden Software CEO Blakelee Mills. “Surfer users will find the new version generates more accurate representations of physical, chemical and structural properties, allowing them to make better decisions.”

    Surfer is a robust 3D data visualization and mapping software that enables users to model their data sets, apply an array of advanced analytics tools, and graphically communicate the results. Known for its fast and powerful contouring algorithms, Surfer is used extensively by geologists in mining and oil & gas activities and by hydrologists in environmental monitoring projects.

    The primary improvements in Surfer 16 have been made in the color mapping and Contour Map capabilities:

    Equal Area Stretch. Similar to Histogram Equalization, this new feature lets the user stretch colors across the distribution of data, creating a proportionate representation of the data variation and enhancing the visualization’s contrast. This means that tightly distributed data can be displayed as quickly varying colors in the generated colormap, making it easier to spot anomalies in data values. Colors can be stretched automatically or manually across the histogram of data values.

    Equal Area Contouring. Another new feature added to surface mapping functionality, Equal Area Contouring allows the user to calculate the geographic distribution of contours so they align more precisely with the geophysical data they represent. This results in a more accurate visualization of geophysical data sets, which are seldom linearly distributed.

    “The combination of Equal Area Stretch and Contouring creates striking visual maps that vividly highlight data distribution,” said Mills. “This makes it easier to interpret and understand geophysical and geochemical concentrations in the subsurface.”

    Surfer 16 includes three other enhancements:

    • True 3D Point Data. Surfer has always accurately displayed lidar point cloud data, and this 3D visualization capability has been expanded. Now any 3D vector data can be represented in three dimensions in 3D View. Clients who use Surfer to visualize subsurface wells can use this to display the well path. It can also be applied to quickly check the quality of 3D grids.
    • Enhanced Attribute Management. Surfer now has commands to calculate geometry — such as area or perimeter length — and add those values to object attributes. These calculations can be performed either to create new attributes or modify existing ones with updated information. One of the key advantages of this enhancement is that area data can be normalized and attributed to objects for generation of more accurate choropleth maps.
    • Kriging with External Drift. Surfer is known for its powerful kriging functions, and this capability is even better in v16 with the addition of Kriging with External Drift. This allows users to add a secondary data set for use as a proxy in interpolating the primary data set with the goal of yielding better estimated values. Surfer users asked for this new function because it typically lets them obtain and use less expensive data sets to supplement a more expensive one.

    “Surfer has a reputation for high-quality graphic outputs, powerful gridding algorithms, and ease of use – and we have improved each of these capabilities in Surfer 16,” Mills said.