NASA has awarded PlanetiQ an expanded contract through its Commercial Smallsat Data Acquisition (CSDA) program, broadening access to commercial satellite data for the scientific community.
The contract expands PlanetiQ’s CSDA portfolio to add high-SNR GNSS polarimetric radio-occultation data to PlanetiQ’s existing NASA CSDA offerings of ionospheric scintillation, ionospheric total electron content, and high-SNR GNSS radio-occultation data.
The expanded data offering will provide government researchers with access to advanced GNSS observations that can help improve the understanding of precipitation processes, atmospheric structure, and Earth system dynamics.
Polarized radio occultation (PRO) measurements have demonstrated the ability to characterize precipitation, detect rain and snowfall structure, identify melting layers, and observe variations in storm intensity. PlanetiQ uses a unique receiver to collect data with a high signal-to-noise ratio (SNR). High-SNR measurements are particularly important for precipitation applications because increased SNR improves sensitivity to lighter precipitation and certain cloud structures.
“By making polarized radio occultation data available through the CSDA program, NASA is enabling a broader research community to investigate new applications for these observations,” said E. Robert Kursinski, chief scientist, PlanetiQ. “As more researchers gain access to high-SNR PRO data, we expect both the scientific understanding and the potential operational uses of the technology for precipitation and severe weather monitoring to expand.”
PlanetiQ’s GNSS-PRO measurements are acquired using high-rate, high-SNR receivers that enhance the detection of precipitation signatures and cloud structures. In addition to supporting atmospheric science research, these measurements are critical for operational applications related to rainfall characterization, snowfall detection, storm monitoring, and weather forecasting.
Researchers interested in learning more about GNSS-PRO and precipitation sensing can watch PlanetiQ’s recent webinar.
GNSS CORS network to be established on university grounds
Global GIS (Pvt) Ltd, a pioneer in geospatial positioning solutions in Sri Lanka, has entered a Memorandum of Understanding with the University of Ruhuna to collaborate with the Department of Civil and Environmental Engineering and the Department of Electrical and Information Engineering of the Faculty of Engineering.
Areas identified for collaboration include conducting research and development activities, developing and commercializing new inventions and solutions, industry projects and consulting opportunities, and disseminating scientific knowledge to meet the growing demand of surveying and geospatial technologies and to increase efficiency and sustainability in the nation’s engineering industries and its thematic requirements.
“We are honored to enter this mutually beneficial collaboration with the University of Ruhuna to enhance capacity and support the growing geospatial and surveying industry in Sri Lanka,” said Nishshanka De Silva, sureyor and CEO-managing director of Global GIS. “We aim to take the industry in Sri Lanka to the next level with new innovative products and solutions while building sufficient capacity to undertake the country’s next phase of growth. Geospatial and surveying technology plays a significant role in sustainable infrastructure planning, renewable energy, disaster management, optimizing natural resource allocation, and many other areas as Sri Lanka pursues its national development goals.”
Under the MOU, Global GIS will establish a high-precision GNSS Continuously Operating Reference Station (CORS) network station at the university to enhance the university’s capacity for advanced GNSS-based research and applications to promote GNSS technology among government, semigovernment, and private organizations.
Global GIS will also open a funding avenue to
support research and development activities for the duration of the agreement,
provide necessary commercialization experience and business knowledge for new inventions and solutions,
conduct training and internship opportunities for the undergraduates on surveying and geospatial technologies to foster skill development and practical experience, and
leverage its “Authorized Agent” status for the brands it promotes in Sri Lanka to enhance the University of Ruhuna’s capacity in the latest surveying and geospatial technologies.
New algorithm cuts indoor positioning error by nearly half
Conventional indoor positioning often depends on expensive Wi-Fi or Bluetooth infrastructure, or on inertial sensors that accumulate drift within seconds. Magnetic navigation has emerged as a promising alternative because steel structures and electronics leave buildings with unique, location-specific magnetic signatures.
However, existing map-free methods rely on polynomial models that oversimplify the magnetic field’s spatial variations. They capture the broad trend but miss the sharp, local anomalies caused by metal pipes or distribution boxes.
With these limitations, a more accurate, robust, and physically interpretable approach to magnetic field modeling is urgently needed for practical indoor navigation.
A team from the Aerospace Information Research Institute, Chinese Academy of Sciences, publishing (DOI: 10.1186/s43020-026-00201-3) in the journal Satellite Navigation on June 5, has unveiled a robust magnetic-inertial odometry (MIO) method based on the Fibonacci sphere-sampled equivalent magnetic dipole model, denoted as FSS-EMD-MIO. The system uses an array of 30 small magnetometers and an inertial measurement unit to track movement without any external signals.
The core innovation lies in how the system models the indoor magnetic environment. Instead of drawing smooth curves through the data, it represents the local field as a combination of virtual “equivalent magnetic dipoles” — with 16 dipoles identified as optimal through systematic parameter analysis.
Their positions are determined by the Fibonacci sphere sampling technique, which evenly distributes points in 3D space without any directional bias, preventing overfitting. Each dipole’s magnetic moment is then solved in real time using least squares fitting.
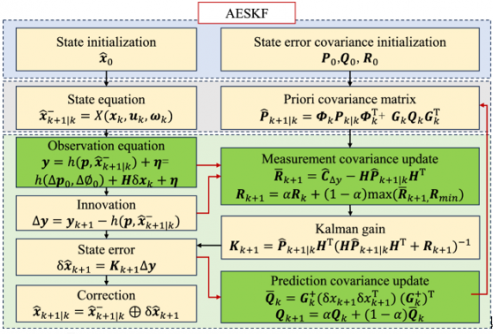
The team also derived the spatial gradient of this model, creating a direct mathematical link between changing magnetic readings and the carrier’s displacement, velocity, and attitude. To handle the inherent nonlinearity and location-dependent noise, an adaptive error state Kalman filter fuses inertial data with magnetic observations. Tested on a public dataset, the method achieved a horizontal positioning root mean square error below 1.27 meters, outperforming the previous state of the art (MAINS) by 46% on average.
“The old polynomial methods look at the magnetic field from far away — they see the hills but not the potholes. Our model places virtual sources exactly where the magnetic perturbations live,” the authors explained. “The Fibonacci sphere sampling ensures that no direction is favored, so whether you tilt the sensor or walk in circles, the system adapts reliably. We essentially gave the building’s chaotic magnetic field a readable 3D structure. This means first responders or warehouse robots can finally have a ‘magnetic compass’ that works even when the lights are off and GNSS is out.”
The research paves the way for truly infrastructure-free indoor navigation. Potential applications include guiding firefighters through smoke-filled buildings, tracking inventory robots in steel-racked warehouses, and providing positioning for autonomous vehicles in parking garages or mines. The authors note that future work will incorporate loop-closure detection to correct long-term drift, akin to how a person recognizes a familiar intersection.
By developing scan-matching algorithms based on overlapping magnetic field regions, the team aims to build a complete magnetic simultaneous localization and mapping (SLAM) system for multi-floor buildings, further closing the gap between outdoor and indoor navigation reliability.
Topcon Positioning Systems attended GEO Business in London this month to showcase its latest solutions to improve survey and geospatial workflows.
The event, which took place at Excel London June 4-5, showcased hardware, software and workflow technologies across capture reality, surveying solutions, engineering surveys, and GIS mapping and utilities, including the company’s new suite of 3D scanning solutions. The scanning solutions offer integrated software that enables high-speed data capture and immediate analysis for a wide array of geomatics applications.
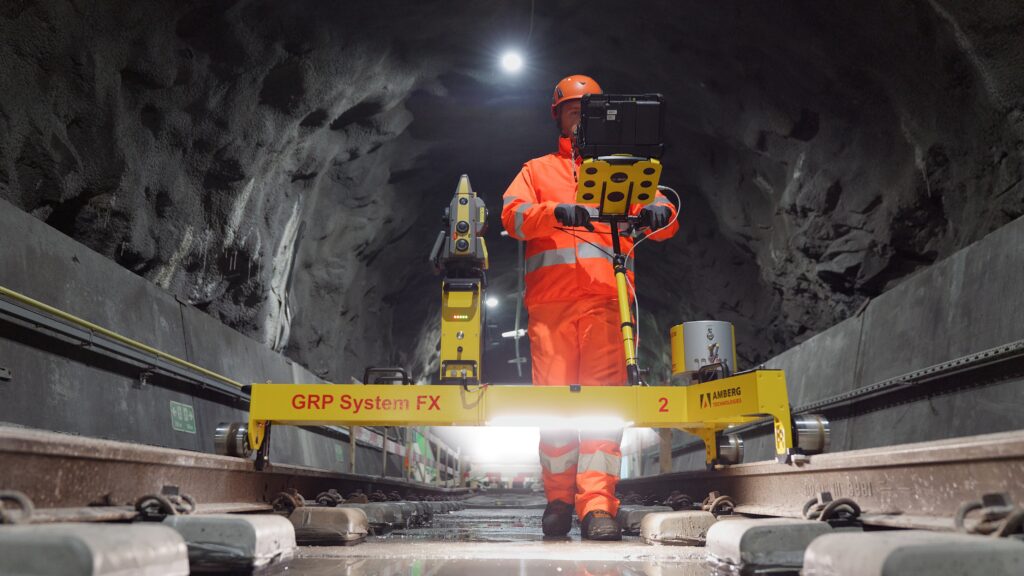
Topcon is partnering with Amberg Technologies on rail solutions. (Credit: Topcon)
“Smarter workflows for rail survey data”: Bruno Fileno, senior segment manager geomatics, gave an in-depth look at integration efforts between Topcon and Amberg Technologies that focus on how interoperable workflows streamline surveying tasks such as track alignment, geometry verification, and clearance assessment.
“Control, confidence, custody: How surveyors defend georeferenced SLAM workflows”: Phil Marsh, director of scanning sales EMEA, shared a practical framework for delivering georeferenced SLAM results, with tips on combining RTK with survey control and independent checkpoints, and building a lightweight QA pack to prove accuracy – producing outputs surveyors can get behind and clients can sign off.
“From ground to cloud: Transforming utilities with accessible digital workflows”: Nathan Ward, business development manager, utilities solutions EMEA, explored the newest innovations in utilities mapping, explaining how seamless data capture with the Topcon CR-H1 handheld device and automated cloud processing can deliver date-stamped records that cut delays, reduce rework, and speed up sign-off and payment.
The National Association of Broadcasters (NAB) has launched Merkhet Solutions, an independent company focused on the commercial deployment of the Broadcast Positioning System (BPS).
BPS, first conceived by the technology team at NAB in 2021, is a patented terrestrial, GPS-independent timing and positioning technology that leverages the high-power, geographically diverse broadcast infrastructure already covering the United States.
BPS has been designed to address the more than $1 billion-per-day economic and national security risk posed by overreliance on GPS. Merkhet Solutions is engaging across critical infrastructure sectors, including energy, data centers, telecommunications and financial services – where a loss of precision time can trigger grid instability, outages and lost trades.
“BPS represents a powerful intersection of innovation, public safety and opportunity for broadcasters,” said NAB President and CEO Curtis LeGeyt. “Launching Merkhet Solutions is the next step in commercializing this technology and ensuring it reaches the critical-infrastructure operators who need it most, while continuing to create meaningful long-term opportunities for local stations.”
“BPS solves a problem we can no longer afford to ignore: an entire economy and national security posture resting on a single, contested signal from space,” said Merkhet Solutions CEO Sam Matheny. “We built BPS at NAB because broadcast infrastructure is uniquely suited to deliver assured terrestrial timing at scale. We’re launching Merkhet Solutions because the time to operationalize this technology is now.”
Under Matheny’s leadership at NAB, BPS has advanced rapidly from research concept to real-world deployment. NAB demonstrated the first BPS prototype to the U.S. Department of Transportation (DOT) in 2022, followed by the first live broadcast demonstration in 2023.
In 2024, NAB entered into a Cooperative Research and Development Agreement (CRADA) with the National Institute of Standards and Technology (NIST) and Nexstar Media Group. In 2025, NIST concluded in a peer-reviewed paper presented at the Institute of Navigation International Technical Meeting that BPS was “comparable to or better than GNSS” for time transfer stability and a “viable complementary PNT solution.”
Later that year, the U.S. DOT awarded NAB a contract to deploy a BPS field trial with critical-infrastructure partner Dominion Energy.
BPS is designed as a terrestrial complement to GPS, providing operators with an additional resilient source of timing and positioning that can be used alongside GPS or relied upon when satellite-based services are disrupted by jamming, spoofing, cyberattacks or natural events. The need for terrestrial complements to GPS has been recognized by the U.S. government through the National Timing Resilience and Security Act and Executive Order 13905.
The adoption of the new, modernized National Spatial Reference System (NSRS) is rapidly approaching, with official implementation now expected in the first quarter of 2027.
One of the most common questions I receive during presentations is: How will the National Geodetic Survey (NGS) account for plate tectonics in the modernized NSRS, and what does that mean for my geospatial products and services?
First, I have some very sad news to share.
Dr. Chris Pearson
Our friend and colleague, Dr. Chris Pearson, unexpectedly passed away while in Cape Town attending the May 2026 International Federation of Surveyors (FIG) conference. At the time, he was serving as a Geodetic Advisor for Trimble and as co-chair of FIG Commission 5.2.
Chris previously worked for the National Geodetic Survey (NGS) as a Geodetic Advisor, where he played a key role in developing the comprehensive block model of crustal deformation — widely known as HTDP — across the western United States, including Alaska.
He was an active and respected member of several professional organizations and will be greatly missed by the entire geodetic and surveying community.
Plate tectonics is the scientific theory that describes how Earth’s outer shell, known as the lithosphere, is divided into large, rigid pieces called tectonic plates. These plates float atop the hotter, more ductile rock in the mantle below and move very slowly — roughly at the same rate as your fingernails grow, about 1 to 10 centimeters per year.
So why does plate tectonics matter for geodetic coordinates? Because the most significant geological activity — including earthquakes, volcanic eruptions, and crustal deformation — occurs primarily at the boundaries where these plates interact.
My last newsletter highlighted several activities by the North Carolina 2022 Reference Frame Working Group (NC RFWG) that are addressing this issue and other challenges related to the implementation of the new NSRS.
During my presentations on the modernized NSRS, I always show the National Geodetic Survey (NGS) maps that illustrate the approximate horizontal and vertical changes expected when the new Terrestrial Reference Frames (TRFs) are adopted, with coordinates referenced to epoch 2020.00. These maps provide a high-level (“30,000-foot”) overview of the anticipated changes. However, they do not include the level of detail that many users are looking for.
Participants at these seminars and meetings consistently want to know the expected coordinate differences for their specific state or local region, and how the time-dependent components will impact their work.
Most geospatial users now understand that International Terrestrial Reference Frame (ITRF) coordinates include a velocity component caused by tectonic plate movement. To manage these changing coordinates, the National Geodetic Survey (NGS) plans to incorporate time-dependent modeling. NGS has developed two key models — EPP2022 and IFDM2022 — to make time-dependent geodetic control practical and usable.
EPP2022 (Euler Pole Parameters) describes the rigid rotation of tectonic plates.
IFDM2022 (Intra-Frame Deformation Model) computes the internal deformation and drift within a tectonic plate.
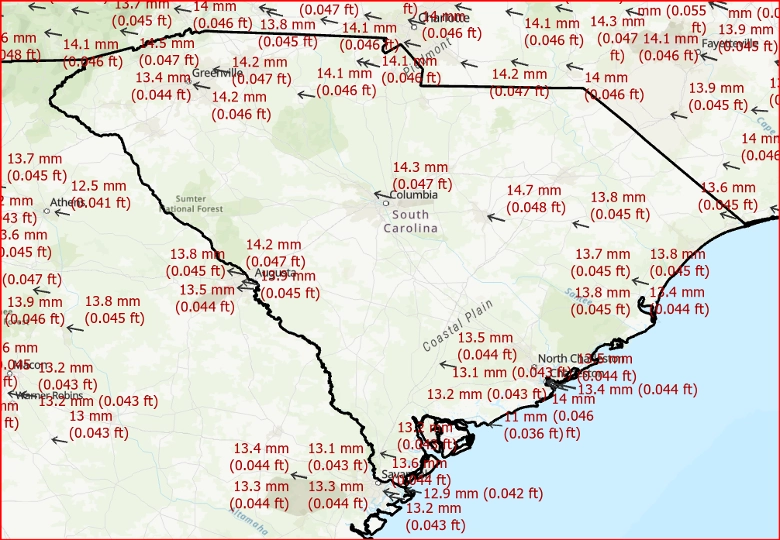
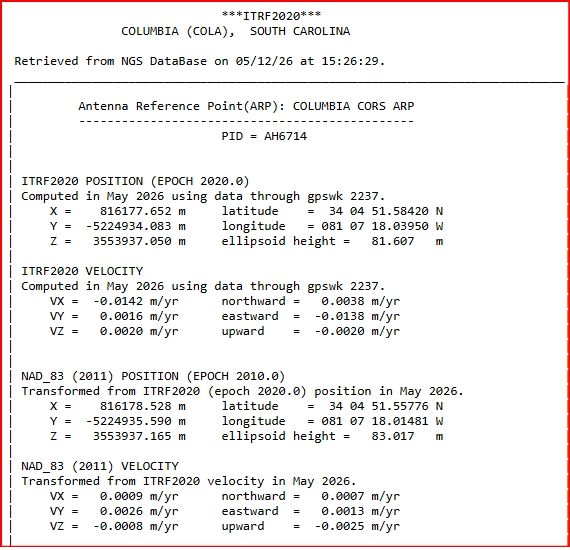
As shown in the figure below, the NOAA CORS Network station COLA in Columbia, South Carolina — located on the North American Plate — is moving at approximately 0.05 feet (14 mm) per year.
This velocity is provided on the published ITRF2020 position and velocity data for the station (NGS CORS Position and Velocity Sheet for COLA). As a result, a surveyor working in June 2026 would observe a shift of about 0.3 feet in the ITRF2020 horizontal coordinates compared to the 2020.00 reference epoch, solely due to tectonic plate motion.
Motion due to plate movement (rates per year) – based on ITRF2020 velocity rates
(Image: Dave Zilkoski)
The National Geodetic Survey (NGS) provides detailed information for all NOAA CORS Network (NCN) stations on the NGS NCN Station Pages.
In the section titled “Coordinates and Velocities”, simply click the Position and Velocity button to view the station’s ITRF2020 coordinates and velocities (referenced to epoch 2020.00), as well as the NAD 83 (2011) coordinates and velocities (referenced to epoch 2010.00).
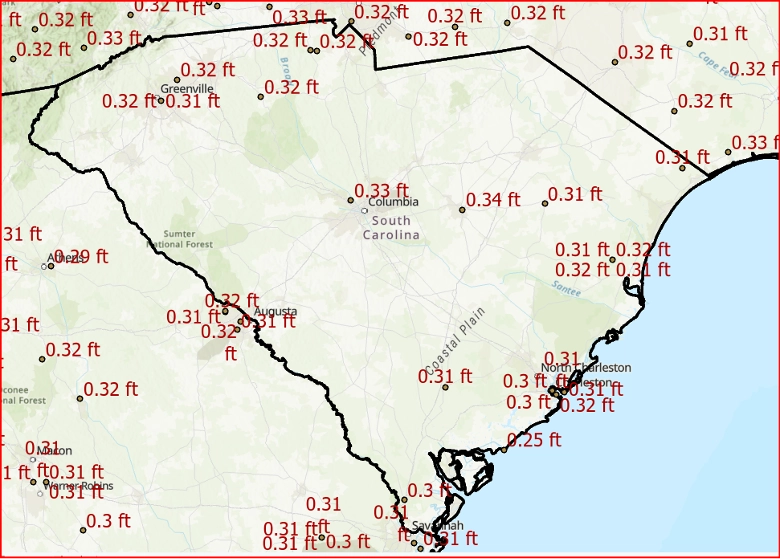
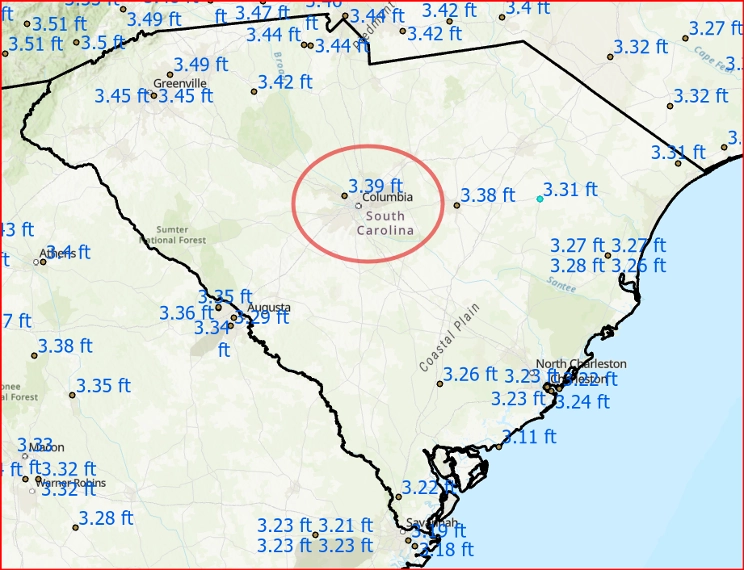
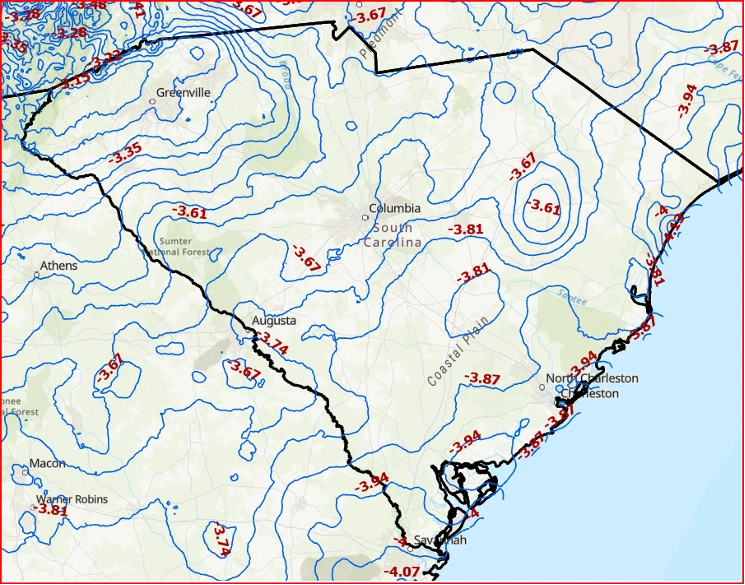
As previously mentioned, the National Geodetic Survey (NGS) is expected to adopt the new modernized NSRS in the first quarter of 2027. The figure below shows the change in ITRF2020 coordinate values between epoch 2020.00 and 2027.00 for NOAA CORS Network (NCN) stations in South Carolina. This shift of approximately 0.33 feet (10 cm) is the result of seven years of tectonic plate motion.
ITRF2020, Epoch 2020 to ITRF2020, Epoch 2027 (units ift)
Image: Dave Zilkoski
That said, what will the change in NATRF2022 coordinate values be between epoch 2020.00 and 2027.00?
This is where NGS’s EPP2022 and IFDM2022 models become essential. My February 2022 and July 2024 GPS World newsletters discussed the Euler Pole Parameters (EPP) process in detail.
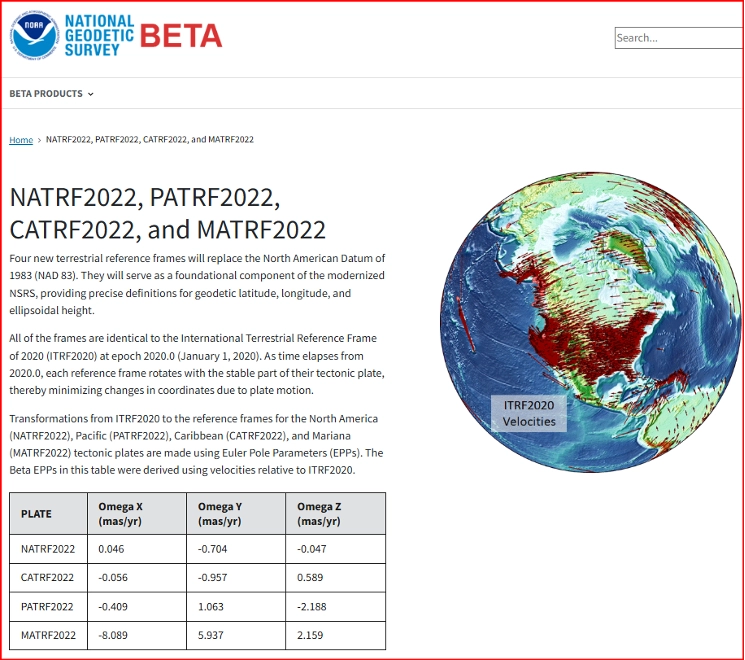
The Beta NATRF2022 website provides the Euler Pole Parameters (EPP) needed to define the relationship between ITRF2020 and the new NATRF2022 frames for the North American, Caribbean, Pacific, and Mariana plates, as outlined in NGS’s Blueprint Part 1 document. The values in the table have proven especially useful to programmers developing and testing their software.
As stated in Blueprint Part 1, the National Geodetic Survey (NGS) will define the official relationship between ITRF2020 and the four NSRS Terrestrial Reference Frames (TRFs) through Equation 59. This equation uses the rotation matrix provided in Equation 58, which results in Equation 60.
See the box titled “Official Relationship Between ITRF2020 and the Four NSRS TRFs” for the equations.
Official relationship between ITRF2020 and the four NSRS TRFs
(Image: NGS Blueprint pt. 1)
So, what does this mean for surveyors?
The primary purpose of the EPP2022 model is to remove the rigid tectonic plate motion from the coordinates. After applying the EPP2022 model to the ITRF2020 coordinates at epoch 2027.00, the resulting NATRF2022 horizontal coordinates for station COLA (epoch 2027.00) will change by only 0.04 feet (12 mm).
EPP applied
NATRF2022, Epoch 2020 to NATRF2022, Epoch 2027 in SC (units ift)
Image: Dave Zilkoski
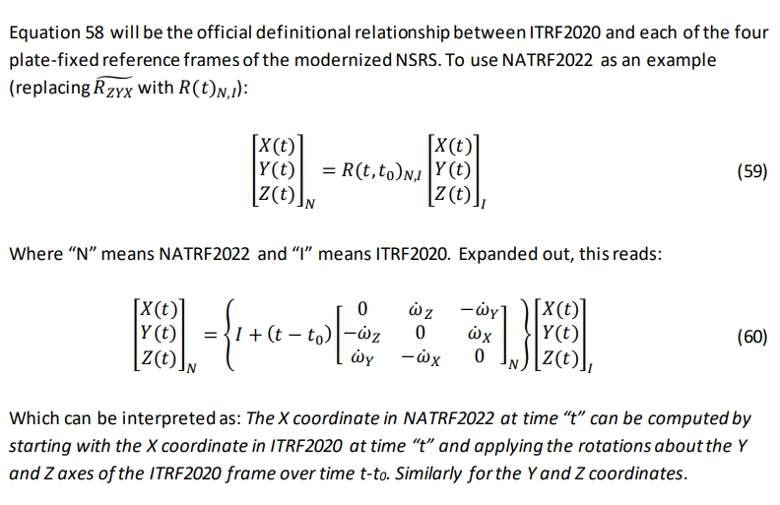
As shown in the figure, the EPP2022 model removes most of the horizontal movement caused by seven years of tectonic plate motion — reducing it to just 0.04 feet (1.2 cm) at station COLA. In other words, the EPP model effectively removes the vast majority of plate tectonic effects.
Additionally, the plot shows that the relative horizontal differences between nearby marks are very small — typically less than 0.01 feet (0.3 cm).
As previously mentioned, the NGS maps provide a high-level (“30,000-foot”) view of the expected changes between the current NSRS and the new modernized NSRS. So, what are the anticipated differences between NAD 83 (2011) and NATRF2022 specifically in South Carolina?
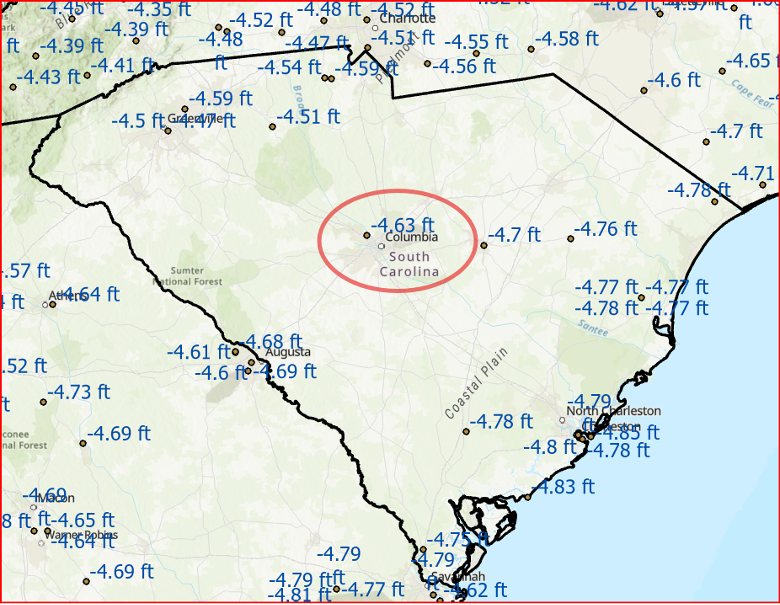
The figures below illustrate the differences in both horizontal position and ellipsoid heights between NAD 83 (2011) and NATRF2022 coordinates across South Carolina.
NAD83 (2011), Epoch 2010 to NATRF2022, Epoch 2020 Horizontal Changes in SC(Units ift)
NAD83 (2011), Epoch 2010 to NATRF2022, Epoch 2020 Ellipsoid Height Changes in SC(Units ift)
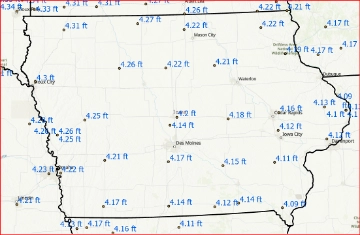
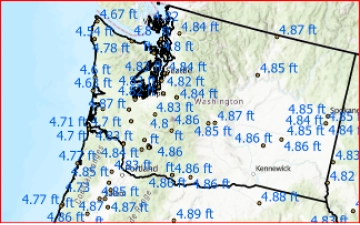
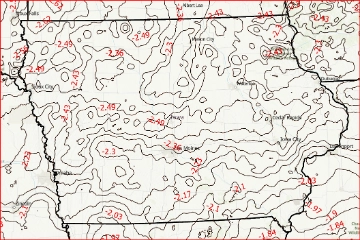
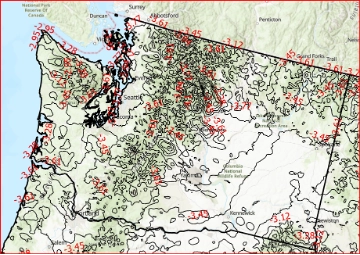
The magnitude of these changes varies depending on your location. To illustrate this, I’ve provided two additional examples: one for Iowa and one for Washington State. As the plots clearly show, the differences in these states are noticeably different from those depicted for South Carolina.
That said, the differences between NATRF2022 at epoch 2020.00 and epoch 2027.00 in Iowa and Washington State — after applying the EPP2022 model — are very similar to the values shown for South Carolina.
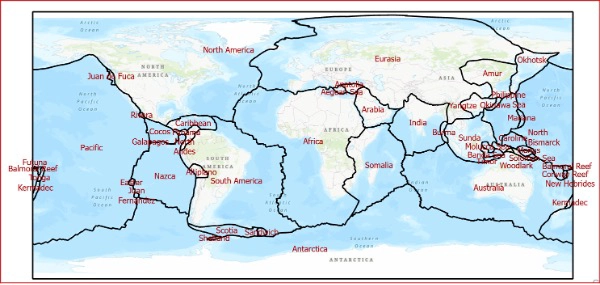
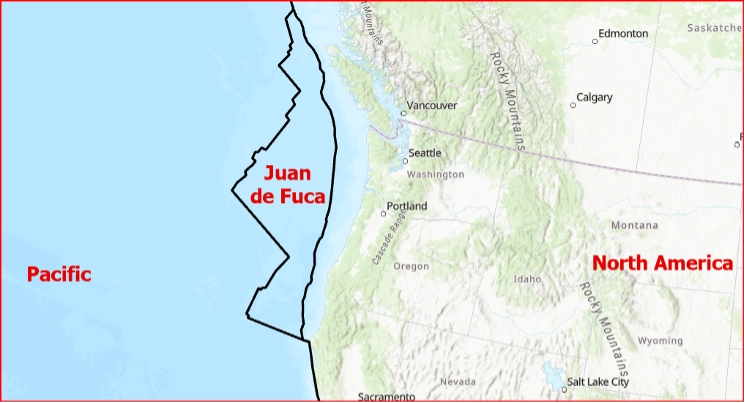
However, readers should note that the differences in Washington State increase as you move toward the coast. This is because the area lies near the boundary between the North American Plate and the Pacific Plate. The Juan de Fuca Plate, a small microplate in the eastern North Pacific, is also actively involved in this region.
(See the box titled “Juan de Fuca Plate.”)
NATRF2022, Epoch 2020 to NATRF2022, Epoch 2027 (units ift)EPP Applied
What about orthometric height changes in the new NSRS?
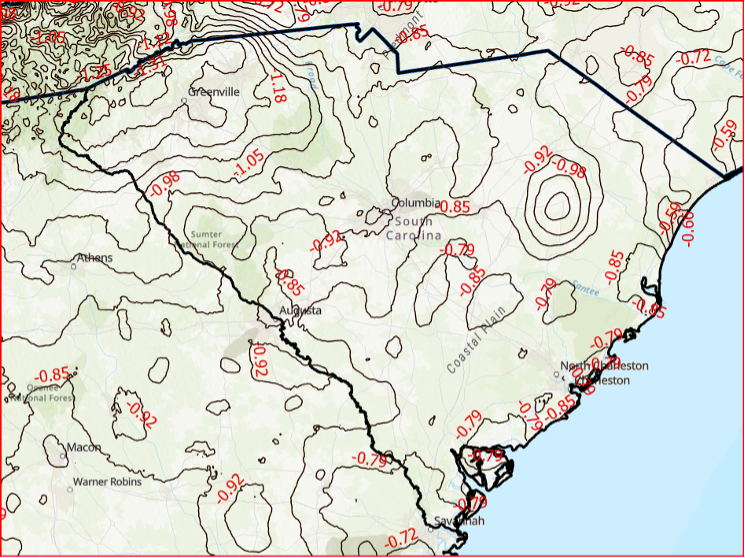
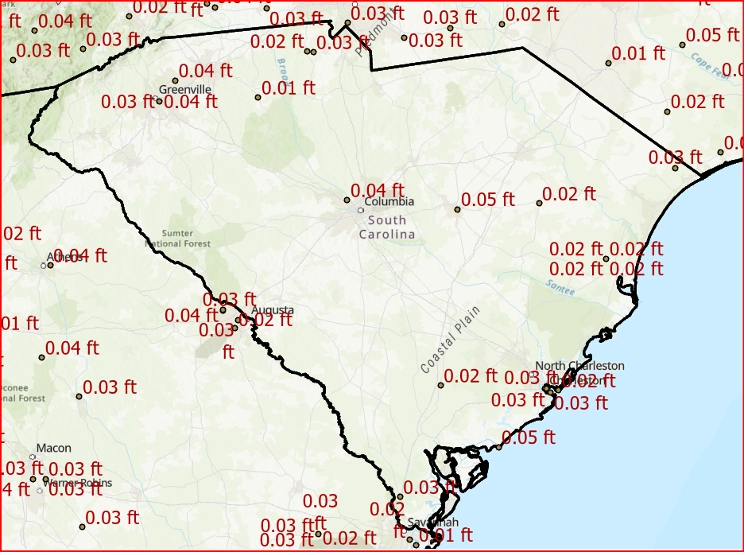
As an example, the orthometric height differences between NAPGD 2022 and NAVD 88 in South Carolina are expected to range from approximately -0.8 feet to -1.3 feet.
Difference between NAPGD2022 and NAVD 88 (Units ift) in S.C.
Image: Dave Zilkoski
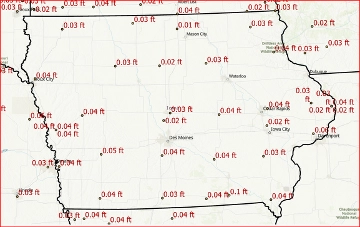
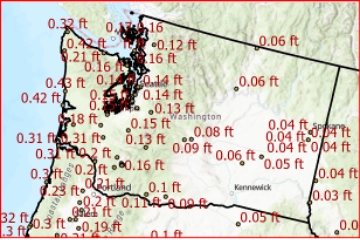
The differences between NAPGD 2022 and NAVD 88 vary significantly depending on your location. The figures below illustrate these orthometric height differences for Iowa and Washington State as examples.
Difference between NAPGD2022 and NAVD 88 (Units ift)
The new NSRS will use a gravimetric geoid (GEOID2022) rather than a hybrid geoid (GEOID18) to compute GNSS-derived orthometric heights.
During my presentations, I always remind participants that a hybrid geoid is not a “true” geoid. It is simply a transformation model that converts ellipsoid heights in one reference frame to orthometric heights in a specific vertical datum. Specifically, GEOID18 is a transformation tool that allows users to derive NAVD 88 orthometric heights from NAD 83 (2011), epoch 2010 ellipsoid heights.
The figure below shows the differences between the gravimetric geoid model GEOID2022 and the hybrid geoid model GEOID18.
Important note: Users cannot use GEOID18 with NATRF2022 ellipsoid heights to obtain NAVD 88 orthometric heights. Instead, GEOID2022 must be used with NATRF2022 ellipsoid heights to compute orthometric heights in the new vertical datum, NAPGD 2022.
Differences between GEOID2022 and GEOID18 in SC (Units ift)
As noted at the outset of this newsletter, the transition to the modernized National Spatial Reference System (NSRS) is rapidly approaching, with official implementation scheduled for the first quarter of 2027.
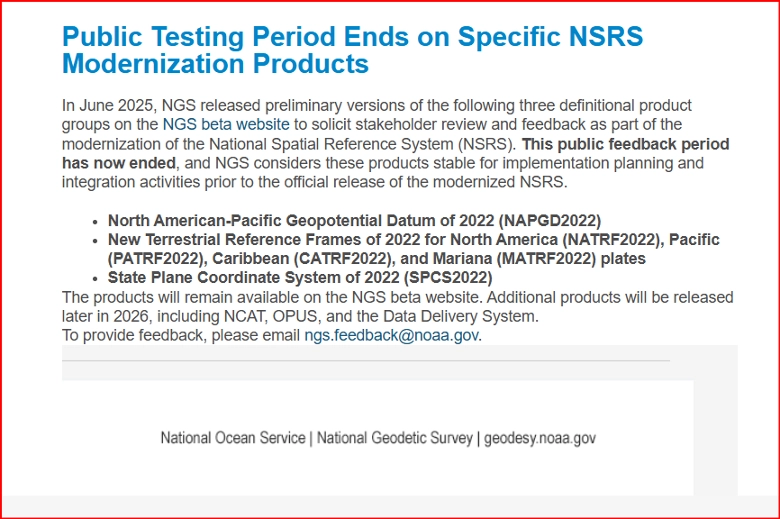
The National Geodetic Survey (NGS) released the following announcement on May 28, 2026:
Public Testing Period Ends for Key NSRS Modernization Products
NGS has declared the following products stable and ready for implementation planning and integration activities ahead of the official release:
North American-Pacific Geopotential Datum of 2022 (NAPGD2022)
New Terrestrial Reference Frames of 2022:
North America (NATRF2022)
Pacific (PATRF2022)
Caribbean (CATRF2022)
Mariana (MATRF2022)
State Plane Coordinate System of 2022 (SPCS2022)
Additional modernization products, including NCAT, OPUS, and the Data Delivery System, are scheduled for release later in 2026.
NGS news
Public testing period ends on specific NSRS modernization products
This newsletter highlighted the role of the EPP2022 model in accounting for plate tectonics and illustrated the anticipated local differences between the current National Spatial Reference System (NSRS) and the upcoming modernized version.
Future editions will continue to explore additional NGS Beta products as they are released later in 2026.
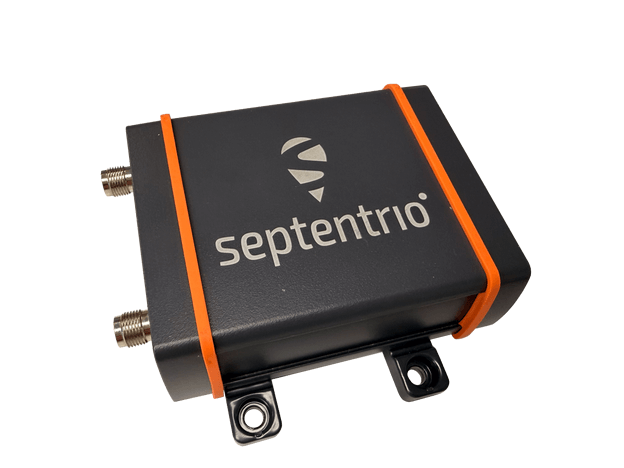
The AsteRx EB offers high-accuracy positioning and GNSS heading for industrial robots, port logistics, marine and scalable automation applications. Its IP67 enclosure protects the receiver from harsh weather conditions, while built-in advanced GNSS+ algorithms ensure reliable operation in environments challenging for GNSS, such as areas with foliage or near GNSS interference sources. The RAIM+ integrity monitoring system ensures truthful positioning — essential for autonomous navigation. The compact enclosure of AsteRx EB enables easy installation, reducing time-to-market. In a dual-antenna configuration, AsteRx EB delivers sub-degree GNSS heading for systems that require orientation in addition to RTK positioning. The built-in AIM+ anti-jamming and anti-spoofing technology protects the receiver from intentional or unintentional GNSS interference.
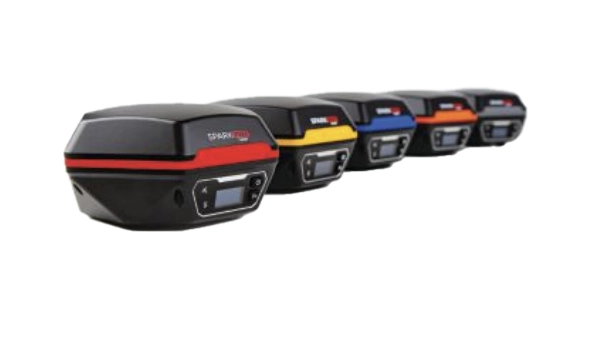
The Facet FP is a high-precision GNSS receiver designed to deliver centimeter-level accuracy with a focus on long-term flexibility, ease of use and open-source innovation. It combines multi-band, multi-constellation GNSS support with fully open-source firmware — the platform can adapt as technologies advance. Built to last, all models are contained in a robust waterproof cast-aluminum housing, with an internal structure designed for compatibility with the company’s Flex system of GNSS modules. This gives users the choice between three different modules, plus the choice of having tilt-compensation, offering six different options with a range of price points, securities and accuracies for various needs and applications.
The A65 GNSS antenna delivers exceptional accuracy, interference protection and robust GNSS tracking performance. Designed as a drop-in replacement for the widely deployed A45 antenna, the A65 offers users a seamless upgrade path to the latest precision technology. The industry collaboration reflects a shared focus on combining advanced RF design with real-world application insight to address increasingly complex GNSS operating environments, with both teams working closely from the earliest stages of development to meet demanding original equipment manufacturer (OEM) performance requirements. The antenna architecture, including the stacked patch quad feed element and RF front end, provides Calian’s XF Filtering. Hemisphere GNSS contributed application expertise, system integration requirements and performance validation within real-world machine control, agriculture, marine and survey environments.
Airborne Lidar
Long-range for UAV mapping and aerial surveillance
AlphaAir 6 is mounted on the X500 UAV during an urban mapping mission. (Credit: CHC Navgation)
The AlphaAir 6 airborne lidar system is designed for UAV-based laser scanning, drone lidar mapping and aerial surveying in high-relief and complex terrain. Combining prism scanning technology with a high-grade inertial navigation system (INS), the AlphaAir 6 delivers a maximum ranging capability of up to 2,100 m and supports efficient data capture at typical flight altitudes of 400 m to 600 m above ground level. It integrates an upgraded laser engine and a high-grade IMU with 0.3°/h bias stability to improve trajectory accuracy and point cloud quality. This design removes the need for pre-mission IMU calibration and supports stable, efficient data collection for topographic mapping, corridor mapping, and wide-area aerial survey workflows. It is available in single-camera and dual-camera configurations.
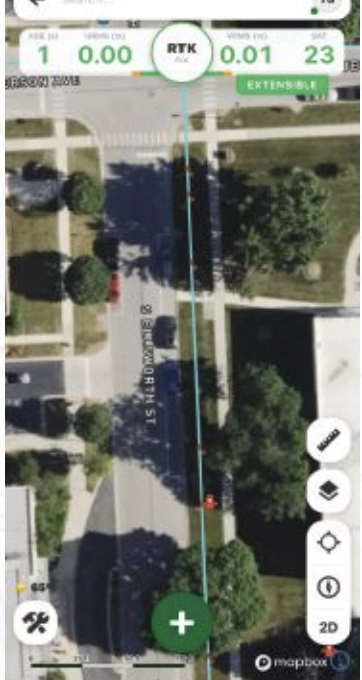
The FastXY mapping application for iOS and Android enables standard mobile devices to serve as professional-grade data-collection tools for geospatial information system (GIS) and architecture, engineering and construction (AEC) professionals. FastXY allows users to collect point, line and polygon data with devices they already own. It delivers advanced capabilities including 3D basemaps, construction staking, topographic surveying, on-the-fly datum transformations, and survey-grade elevations. A built-in Bluetooth data parser allows users to configure the app to collect data from any instrument supporting BLE Bluetooth or RS-232 — echosounders, radiation sensors, laser rangefinders, barcode scanners — and marry that data with precise GNSS coordinates.
New feature eliminates the need for a self-hosted NTRIP caster and delivers enterprise-grade correction data to up to three devices simultaneously at no additional cost to the operator
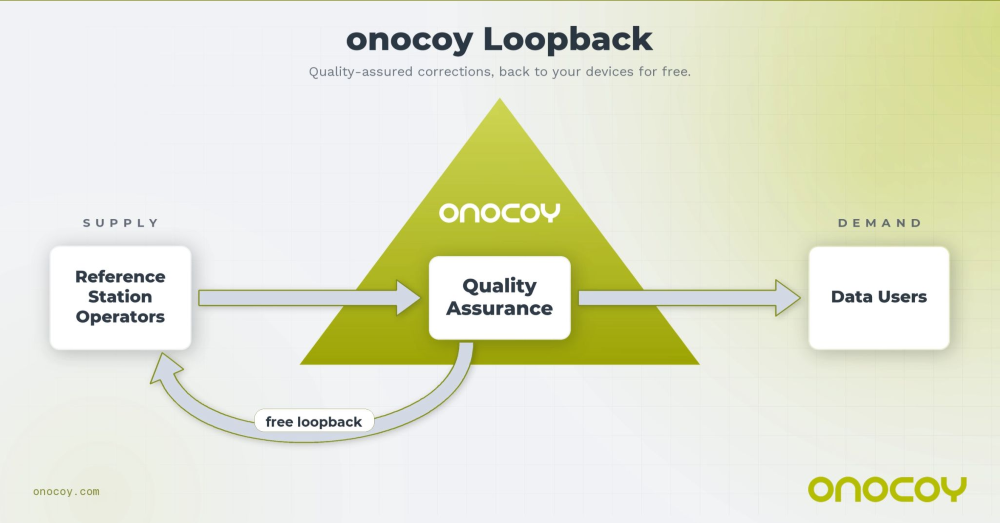
Onocoy, a decentralized GNSS reference station network, is launching Loop Back, a new platform feature that routes quality-assured RTK correction data back to each station operator’s own devices free of charge. More than 7,800 active reference stations contribute to the onocoy network.
Operators who also needed precision positioning for their own drones, survey rovers, precision agriculture equipment, or autonomous machinery face a common friction point: the reference station they owned and operated produces valuable correction data, but routing that data back to their own field equipment requires either a separately maintained NTRIP caster or an additional subscription. Loop Back eliminates both.
Loop Back is immediately available to all onocoy station operators as a standard platform feature. Full documentation and setup guides are available at docs.onocoy.com.
How Loop Back works
When a GNSS reference station is connected to onocoy, raw observation data flows from the operator’s hardware into onocoy’s quality validation pipeline. The platform continuously checks position stability, multi-constellation health (GPS, GLONASS, Galileo, BeiDou), uptime and other parameters before producing a quality-assured RTCM 3 correction stream.
That validated stream has two destinations simultaneously: enterprise data clients who purchase GNSS reference station data through onocoy’s pay-per-use model, and the station operator’s own devices via Loop Back. The operator receives the same production-grade correction stream used by commercial clients, free of charge and with no data credits consumed.
Key capabilities at launch:
Up to three simultaneous active connections from an operator’s own devices to their own station’s corrections, with unlimited devices configurable
Compatible with any NTRIP-capable station regardless of hardware brand or model
Quality monitoring identical to that applied to enterprise client streams
No separate NTRIP caster required; onocoy manages the infrastructure
Free of charge: No data credits consumed for the operator’s own station data.
Who benefits
Loop Back is designed for the growing segment of professionals who both operate a reference station and rely on precision positioning in their daily work. Target use cases include:
Precision agriculture: Farmers running auto-steered machinery, UAV-based crop monitoring, and variable-rate application systems
Geomatics and surveying: Professionals running a base station and multiple rover units across a site, eliminating the overhead of a local base-rover setup
Autonomous systems, robotics and drones: Operators deploying multiple vehicles or aircraft requiring cm-accurate positioning for mapping, inspection, or delivery workflows
Research: Academic and scientific teams running parallel measurement campaigns from a shared base station.
Economics of station operation
Most professionals who deploy a GNSS reference station do so because their business in precision agriculture, surveying, drone operations and construction demands one. By connecting that station to onocoy, operators put the same hardware to work a second time: contributing data to onocoy’s global network and earning rewards worth several hundreds of U.S. dollars per year.
That additional income is enough to amortize the station in under two years before accounting for potential savings on subscriptions. Because onocoy applies continuous quality monitoring to every stream, operators also safeguard the positioning accuracy their business depends on.
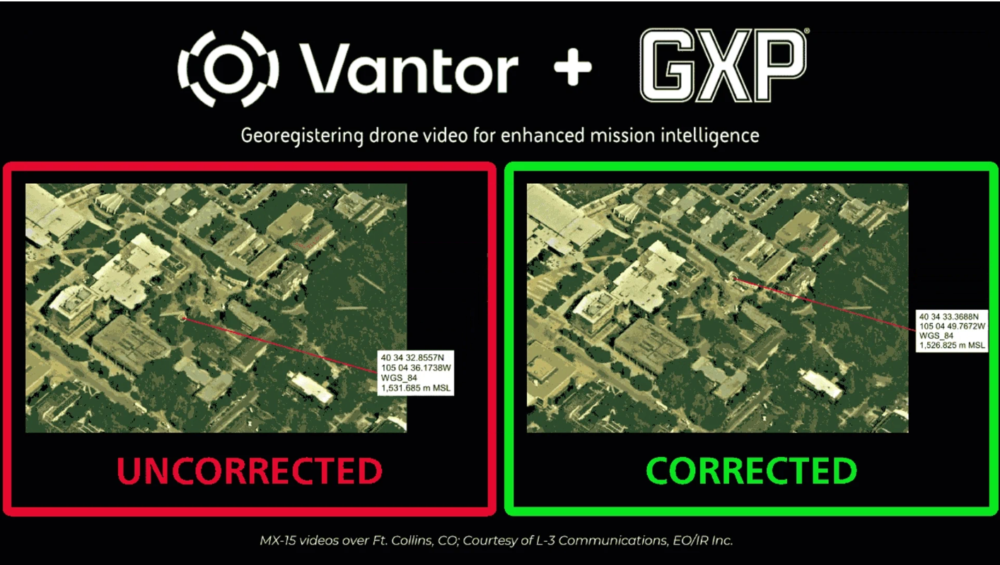
BAE Systems Geospatial eXploitation Products (GXP) and Vantor will be providing advanced intelligence and targeting capabilities for contested electronic warfare environments.
The delivery integrates part of Vantor’s Raptor, a vision-based software suite that enables autonomous systems to navigate, orient and extract accurate ground coordinates without relying on GNSS, with the GXP software ecosystem, ensuring intelligence continuity when sensors are degraded.
In modern conflict zones, the proliferation of inexpensive unmanned aerial systems (UAS) with equally low-quality sensors, in addition to widespread GPS spoofing and jamming, have rendered traditional drone video collection unreliable. Significant metadata drift in tactical video feeds leads to “targeting paralysis”: high-quality imagery is available, but the underlying geographic coordinates are too inaccurate for precision activities.
To solve this, Raptor Sync georegisters the full-motion video feed from the drone’s on-board camera with Vantor’s 3D terrain data in real time, enabling downstream GXP intelligence fusion, multi-domain interoperability across different sensors, and accurate ground coordinate extraction at a demonstrated absolute accuracy of <3 m. The system enables previously impossible intelligence and targeting workflows.
“In contested environments, the sensor’s imagery and video collections are only half the battle; the accuracy of the data it produces is what determines mission success,” said Kurt de Venecia, senior director of Product Development at BAE Systems GXP. “By including Raptor directly into our GXP intelligence workflows, we are providing analysts with the ability to maintain absolute targeting confidence, even when the platform’s systems or inertial sensors lack high absolute accuracy.”
Injecting corrected key-length-value (KLV) metadata from Raptor directly into the drone’s video stream at the edge enhances accuracy prior to exploitation in GXP software. This overrides inaccurate telemetry, enabling analysts using GXP solutions to extract weapon-quality coordinates and execute intelligence and targeting missions in real time.
“Analysts cannot afford to lose confidence in where a target actually is,” said Paul Millhouse, senior director ofRaptor Products at Vantor. “By using Raptor to correct video before it enters the GXP Ecosystem, we’re enhancing the performance of existing and new drone fleets. The result is a more resilient workflow for extracting accurate ground coordinates and maintaining operational tempo.”
These capabilities will be highlighted at GXP360° Professional Exchange & Workshop in San Diego, California (May 18-20).
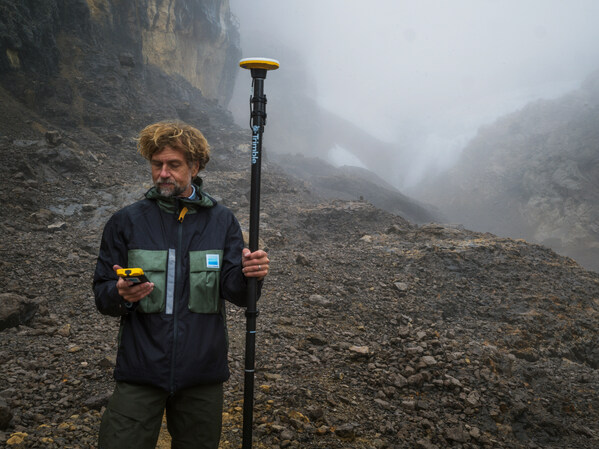
Data provides baseline measurement for tracking change at one of Earth’s last tropical ice fields in Puncak Jaya, Papua, Indonesia.
Trimble is supporting Project Pressure by providing advanced GNSS positioning technology and research funding for the nonprofit organization’s latest expedition to map the disappearing tropical glaciers of Puncak Jaya in Papua, Indonesia.
Project Pressure has released a centimeter-accurate, 3D model of the receding ice, created using Trimble positioning technology and drone-based photogrammetry. The model establishes a scientific baseline for calculating the rate of glacier recession and projecting the timeline of disappearance.
Puncak Jaya, the highest peak in Oceania and one of the Seven Summits, is expected to be the first of the seven continental peaks to lose its glaciers as global temperatures rise.
Puncak Jaya has the only snow in Indonesia. (Credit: Enda Kaban, CC BY-SA 4.0)
Local communities use the data to make informed choices about crop selection and prepare for expected water shortages caused by the loss of vital reservoirs.
This expedition marks the third successful outing in Project Pressure’s “Melting Topics”series, which focuses on mapping equatorial glaciers. Trimble provides its GNSS mapping technology and research funding from the Trimble Foundation Fund to support Project Pressure in gathering critical data in some of the world’s most remote and hostile environments.
“Mapping these glaciers before they disappear is of critical importance to establish a baseline to track the glacial regression and for the local communities to understand what is happening with their water source, allowing them to adapt to a changing climate,” said Eliot Jones, senior manager, strategy and partner development at Trimble. “Through a combination of precision technology, detailed project planning and rigorous science, the models created by Project Pressure are shared for scientific study and provide a visual reference for future generations.”
Precision under pressure in hostile terrain
Mapping glaciers at altitudes exceeding 4,800 meters (15,000 feet) presents extreme logistical and environmental challenges. Near-constant cloud cover and heavy rainfall in Papua often render satellite imagery unusable, making ground-based georeferencing essential.
The expedition team installed precise geolocation reference points directly on the glacial surface at multiple locations. Using the Trimble Catalyst DA2 GNSS system and Trimble TDC600 handheld, researchers captured the exact coordinates of those points with centimeter-level accuracy. Drone imagery was then processed against the Trimble coordinates to produce a scientifically reliable 3D model of the glacier.
“Trimble makes incredibly complex technology feel simple in the field,” said Klaus Thymann, scientist and lead explorer. “When you’re standing on a glacier in freezing conditions, wearing thick gloves and surrounded by clouds, you don’t have time to fight with equipment. With Trimble, I can capture centimeter-accurate readings and the interface is so intuitive that even someone with no prior training can help collect data. That kind of reliability and simplicity is critical when you’re working in some of the most remote and challenging environments in the world.”
This approach builds on methods developed during Project Pressure’s 2024 expedition to the Rwenzori Mountains in Uganda, which also used Trimble technology.
The lightweight Trimble Catalyst DA2 GNSS system was critical for the expedition, which required helicopter access to Basecamp, followed by a trek to the launch point.
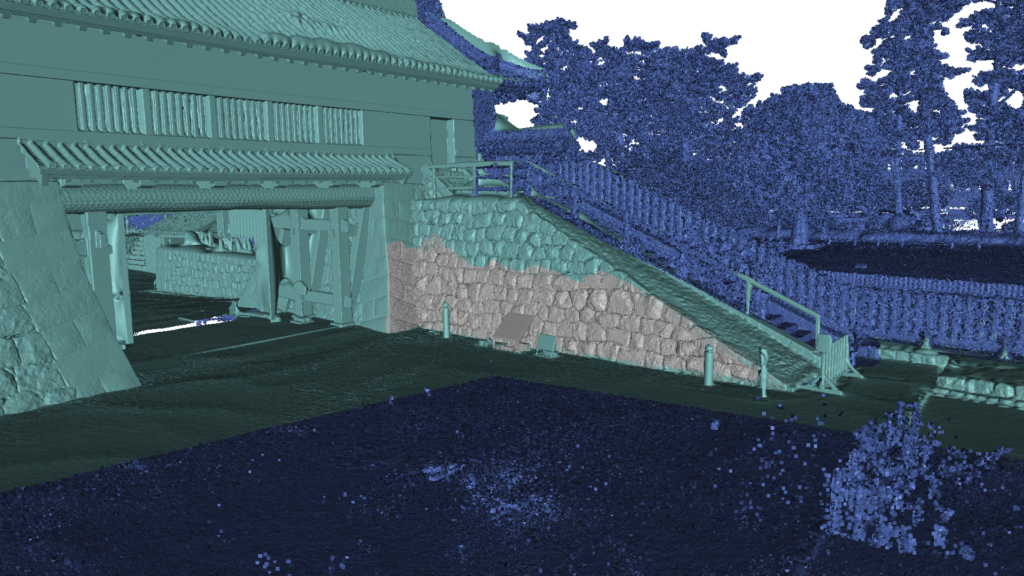
Using Artec Jet, Artec Ray II and Artec Leo, 3D scanning experts have digitized Japan’s historic Odawara Castle for heritage preservation and potential future restoration projects
Challenge: Capturing a massive heritage site, including every detail from courtyards and buildings down to a drawbridge and individual rivets on castle gates.
Solution: Artec Jet, Artec Ray II, Artec Leo, Artec Twins
Result: A single, interconnected point cloud covering the entire facility — scanned mostly with Artec Jet, but with areas of interest captured more accurately using Artec Ray II & Leo. The resulting high-density dataset can be explored in 3D, making it suitable for virtual museum tours, or continuous monitoring to ensure Japan’s famed Odawara Castle stands the test of time.
Why Artec 3D? The highly maneuverable Artec Jet can be attached to a backpack and simply walked through an environment. Entire scenes can be captured from ground level in minutes, including tall structures from a range of up to 300 meters. Artec Ray II and Leo deliver higher accuracy for applications like long-term monitoring, damage assessment, and restoration.
Odawara Castle: A gateway into Japan’s past
Odawara Castle was built more than 500 years ago, with fortifications first erected during the Kamakura period — a time famous for the emergence of the Samurai and Japan’s first Shogun.
The site’s illustrious walls are steeped in history. Situated on a hill and surrounded by a moat, the castle has strong fortifications, so it was coveted and fought over for generations. Three sieges of Odawara took place from 1561-90 and the structure changed hands (and shape) multiple times over the next century as different leaders left their stamp on the property.
At times, the legacy of Odawara Castle has been difficult to protect. The entire site was shaken to its foundations by multiple earthquakes from 1703-1853 and the Meiji government of the late 19th century ordered that all feudal structures be destroyed, so it was mostly torn down.
In 1938, what remained of Odawara Castle was made a heritage site and slowly rebuilt. But over the years, it has remained a delicate piece of history in need of ongoing renovation. With this in mind, the Artec 3D support team — in Japan for a recent trade mission — opted to digitize the entire structure for future generations to enjoy using Artec Jet, Artec Ray II and Artec Leo.
Artec Jet (dark blue), Artec Ray II (light blue), and Artec Leo (grey) point-cloud data fused together for high detail on every scale. (Credit: Artec 3D).
Capturing an entire castle in minutes
When they arrived at the castle, engineers immediately understood the scale of the challenge they were embarking on. Once one of medieval Japan’s largest fortifications, the site’s outer defensive perimeter is a whopping nine kilometers long. Odawara Castle is also a national landmark that’s open to visitors, so they didn’t have the facility all to themselves either.
This meant that speed and subtlety were critical. It would’ve been entirely possible to capture the site with a lidar, tripod-mounted Ray II, by positioning it around different areas of the fort. But this would take a prohibitive amount of time — especially when you consider that double scans are required to remove moving objects. Using Artec Jet was a lot more straightforward.
Attaching the device to a backpack meant the castle could be scanned on foot. Walking the site, almost as if they were a tourist, was enough to capture the entire scene. Artec Jet’s remote app gave real-time feedback on scan progress, so the team didn’t leave any detail uncaptured — and compared to capture with shorter-range scanners, the time savings were enormous.
“Artec Jet scans in a linear fashion. If it takes you two minutes to walk, it’ll take two minutes to scan — the complexity of the scene has little bearing,” explains Artec 3D scanning expert Keynan Tenenboim. “In the same time it took for Leo to scan 2-3 walls, Ray II scanned a building, and Jet digitized an entire castle. Adding in Ray II & Leo was great for areas with accessibility issues — and capturing higher detail around the walls, gate, and courtyard.”
A Trio of Scanners for the Task
Natural environments like trees, rivers, and larger connecting spaces often offer valuable site context, but don’t need to be captured with high accuracy. Artec Jet was perfect for picking up this sort of background information, generating a continuous point cloud, and connecting the site’s more interesting features: historic walls, ornate roofs, and courtyards around the castle.
Jet’s 300-meter range meant there was no need for ladders or scaffolding. The inner structure was captured from ground level without other visitors even noticing. Unlike Ray II, which scans from static viewpoints, Jet could also be maneuvered into difficult-to-reach areas. Both scanners are less accurate than Leo — but that’s why it’s best to combine datasets, for peak results.
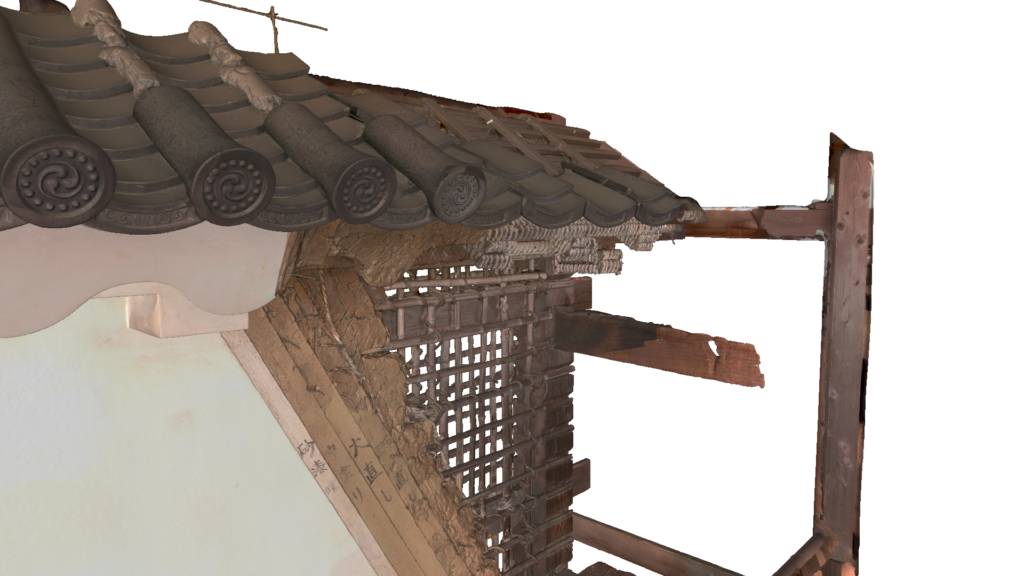
In this case, Ray II was deployed to scan the inner courtyard and gate, with Leo being used to pick up smaller details like the confined area behind the entrance. Handheld 3D scanning was also perfect for capturing a nearby medieval wall. As you can see from the scan below, fine details like tile patterns, lettering, and the wall’s internals were all captured in a single sweep.
“This was the perfect project for demonstrating the benefits of all three scanners,” said Tenenboim. “The main castle wouldn’t be a good fit for Leo and it didn’t really fit Ray II. There was no good vantage point where we could see the facade from 100 meters away. Thanks to Jet’s range, we were able to scan from a ground level. Okay, we could’ve improved roof capture by flying Jet on a drone — but this would require more site preparation.”
Fine details of an exterior wall captured just outside the castle with Artec Leo. (Credit: Artec 3D)
Heritage preservation with end-use potential
Once engineers had finished scanning, they sent data back to Artec’s Luxembourg HQ via cloud sharing for processing in Artec Twins. Specifically designed to handle large datasets, Artec Twins software allows Artec Jet, Ray & Leo scans to be merged — either into a unified point cloud, or a 3D mesh that can be measured and exported to industry platforms like Autodesk Revit.
In terms of applications, the resulting 3D point cloud would be perfect for building a virtual museum tour that allows visitors to virtually explore Odawara Castle. Regular data capture sessions would also allow site operators to monitor conditions over time. If a building’s traditional rooftop began to sag, for example, it’d be possible to carry out rapid repairs.
Deployable in seven modes: by-hand, backpack, pole, cage, robot, vehicle, or drone, Artec Jet adapts to any environment, allowing users to replace complicated multi-tool workflows. Clearly, Artec’s Odawara Castle scan is just the beginning, there are many more sites left to explore.
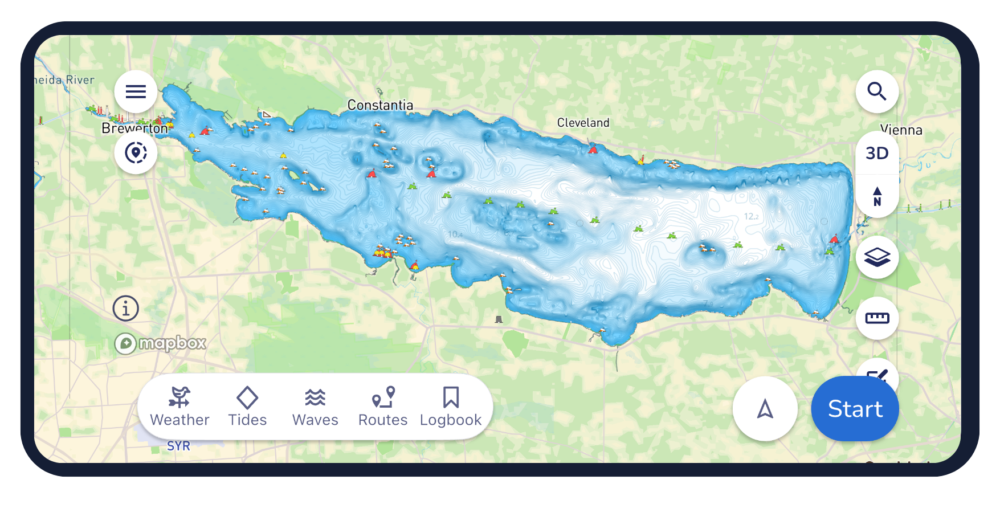
Marine navigation company Savvy Navvy has developed an in-house approach to processing and reconciling fragmented hydrographic data — combining official hydrographic data with expert geospatial data analysis to scale chart coverage faster and with greater accuracy.
The latest rollout adds more than 2,200 U.S. lakes and extends coverage into Estonia, Lithuania and Latvia in Europe, opening more waterways for boaters across the globe to explore. This comes not long after Danish charts from hydrographic offices were also added to the navigation app.
Prioritized by where boaters are most active, the latest update includes all major Minnesota lakes and expands lake coverage in 20 other U.S. states.
Elena Petru. (Credit: Savvy Navvy)
“Land mapping across much of the developed world, has benefited from sustained investment over several decades. Hydrographic data, the mapping of water, has a different history,” explained Elena Petru, geospatial data engineer at Savvy Navvy. “Survey cycles are longer, coverage is uneven, and for inland waters like lakes and reservoirs the situation is patchier still.
“Multiple authorities may hold overlapping or conflicting data for the same body of water, formats vary, and there is no single canonical source that can simply be downloaded and trusted. This fragmentation is exactly the challenge our geospatial team is solving through a structured reconciliation process.”
Petru joined Savvy Navvy in 2023, bringing her geomatics background from land data roles into the specific challenges of marine and inland water charting. Her expertise has enabled development of new data pipelines to overcome these marine charting challenges — marking a significant step in Savvy Navvy’s ongoing chart development program being based on unique, comprehensive data.
“You’d be surprised how often official sources do not fully line up. One of the main challenges is that the same lake can be represented slightly differently depending on the dataset. The task was not to pick one and apply it, but to compare sources carefully, understand where they differed, and make informed decisions about how each lake should be represented,” Petru said. “By going beyond official sources with our own expert validation process, we can integrate new regions faster while maintaining high data integrity, which overcomes one of the biggest difficulties in marine navigation. It’s exciting to see this data go live in the Savvy Navvy app knowing boaters can now use it on the water every day.
This approach forms part of Savvy Navvy’s broader data processing pipeline, enabling consistent, repeatable expansion into new regions. Through these data pipelines we can now deliver faster, more expansive chart coverage including waters not yet fully covered by official hydrographic surveys.
Savvy Navvy has been downloaded more than three million times globally. Unlike other boating navigation solutions, Savvy Navvy provides smart routing, giving users optimal routes and dynamic ETAs based on real-time data: departure time, chart information, weather conditions, tide, boat specifications and local regulations. The updated chart coverage is available across both the Savvy Navvy app and its integrated solutions.
Last month Savvy Navvy launched its new waves feature, turning complex wave data into a simple visual view that helps boaters understand how conditions will actually feel on the water. Worldwide chart coverage is available on all Savvy Navvy plans.