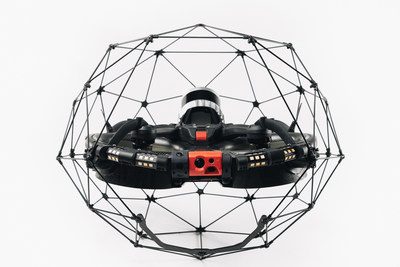
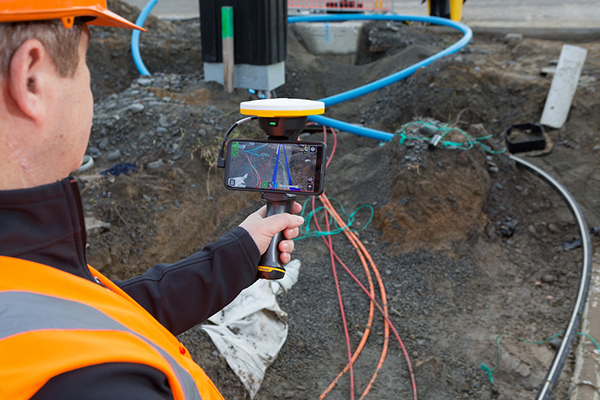
Flyability has unveiled the Elios 3, a collision-tolerant drone equipped with a lidar sensor for indoor 3D mapping. The drone is powered by a new SLAM engine called FlyAware that lets it create 3D models as it flies.
It also is accompanied by a new version of Flyability’s software for inspectors, Inspector 4.0.
The launch of the Elios 3 marks a new partnership with GeoSLAM. The Elios 3 comes with an Ouster OS0-32 lidar sensor, allowing inspectors to collect data for the creation of survey-grade 3D models using software from GeoSLAM.
The drone gives users real-time digital replicas of previously inaccessible areas with the inclusion of the lidar sensor and GeoSLAM’s Connect software. The drone is protected by a cage and has advanced collision-tolerance features that allow inspectors to fly it inside dangerous confined spaces such as boilers, pressure vessels and mines.
With its integration with Connect, the Elios 3 creates survey-grade point clouds. Fitted to the back of the drone, the lidar sensor maps the environment in real time using Flyability’s FlyAware SLAM algorithm.
Survey package option
Those that need highly accurate data can upgrade to the survey package, provided by GeoSLAM, providing access to the Connect software, as well as specialist Volumes and Draw modules. Powered by GeoSLAM’s established SLAM algorithm, Connect offers a simple and automated way to process point cloud data.
Using the survey package, data is processed to an accuracy of 8 mm, suitable for mapping hazardous environments such as mines and industrial applications including chimneys, production plants, warehouses, silos and tanks. Processed data can then be viewed in the easy-to-use 3D viewer and exported to industry-standard file types including LAZ, LAS, PLY and TXT for use in third-party software.
On a project on the Butterfield Landfill — about 45 miles south of Phoenix, Arizona — Buesing Corp. needed to excavate and haul 1,850,000 cubic yards of dirt from a landfill more than 60 feet deep while grading the slope, basin and stockpile; inserting storm drains; and making an operations layer.
Buesing, founded in 1965, specializes in modeling and building complex underground systems in challenging conditions. It had four months to complete the initial mass grading, with another month for shaping the stockpile and a final month for the operations layer and piping. The mass grading of the site required an accuracy of plus or minus one tenth of a foot in a landfill with 4:1 slopes and a slope length of 300 linear feet, and the operations layer had to be two feet thick. The project also required installing storm drain inlets, flow lines, and outlets to grade.
To remain on schedule, the project required moving large quantities of soil quickly and efficiently, as well as adjusting grading models to incorporate design updates and changes while in production. “We used DTMs and orthophotos collected with our UAV to track progress quantities and adjust the stockpile model to minimize haul distances and slope rework as well as maintain proper drainage and control of stormwater,” said Rio Byman, Buesing’s GPS manager, who is responsible for building 3D models and managing the maintenance, calibration and updates for the company’s machine control (MC) solutions.
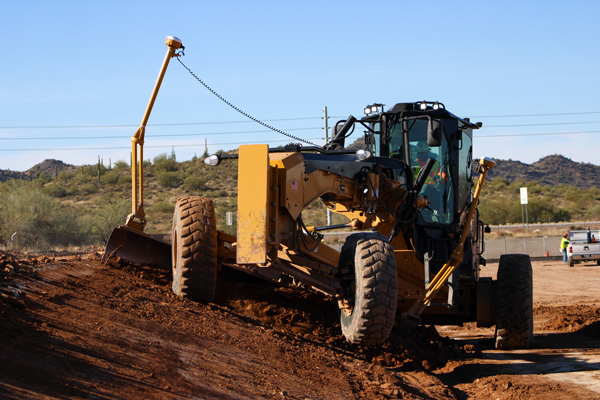
A caterpillar CAT14M3 motorgrader is guided by Trimble’s dual-mast Earthworks system. (Photo: Trimble)
For this project, the company used heavy equipment both with and without MC, including blades, excavators and dozers with MC, along with GNSS-based grade checkers to control the earthmoving operations. Specifically, Buesing, which started converting its equipment to Trimble around 2018, used the Trimble Earthworks Grade Control Platform and the Trimble GCS900 Grade Control System on the site and Trimble Business Center at its office.
Buesing works in a variety of market segments for public and private entities in seven states, though it performs most of its work in the Phoenix metropolitan area. Key to its success has been an emphasis on skilled crews, continuous training and technology. In fact, Buesing was one of the early adopters of machine control in 2006. “A decade ago, the technology was pretty rudimentary, which limited adoption,” Byman said. “That’s changed a lot in recent years, particularly in the ease of use and flexibility. Today, grade control is an integral part of the company’s ability to build ever-more-complex solutions in even more challenging site and soil conditions.”
The company started with the Trimble GCS900 on single-mast and dual-mast blades, excavators and dozers. It has since moved to the Trimble Earthworks Grade Control Platform along with Trimble Business Center for managing 3D models. Working closely with SITECH Southwest, Buesing has gone from six machines with grade control to more than 20 in just five years. The company relies on grade-control solutions on its excavators, dozers, motor graders and scrapers, and has used them on projects of every scope and scale, though their value is most evident on urban high-rise excavation.
“It takes time for operators to gain faith in the data, and know that the machine will excavate efficiently and accurately, whether building pads or cutting basements,” Byman said. He believes that improved productivity in the field comes with trust in the technology.
Using Trimble Earthworks’ Autos mode, the software controls the implements while the operator controls the machine’s direction and speed for consistent, high-accuracy finished grade in much less time than it would take without automation. “On any jobsite, the operators have to be aware of everything around them, as well as what’s going on with the blades or scrapers,” Byman said.
“With Autos, they’re able to focus on what’s going on around the job and plan for watering and other environmental conditions with confidence that the machine is digging to grade. This makes our jobsites more productive, safer and more efficient. We have happier operators who are excited to come to work with newer equipment.”
Team Provides Accurate 3D Maps for Smart City Applications
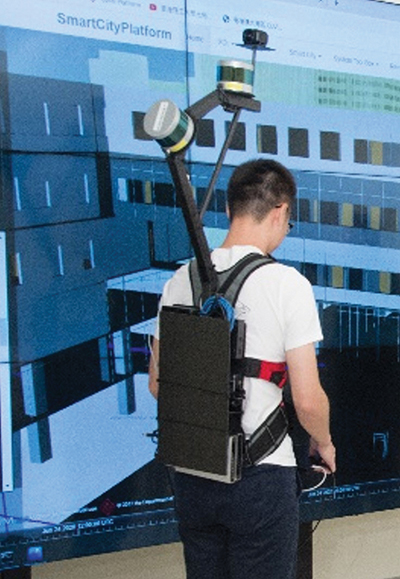
The PolyU team’s mobile mapping backpack. (Image: The Hong Kong Polytechnic University)
According to 2019 statistics, more than 10,000 residential buildings in Hong Kong are at least 50 years old. Most of these buildings lack 3D indoor building information models (BIM), which creates challenges when it comes to reconstruction or maintenance.
In response, a team at Hong Kong Polytechnic University (PolyU) has developed a lightweight and reliable 3D mobile mapping system in a backpack. The system can easily measure cities and obtain 3D maps with centimeter-level accuracy. It can be used to build spatial data infrastructure, which supports smart city applications in many fields.
The system uses advanced technologies such as simultaneous localization and mapping (SLAM), useful in urban canyons where GNSS signals can be spotty. It can carry out continuous data collection in complex indoor and outdoor environments, and is particularly suitable for high-density and complex urban environments, such as those in Hong Kong.
The mapper is providing a special boon to modular integrated construction (MIC) in the city. With MIC, free-standing integrated modules are prefabricated and then transported to the site for installation in a building. However, the trucks hauling the large components can’t always maneuver through narrow streets in Hong Kong’s urban areas.
One of many narrow streets mapped in downtown Hong Kong. (Image: The Hong Kong Polytechnic University
To address the issue, the PolyU team collaborated with the Hong Kong Construction Industry Council, providing its mobile-mapping backpack to conduct 3D measurement of critical road sections. The project identified and mapped obstacles, and optimized the route for transporting oversized components to avoid narrow passages.
Mobile-mapping backpacks also can be used to create detailed indoor 3D models to support firefighting and provide evacuation routes for personnel at the fire scene.
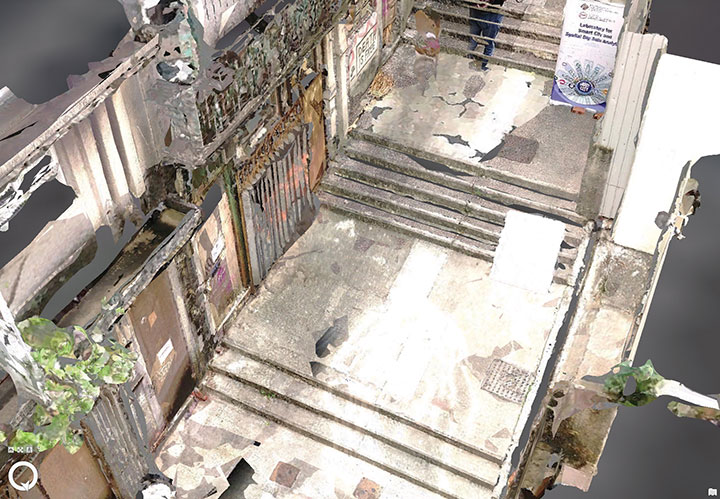
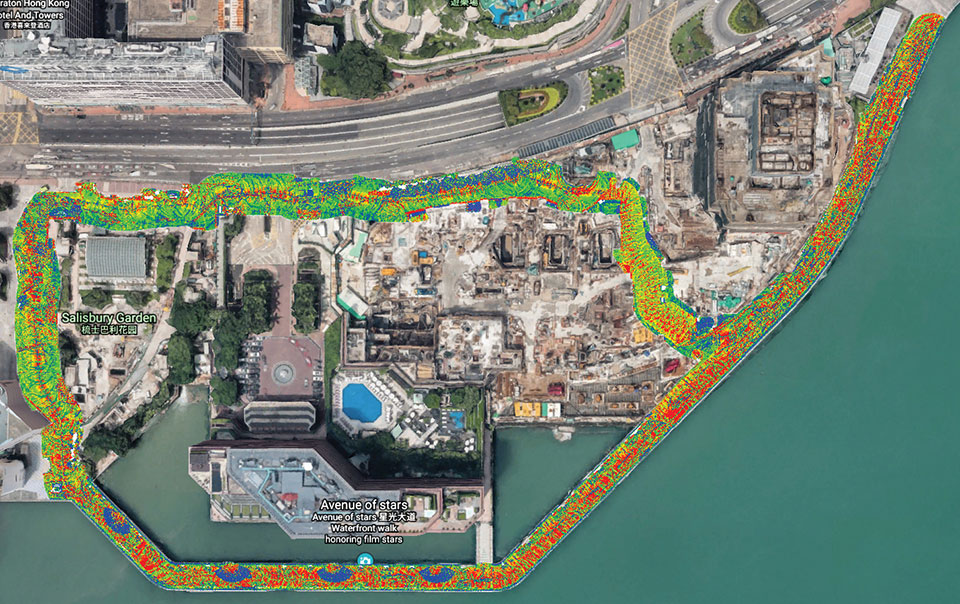
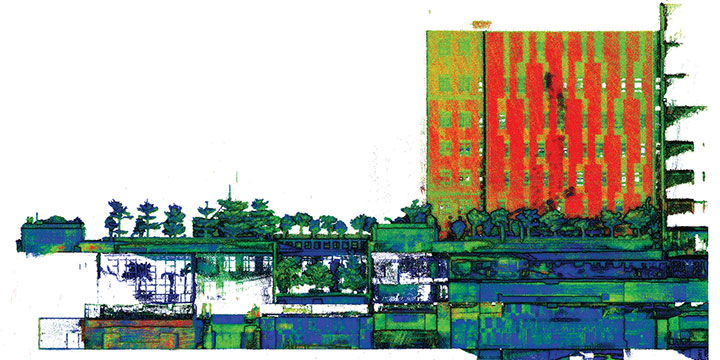
The route taken by the mobile mapping backpack carrier in the harbor area. (Image: The Hong Kong Polytechnic University)A sample point cloud from the mobile mapper. (Image: The Hong Kong Polytechnic University)
The mobile mapper is one of the technologies developed by PolyU’s Smart Cities Research Institute, established in 2020 to help address social issues and provide solutions for smart city development. In March, the institute’s projects received a gold medal at 2021 Inventions Geneva Evaluation Days.
Dutch company NEO B.V. is using SimActive’s Correlator3D software to assess solar potential in multiple cities. (Image: SimActive)
SimActive’s Correlator3D software is being used by by Dutch company NEO B.V. to assess solar potential in multiple cities. Digital surface models (DSMs) are generated from WorldView and GeoEye satellite stereo images and serve to calculate solar panel capacity.
According to SimActive, DSMs covering hundreds of square kilometres are quickly generated by the software. Key metrics to estimate solar potential are then derived, including roof orientation, pitch and shaded areas.
“We have been impressed by the quality of SimActive’s DSMs, especially considering the limited spatial resolution of the imagery”, said Rob Beck, managing director at NEO B.V. “Another definite advantage of Correlator3D is the simplicity of the workflow, making it easy to use by our team.”
SimActive’s Correlator3D software is a patented, end-to-end photogrammetry solution for the generation of high-quality geospatial data from satellite and aerial imagery, including UAVs. Correlator3D performs aerial triangulation and produces dense digital surface models, digital terrain models, point clouds, orthomosaics, 3D models and vectorized 3D features.
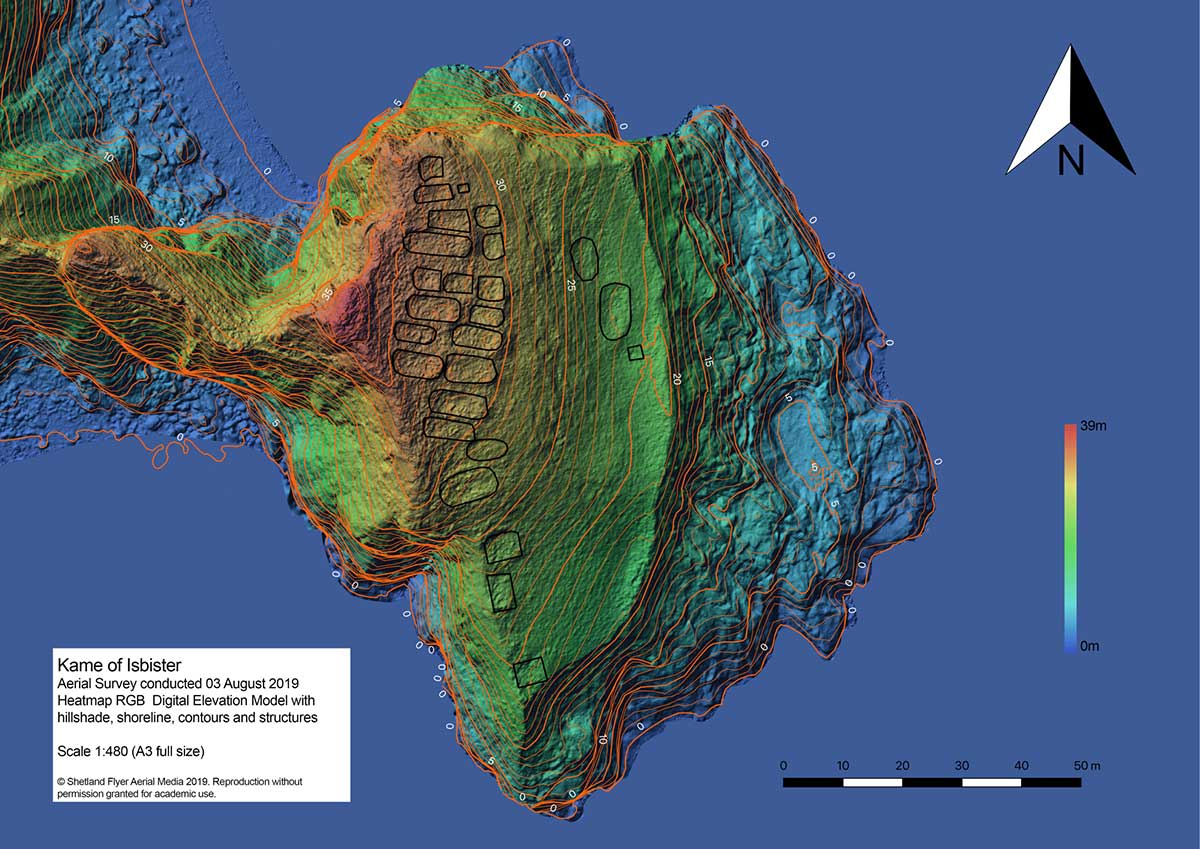
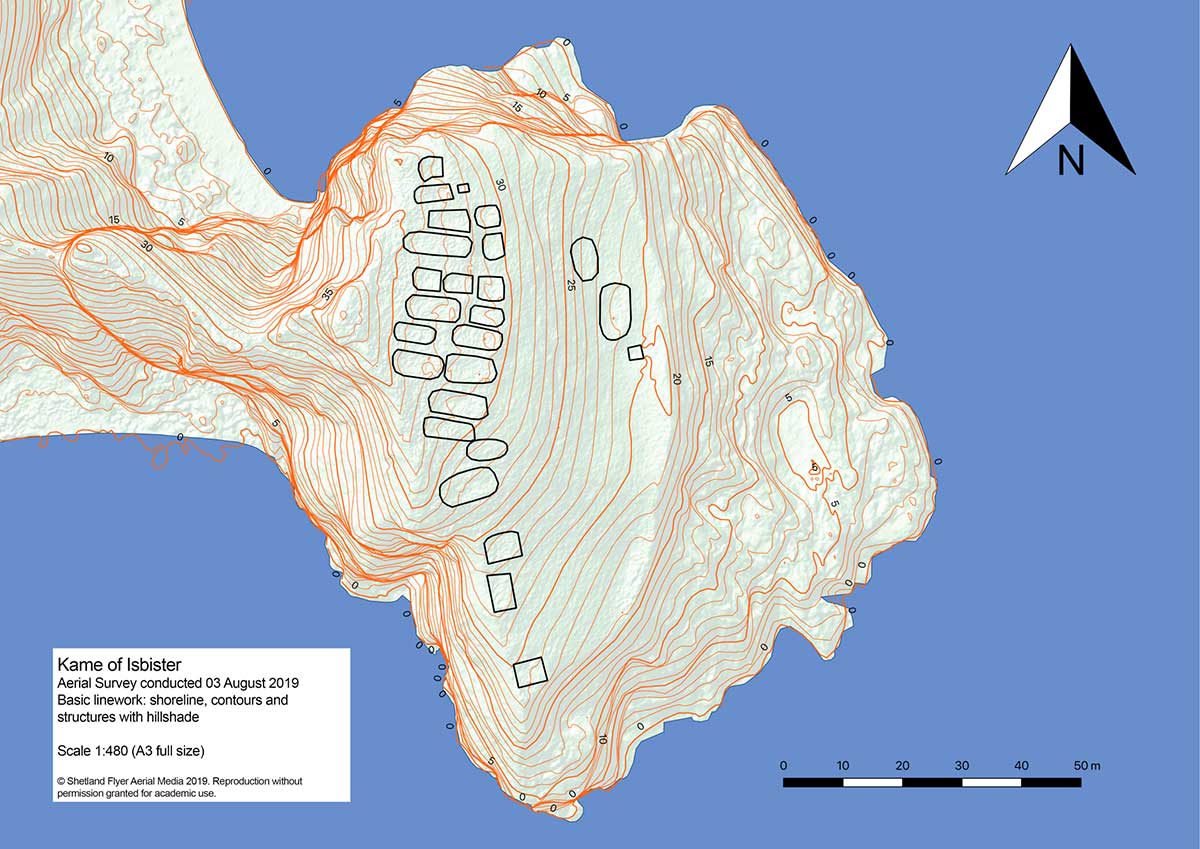
The mysterious and fascinating Kame of Isbister is situated in Shetland’s north mainland near the North Roe. The location has been studied several times, including by the Extreme Archaeology TV series in 2003. The uninhabited grassland continues to attract explorers because of a series of secret structures.
Those structures are hidden on the sea-faced slope and can’t be seen from the land nearby. One theory posits that it’s an eremitical monastery settlement. The late Pictish/early Medieval site is hard to access — and that’s where drones coupled with GNSS receivers helped explorers.
Because the site is hard to access, the team decided to use the DJI Phantom 4 RTK SUA (drone and base) with two flights. One flight captured both the Kame and a piece of the mainland for context, with a ground sample distance (GSD) of 2.4 centimeters/pixel (cm/px). The second flight was on a shorter GSD of 1.9 cm/px to capture detailed pictures of the cape and structures.
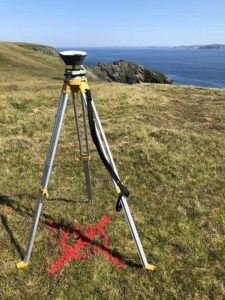
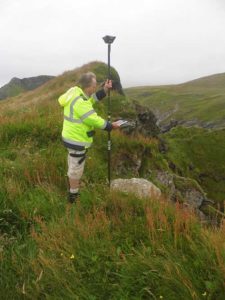
Before the survey, the team used the Emlid Reach RS+ real-time kinematic (RTK) receiver to identify and establish the base mark for the drone on the mainland nearby.
Photo: Emlid
The Reach RS+ collects ground control points. (Photo: Emlid)
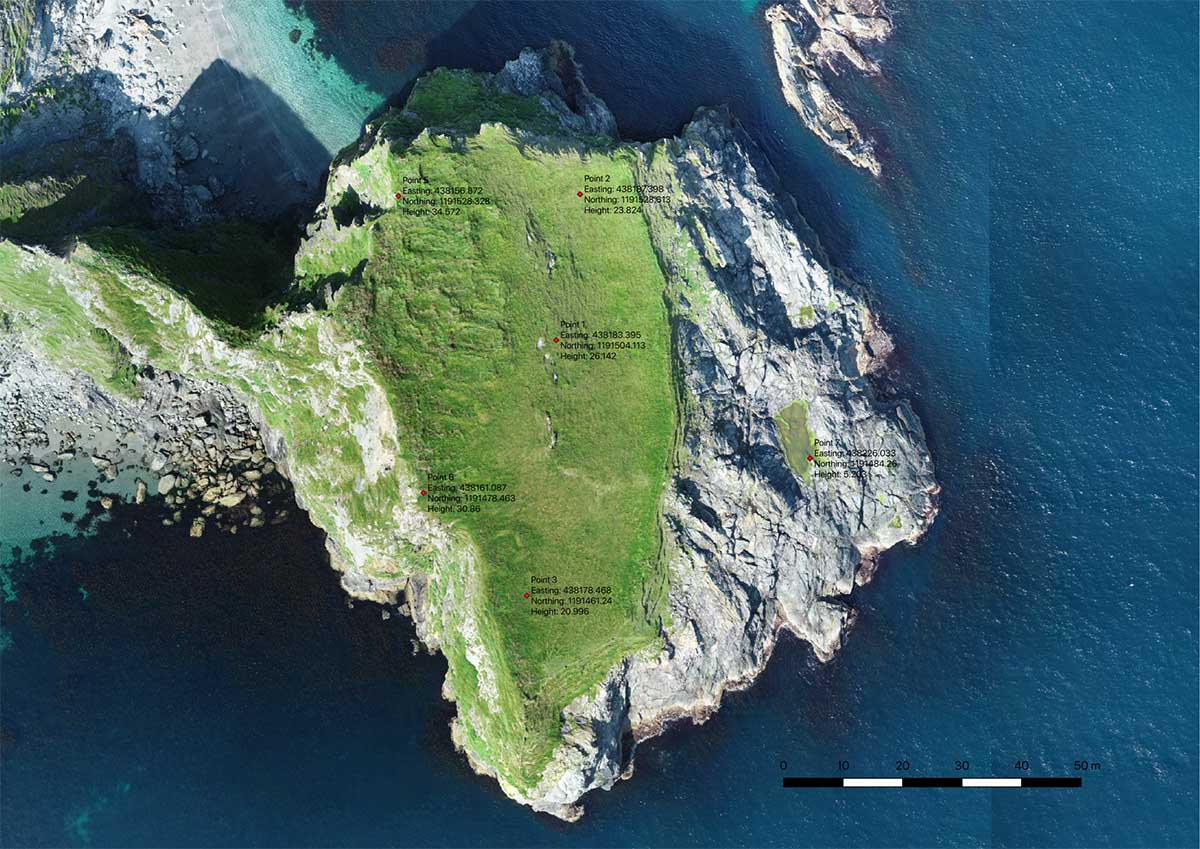
Ground control point locations. (Image: Emlid)
The base mark was then post-processed using data from the OS Net reference station in Lerwick. Considering the long baseline (52 kilometers), it took the team four hours to observe the mark with Reach RS+. Later, when the archaeologists managed to climb the headland, the RTK receiver collected several noticeable control points.
Creating the 3D model. During both flights, the drone’s base was sending corrections in RTK mode. In post-processing, horizontal accuracy of the processed map initially was within 10 cm with vertical at 15 cm. After adding the control points gathered with the RTK receiver, the error was reduced to 6.5 cm, significantly increasing the accuracy of the model.
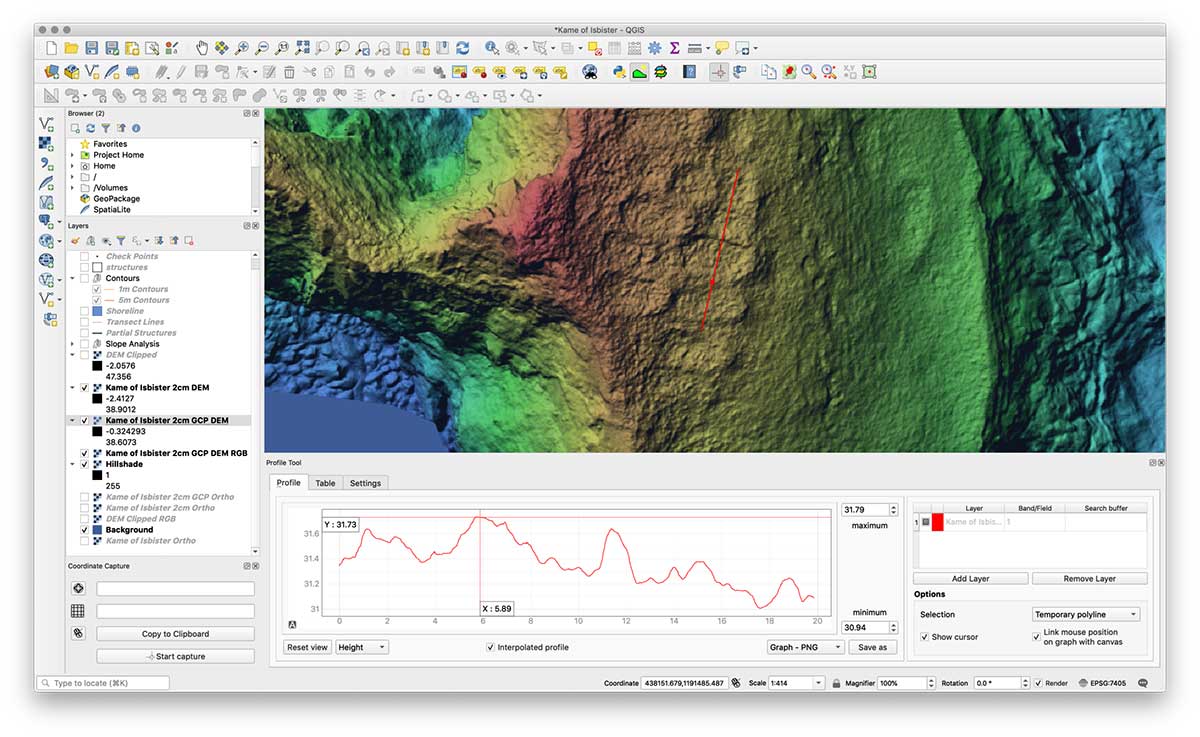
The team performed the GIS processing in QGIS 3.4 LTR.
Screenshot: Emlid
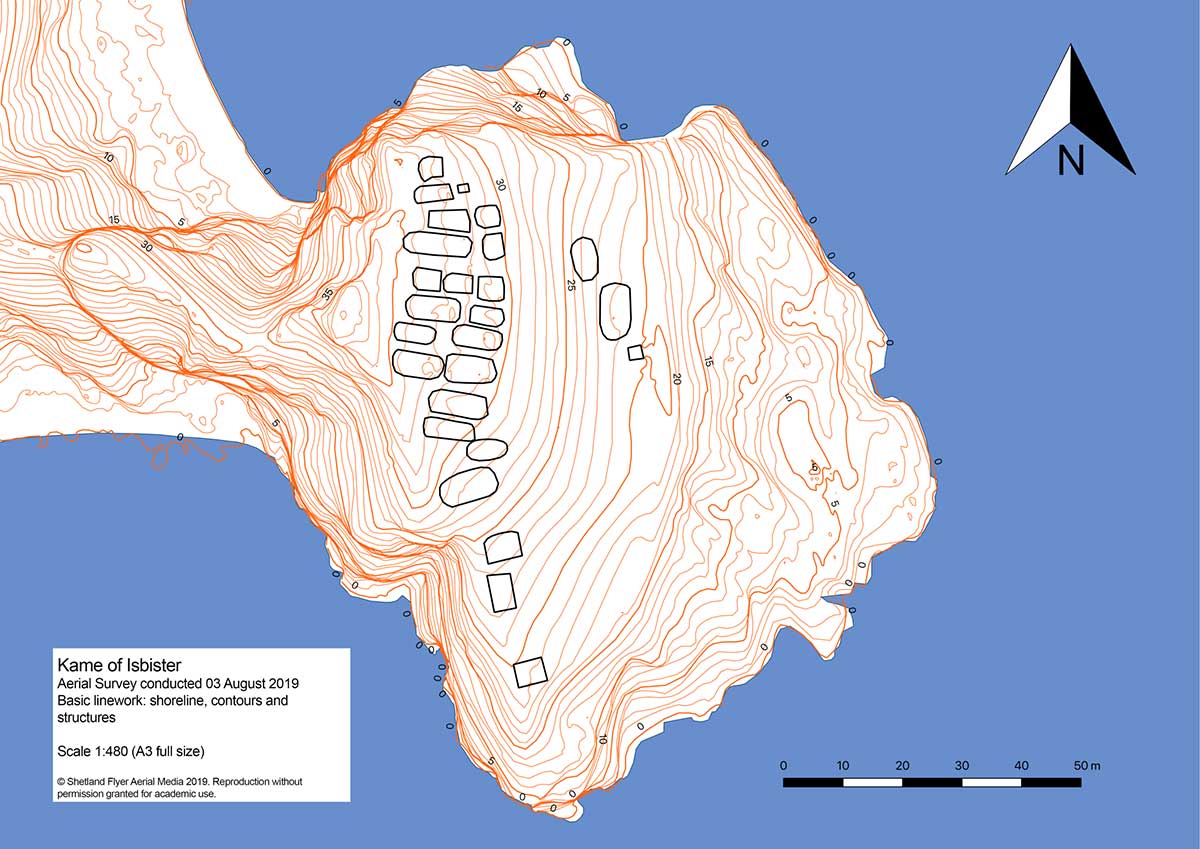
Despite the long grass, they managed to distinguish each structure out of the orthomosaic using the 32-bit floating point raster digital elevation model (DEM). The team created a basic map with structures and contours, a hillshade version and a heat map.
With proper preparation and setup, a GNSS RTK receiver with a drone can gather enough high-accuracy data to create accurate models and maps of an archaeological site — even if it’s hard to reach.
Shoreline contours and structures. (Image: Emlid)Shoreline contours and structures with hillshade. (Image: Emlid)3D model: The heatmap of the Kame of Isbister shows elevations and the archaeological site. (Image: Emlid)
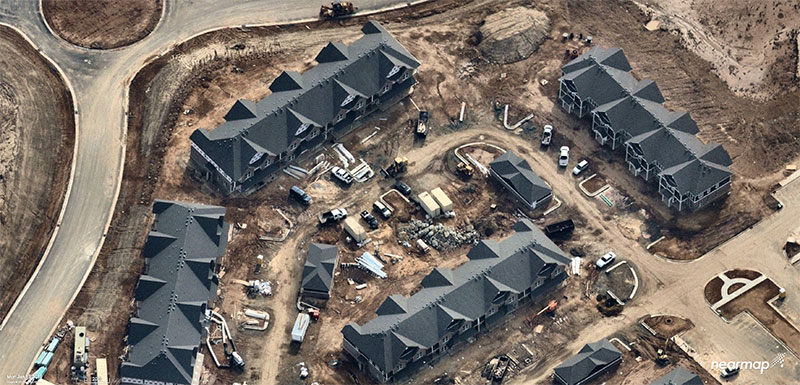
Aerial imagery company Nearmap has acquired technology and assets from Pushpin, a deep learning and analytics technology company that extracts data from 3D models to provide roof geometry insights to a variety of sectors including roofing, solar and government.
The technology acquisition allows Nearmap to rapidly extract and disseminate roof geometry from its wide-scale 3D models and offer a new form of location content to its customers.
‘‘By acquiring Pushpin’s 3D geometry extraction technology and pairing it with our rich data, we bring the best of both worlds together at unprecedented scale’’ said Rob Newman, Nearmap CEO. “Over the past couple of years, we’ve evolved our offering from 2D imagery to a multi-product portfolio, and this acquisition is an important milestone in our approach to continue adding new content types for our customers. This addition aides our company mission by providing 3D geometry data at unmatched speed, thereby changing the way our customers perform their work.”
With this new technology, Nearmap can provide a semi-automated calculation and extracted representation of any roof geometry within an hour, significantly reducing turnaround time. The combination of Nearmap’s 3D content and Pushpin’s geometry extraction technology opens up a diverse range of use cases, enabling businesses to fast-track job estimation, determine solar irradiance, plan drone delivery routes and model 5G propagation.
“The addition of Pushpin’s 3D geometry extraction technology into our large-scale 3D reality models will enable us to further evolve our offering and produce at scale roofing geometry,” said Tom Celinski, Executive Vice President, Technology and Engineering at Nearmap. “With the added ability to provide roof geometry data, we will be able to provide even deeper insights on what’s happening on the ground, and help businesses and government organizations transform the way they work and do their job more efficiently.”
The roofing and solar industries are poised for significant growth. Currently, 1% of the United States population has solar panels on their homes. According to the Solar Energy Industry Association (SEIA), total U.S. solar capacity will more than double over the next 5 years.
Additionally, a significant number of U.S. residential homes have their roofs replaced every year due to roof damaging storms and changes in roofing trends and material. This new product offering from Nearmap is poised to significantly impact these markets, as companies are expanding their use of technology to assist with tasks such as roof material and project quoting through reports, project management through roofing specific software, and customized sales and marketing tools for the roofing industry.
Trimble has introduced its Trimble SiteVision system, an outdoor augmented reality (AR) solution that enables users to visualize 2D and 3D data on virtually any project site with cellular or internet connectivity for easier and more efficient planning, collaboration and reporting.
Combining hardware and software in an integrated, lightweight handheld or pole-mounted solution, users can view 3D models and assets in a real-world environment at a 1:1 scale, from any angle or position.
The system consists of:
Hardware: The Trimble SiteVision integrated positioning system integrates the Trimble Catalyst DA1 antenna, electronic distance measurement (EDM) rangefinder and power management into a lightweight, handheld device that connects to a user-supplied Android mobile phone.
Software Subscription: Available to single users on a monthly or yearly basis. The SiteVision software subscription combines Trimble’s high-accuracy positioning services and cloud-based processing technology to create a centimeter-accurate AR system. The system leverages Trimble cloud-based processing to manage and deliver data and design models.
SiteVision enables users to visualize digital models from a wide range of data collection, design and constructible modeling tools in open industry-standard formats including IFC and LandXML.
For civil projects, SiteVision accurately visualizes data from Trimble’s Quantm, Business Center and Novapoint; design data from Civil 3D and Bentley OpenRoads; and GIS data from Esri ArcGIS software.
Photo: Trimble
SiteVision powers building information modeling (BIM) projects with open data from Trimble’s Constructible BIM solutions including SketchUp and Tekla, and BIM data from Autodesk Revit and AutoCAD software. For utility companies, PLS-CADD power line design, Distribution Design Studio (DDS) and other industry-specific design data is also supported.
Using Trimble Connect cloud-based hosting, SiteVision can access models from all stages of the lifecycle of infrastructure and buildings—from initial concepts of roads or buildings through the operations and maintenance phase of the assets—to increase collaboration, enhance work accuracy and ultimately improve operations and utilization.
SiteVision simplifies complex concepts by allowing users to blend digital content with real-world environments. For example, city planners can visualize a new building design in the exact spot it is to be erected, a work crew could identify the exact position of underground cables or pipes before digging, an electric utility can confirm placement of poles and lines with customers and crews, or a construction supervisor could assess the progress of heavy equipment by visualizing actual work performed against the site plan.
“It’s easier to understand complex ideas when we can see them in a real-world context,” said Mark Nichols, general manager at Trimble. “SiteVision improves our understanding of projects and worksites with a handheld device that is accessible to a wide range of users. Augmented reality is now ready for everyday use in a wide range of applications.”
Trimble SiteVision is available to order now through Trimble’s authorized distribution channels for Civil Engineering and Construction, Geospatial and Buildings.
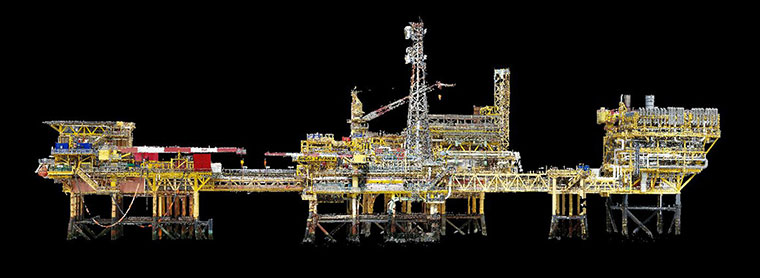
Terra Drone Europe, a group company of Terra Drone Corporation, has completed an aerial 3D survey and produced a 3D model of an offshore oil rig platform in the North Sea for Shell.
According to Terra Drone Europe, the platform complex that was surveyed was positioned several years ago when GNSS survey techniques were neither very advanced nor common. Several coordinates were known and as-build drawings were available, but Shell wanted to know the position of each and every element on the platform to facilitate accurate drill rig positioning.
Terra Drone Europe completed an aerial 3D survey and produced a 3D model of an offshore oil rig platform in the North Sea for Shell. (Photo: Terra Drone)
Thus, the company recruited Terra Drone Europe to capture the as-is conditions through a high-precision oil rig platform survey. According to Terra Drone, the survey was divided into two parts: one part dedicated to creating a 3D point cloud and the second to accurately check the position of the platform using GNSS readings.
Two GNSS receivers were installed at several different locations on each platform and used to log in the raw data which was later processed. When this data was combined with the 3D point cloud created by Terra Drone Europe, the coordinates of each asset on the platform structure were determined.
Terra Drone Corporation recently established new branches focusing on the oil and gas sector in Argentina, Angola, Kazakhstan and the United Arab Emirates. The company also formed a new branch to provide advanced nondestructive testing and inspection services to the oil and gas industry.
CityMapper is a hybrid airborne sensor combining vertical and oblique imagery with 3D laser scanning designed for 3D city modeling and urban mapping.
Using the CityMapper, Bluesky was able to capture parts of London, Manchester and Birmingham as well as Brighton, Bristol, Cambridge, Norwich, Nottingham and Oxford. Bluesky intends to increase its coverage by capturing additional towns and cities across the U.K. and Ireland in 2019.
St. Paul’s Cathedral in London captured in lidar point-cloud data. (Image: Bluesky)
According to Bluesky, this is the first time the technology has been used commercially in the UK to this level. The captured city data is available from Bluesky and Leica Geosystems, part of Hexagon, in its constituent components of vertical orthorectified aerial imagery, oblique photographs and lidar point cloud data. Plans are in place to also include the imagery in the HxGN Content Program.
The combination of multiple survey-grade cameras and lidar enables the simultaneous capture of data for the automatic creation of highly accurate and detailed citywide 3D models, with one sensor, according to Bluesky.
Previous 3D models have either been prohibitively expensive for use across larger areas or of insufficient detail or accuracy. The CityMapper sensor enabled efficient, cost-effective capture of highly detailed and accurate data, and could make possible widespread use of 3D models possible.
The CityMapper sensor is designed for 3D city modeling and urban mapping. (Photo: Leica Geosystems)
CityMapper includes a traditional vertical camera as well as survey-grade oblique cameras. The sensor also includes high-performance lidar technology to accurately collect elevation data even into the shadows, which are common in urban environments and make photo-based data collection difficult.
The CityMapper sensor also collects color infrared data, which can be used to aid greenspace mapping and vegetation studies.
Applications of the new Bluesky 3D models are expected to include urban planning, line-of-sight analysis, new development visualizations and environmental modeling, as well as potentially 3D fly throughs and virtual reality experiences. Early adopters of the data include architects, planning consultants and other map publishers.
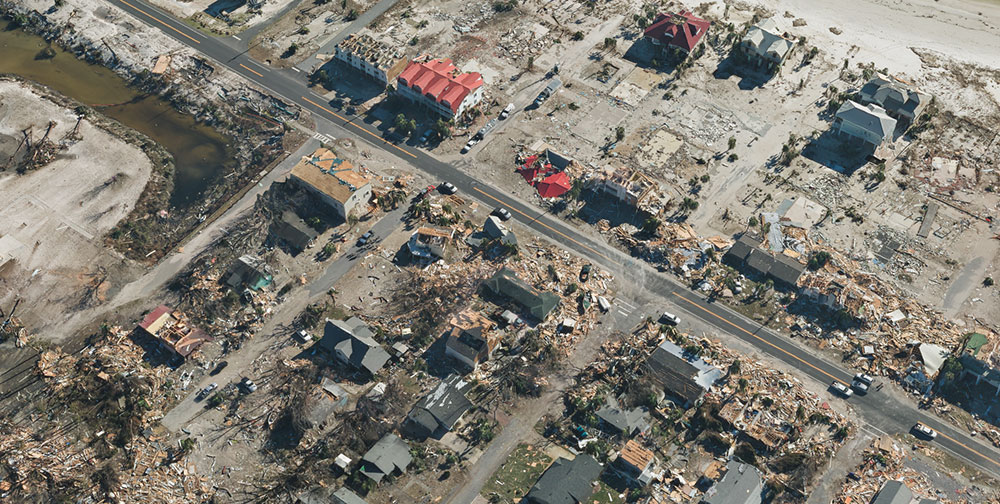
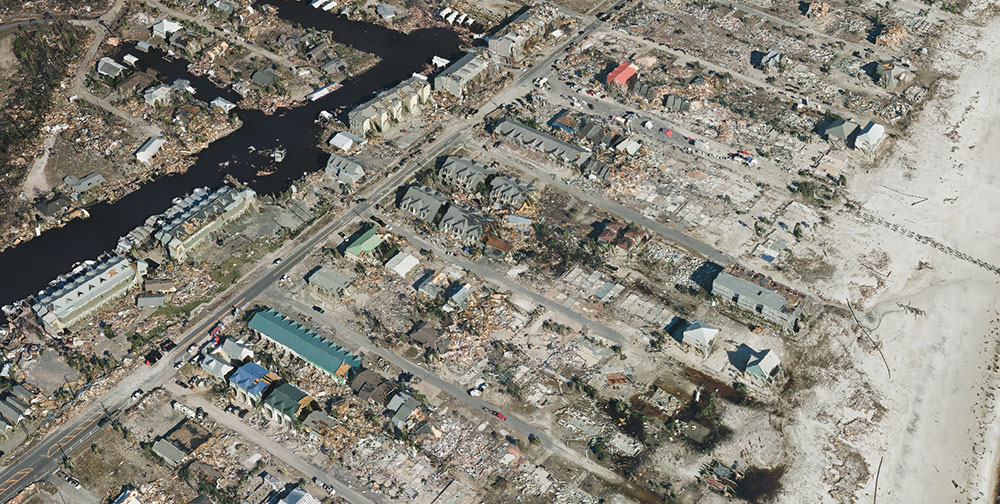
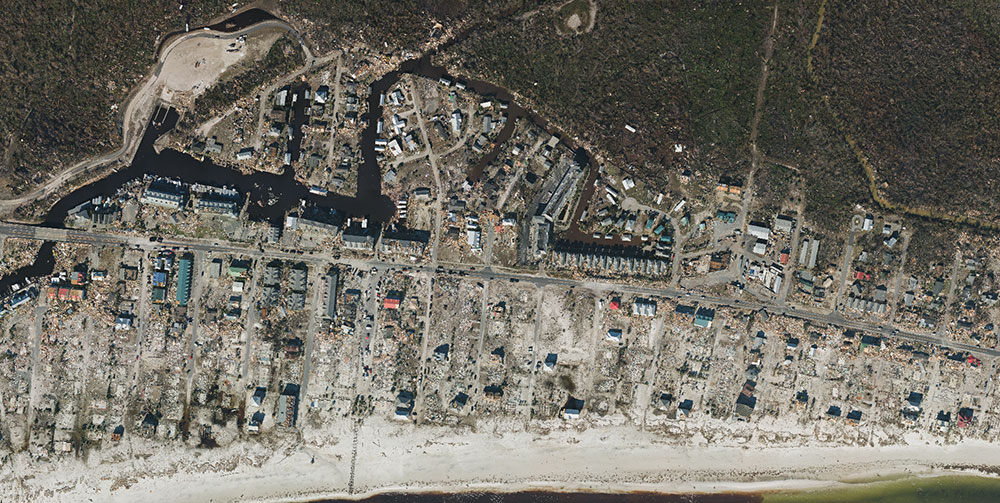
Correlator3D was used to process large format imagery collected by Midwest over Mexico Beach, Florida. (Image: SimActive)
SimActive Inc., developer of photogrammetry software Correlator3D, has partnered with Midwest Aerial to perform damage assessments of Hurricane Michael.
Correlator3D was used to process large format imagery collected by Midwest over Mexico Beach, Florida. The joint effort resulted in highly precise geospatial data, including a digital surface model (DSM), an orthomosaic and a 3D model, the company said.
“This is a terrible disaster for the people affected and we hope they can benefit from geospatial technologies available,” said Philippe Simard, president of SimActive.
The gallery below shows samples of the imagery collected.
SimActive partnered with Midwest Aerial to perform damage assessment of Hurricane Michael. (Photo: SimActive)
Correlator3D was used to process large format imagery collected by Midwest over Mexico Beach, Florida. (Image: SimActive)
Aerial imagery of the devastation from Hurricane Michael in Mexico Beach, Florida. (Image: SimActive)
SimActive’s Correlator3D is a patented end-to-end photogrammetry solution for the generation of high-quality geospatial data from satellite and aerial imagery, including UAVs. Correlator3D performs aerial triangulation and produces dense DSM, digital terrain models, point clouds, orthomosaics, 3D models and vectorized 3D features.
Powered by GPU technology and multi-core CPUs, Correlator3D ensures high processing speed to support rapid production of large datasets, the company added.
Midwest Aerial Photography focuses on acquiring high-quality aerial imagery and companion data in support of photogrammetric mapping projects across the United States and Canada. Midwest partners and clients include federal, state and local government agencies, as well as photogrammetric firms and architectural and engineering companies.
By Tommaso Panicciari, Mohamed Ali Soliman and Grégory Moura
All images provided by the authors
A real-time system combining a simulator and a GNSS propagation model reproduces an authentic multipath environment. The propagation model relies on a 3D-model reconstruction of the urban environment, which generates a multipath signature strictly dependent on the location of the receiver’s antenna. This yields important results for a moving vehicle, which may be affected by very different multipath conditions depending on trajectory and location.
Positioning and navigation can be degraded in urban environments by multipath, and the error can increase considerably if not properly compensated. In situations where the line-of-sight (LOS) is obscured by surrounded buildings, the receiver may still be able to navigate by using the non-line-of-sight (NLOS) signal, which originates from single or multiple reflections/diffractions of the GNSS signal.
The use of 3D models has been one of the preferred solutions to recreate the multipath environment as seen by a GNSS device. This solution brings the capability to generate a multipath signature that is representative of the position of the antenna in a specific time and space. However, this solution comes with a certain degree of complexity. In fact, an accurate 3D model is required to simulate the obscuration of the GNSS signal, and a good propagation model is needed to generate phenomena like reflection and diffraction.
Figure 1. Example of propagated signal simulation. (Image: Tommaso Panicciari, Mohamed Ali Soliman and Grégory Moura))\
3D models have become more accurate and widely available and are mainly used to predict the satellite availability in specific locations, for example in evaluating the signal availability in urban canyon, and for both reflection and diffraction. Other uses of 3D models are as an aiding tool to assist navigation, sometimes together with an INS solution.
In this article, we present a novel real-time system capable of simulating realistic multipath in different environments. The system can simulate multiple GNSS constellations and is comprised of a GNSS simulator interfaced to a propagation model. The system can create a whole range of signals, effects, error models and trajectories in a real-time closed loop. The propagation model controls the simulation of multipath from the interaction of the GNSS signal with the 3D scene and objects. This article describes a novel real-time system for the simulation of realistic multipath in different environments and compares simulated and field-test data. The comparison is based on signal availability, horizontal error, carrier-to-noise (C/N0), pseudorange and Doppler residuals.
RAY-TRACING WITH 3D MODELING
The model simulates the propagation of GNSS signals in constrained environments, considering obscurations and multipath. It uses a proprietary ray-tracing kernel (based on bounding volume hierarchy techniques using processing unit [GPU] resources) coupled with geometrical optics and uniform theory of diffraction to compute the interaction between the signal and the local environment. The computation uses as main input a synthetic environment (that is, geometrical and physical modeling of a real or realistic environment) to assess the impact of obscurations related to signal availability issues and multipath (the cause of fading effects and performance problems).
The objective of ray-tracing is to find all the possible paths from the observer to the source of the signal considering a limited number of interactions per emitted rays. A ray-tracer (or ray-tracing algorithm) uses a primary grid to cast primary rays. Then, it iteratively computes the possible interactions between these rays and the virtual scene (often defined using triangles). If those interactions exist (if they comply with the law of physics) and if the number of interactions to reach the emitter is below the maximum number of interactions set by the user, then a ray (or multipath) is created. This is a deterministic method that can be used to calculate the obscuration due to the local environment (and therefore detect the signal availability) and the geometrical characteristic of the computed path. Combined with physics modeling, path attributes such as received power, delay, Doppler, and phase are also provided.
The main characteristics of ray-tracing techniques to model GNSS propagation are:
All the signals arriving at the receiver can be model-based on the virtual environment.
As it is a deterministic method, the more realistic the environment modeling, the more compliant with reality the results. Moreover, the simulation results are repeatable.
The specular multipath can be displayed in 3D, and the attributes (for example, receiver power, phase, polarization, Doppler, geometry of the ray) are known. For example, this is relevant when the effect and signature of the environment on the propagation signal need to be studied and understood.
Nonetheless, ray-tracing techniques must account for three major difficulties:
They are time-consuming algorithms. Indeed, depending on the complexity of the scene (defined in terms of the number of triangles), a combinatorial problem to find the possible multipaths reaching the receiver makes the ray-tracer very resource-demanding. That is the reason why the most difficult task to achieve during the coding of a real-time ray-tracing algorithm is to develop acceleration techniques to quicken the computation process. Several solutions exist to either improve the intersection determination (for instance, based on spatial hierarchies such as bounding volume hierarchy [BVH] techniques), or to decrease the number of cast rays (often based on adaptive sampling techniques), or even to replace rays with beams or cones. Moreover, it is possible today to use the resources of graphic boards to accelerate the computation. Indeed, as ray-tracing can be coded by a large number of primary functions that can be treated simultaneously, it can be easily ported into GPU.
Their accuracy depends on the resolution of the primary grid. Details and therefore rays may be missed if the 3D scene is made of small details. This issue is called aliasing. Aliasing artefacts are raised for instance in parts of the scene with abrupt changes (such as edges) or in complex areas with lots of constituent objects. Solutions (or antialiasing techniques) exist to overcome this issue such as adaptive or stochastic samplings.
When it is combined with geometrical optics, these algorithms only compute the specular rays. Even if some techniques exist to model the scattering signals, only physical optics can render the global signal with high fidelity.
MULTIPATH SIMULATION SYSTEM
The proposed system can model two of the main propagation issues encountered in urban environments, such as obscuration (which leads to limitations in signal availability) and multipath (which generates interference that causes fading of the signal and positioning errors). To model realistically such a complex phenomenon, the system uses a GPU ray-tracing algorithm combined with geometrical optics and uniform theory of diffractions. The ray-tracing algorithm relies on 3D-model reconstructions of the urban environment. The computed obscuration and multipath effects are then used to generate signal corrections (in terms of power, delay and Doppler variation) to be used in the GNSS simulator, which generates the carrier, code and navigation messages for different GNSS constellations into a single RF output. Some of the advantages of this system is its ability to run in real time, and to visually show all the reflections/diffractions of the GNSS signals that cause multipath interference.
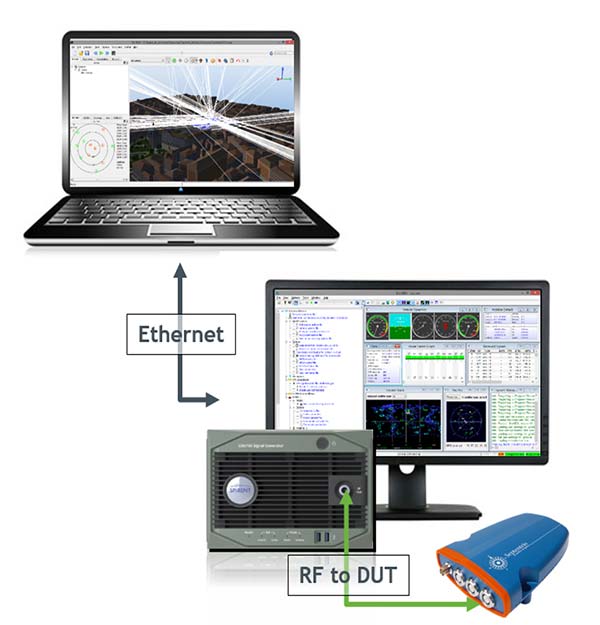
Figure 2 shows the diagram of the system set up in conductive mode. The system includes a SE-NAV PC controller, simulator software suite controller, GNSS simulator and device under test (DUT). A different mode is also available called over the air (OTA). This mode uses an anechoic chamber and a set of antennas distributed uniformly to generate the RF signal including the multipath. The DUT can then be placed at the center of the chamber and will be able to receive LOS and NLOS signals from different angles of arrival.
Figure 2. System diagram that shows propagation simulator controller (top), the GNSS simulator (bottom) and the device under test connected to the RF output of the simulator. (Image: Tommaso Panicciari, Mohamed Ali Soliman and Grégory Moura)
The GNSS simulator software suite is used to generate and control the generation of the satellite signals (including multipath) at RF, whilst the propagation simulator is used to calculate the propagation information (delay, Doppler and attenuation) of the reflected signals through a 3D urban model. The propagation software is interfaced with GNSS simulator software by means of a package of remote-control facilities that greatly enhances the flexibility of the propagation simulator. Those commands can be sent and received through the transmission control protocol/use datagram protocol (TCP/UDP) with different data streaming rates (10 Hz was used for this article).
It is also important to point out that the propagation simulator computes all the possible multipath signal generated by the 3D model given the position of the satellites and receiver. However, the physical limitation of the number of channels in the simulator causes the rejection of some rays. This rejection or filtering process can be done according to power (used in this article) or delay.
EXPERIMENT SET-UP
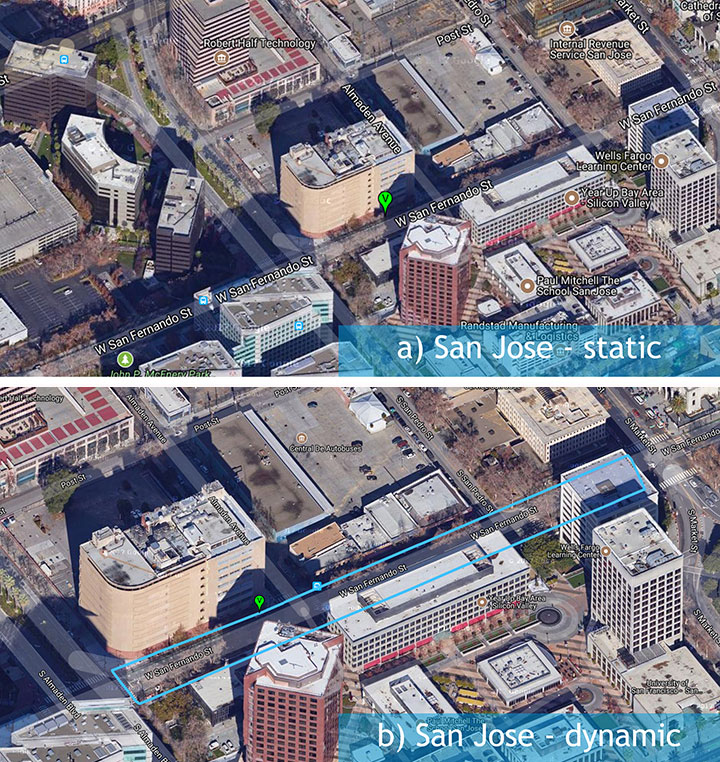
A set of different field-test campaigns where carried out in August 2016. Each campaign aimed to evaluate the ability of the system to assess the performances of a GNSS receiver using simulated signals in urban environments. Figure 3 shows the trajectory (blue line) used for the experiment in an urban environment — San Jose, California — with a static (a) and dynamic (b) scenario.
Figure 3. A set of three measurement campaigns where carried out during Aug. 9–10, 2016: a) urban environment with static antenna; b) urban environment with dynamic antenna. (Image: Tommaso Panicciari, Mohamed Ali Soliman and Grégory Moura)
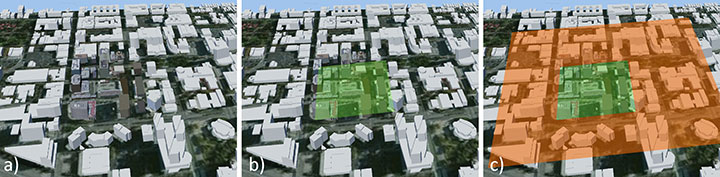
Figure 4 shows the 3D scene used to replicate the San Jose urban environment. The buildings in close proximity of the antenna (green area in Figure 4b) contain details like material, 3D facade and windows. In contrast, the buildings far from the antenna were only corrected for height, and the material was modeled as concrete only.
Figure 4. The San Jose model contained most of the details around the receiver antenna (b), with only height corrected for buildings far from the antenna (c). (Image: Tommaso Panicciari, Mohamed Ali Soliman and Grégory Moura)
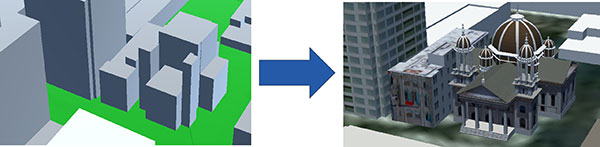
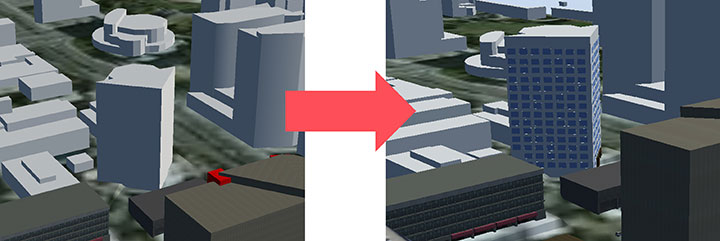
An exception was made for one building in San Jose because its complex architecture was believed to contribute to more reflected rays than would a more simplistic box (concrete) model (Figure 5).
Figure 5. Improvement (right) in one San Jose building because its complex architecture was believed to generate more reflections than the more simplistic box model (left). (Image: Tommaso Panicciari, Mohamed Ali Soliman and Grégory Moura)
EXPERIMENT RESULTS
A direct comparison of C/N0 power, pseudorange residual, and Doppler residual was performed between the field test and simulation.
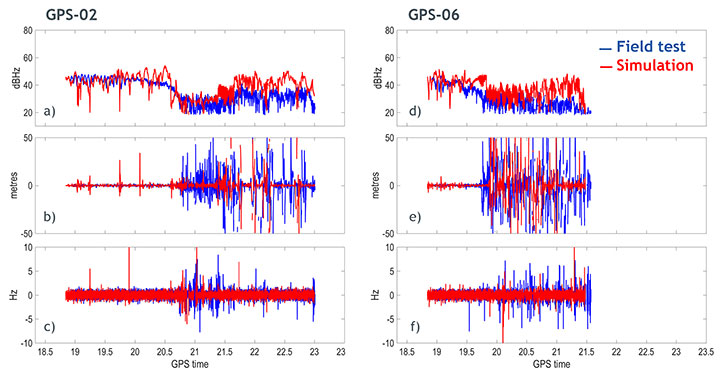
San Jose Static Results. Figure 6 shows the results obtained from the San Jose static scenario for satellites PRN02 and PRN06: C/N0 ratio, pseudorange residual and Doppler residual for field test (blue line) and simulation (red line). Although the simulation sometimes creates deeper fading than in the field test, a first comparison indicates a good correlation of simulated data with field-test data.
Figure 6. Carrier-to-noise ratio (top), pseudorange residual (middle) and Doppler residual (bottom) for PRN 02 (left column) and PRN 06 (right column). (Image: Tommaso Panicciari, Mohamed Ali Soliman and Grégory Moura)
The signature of the multipath caused by this urban environment is visibly captured in the simulation. More interestingly, the pseudorange residuals and, to a lesser extent, Doppler residuals also indicate that the model is replicating the dynamics of the multipath environment in close correlation with the field test.
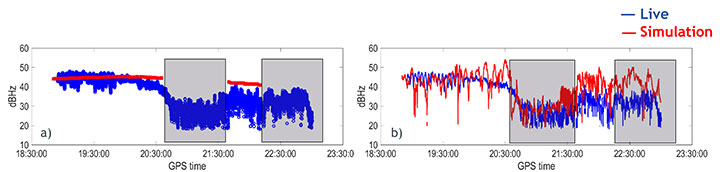
Figure 7 shows the C/N0 obtained from the field data (blue), and simulated data (red) with only obscuration (a) and with obscuration and multipath (b) for the static scenario.
It can be noticed that the receiver can still track PRN02 without the LOS, therefore, relying on just the NLOS signal. This can be clearly seen in Figure 7a where a sudden drop in power is associated to an obscuration of the same satellite (based on our 3D urban model).
Figure 7b shows the C/N0 obtained from the simulation (red line) when both obscuration and multipath were enabled. In this case the receiver could track the satellite even in the case of only NLOS as in the field test.
Figure 7. Carrier-to-noise ratio for satellite PRN02 with only obscuration (a) and with multipath (b). (Image: Tommaso Panicciari, Mohamed Ali Soliman and Grégory Moura)
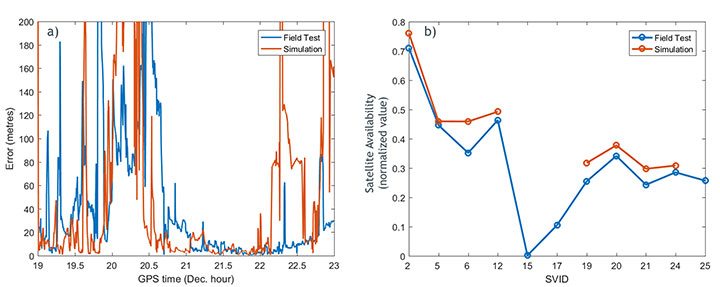
The positioning error for the San Jose static scenario is shown in Figure 8a. The simulation and field-test data have a comparable error. The error is relatively big at the beginning of the simulation and decreases after time 20.6. At the time 22.3, a moderate increase in the positioning error is visible in the field data until the end of the test. The simulation also shows a similar trend in this last part of the test, but tends to generate a higher positioning error.
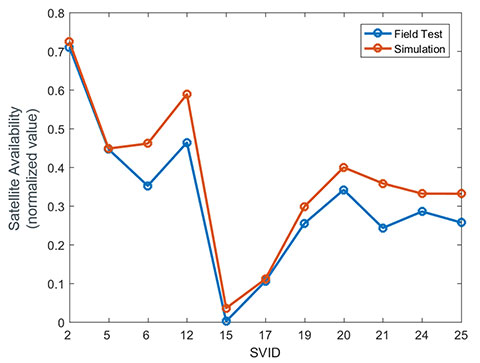
The satellite availability is shown in Figure 8b for both simulated (red) and field test (blue). The availability of the satellites generated with simulated data is in close relationship with the field data. However, some satellites could not be tracked in the simulation.
Figure 8. a) positioning error for field-test (blue) and simulation (red); b) satellite availability for field data (blue) and simulation (red). (Image: Tommaso Panicciari, Mohamed Ali Soliman and Grégory Moura)
The importance of the accuracy of the 3D scene is evident in this example. In fact, we noticed that one of the buildings that was simulated as a simple concrete box was more complex in the real environment. Therefore, we applied some modifications to scene, as in Figure 9.
Figure 9. 3D scene improvement. (Image: Tommaso Panicciari, Mohamed Ali Soliman and Grégory Moura)
After those changes, a general improvement in the results was visible, but most importantly, the missing satellites could finally be tracked by the receiver (Figure 10).
Figure 10. Satellite availability for field data (blue) and simulation after scene improvement. (Image: Tommaso Panicciari, Mohamed Ali Soliman and Grégory Moura)
SAN JOSE DYNAMIC TEST RESULTS
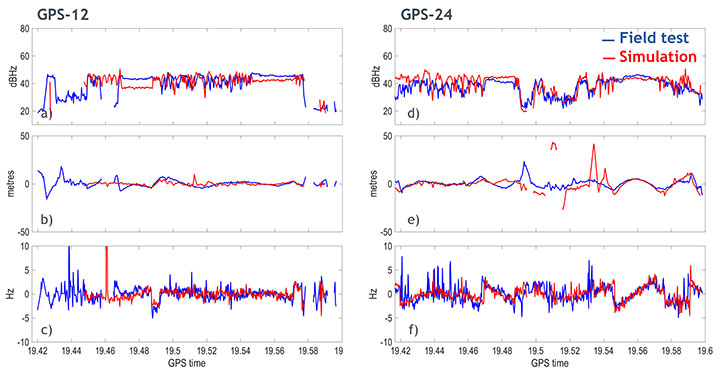
Similar results were obtained with the dynamic test in San Jose. Figure 11 shows the results obtained for satellites PRN12 and PRN24. The walking trajectory included two points where the antenna was stopped because of a traffic light. Those points correspond to a relatively flat C/N0 that can be clearly seen in the field test and simulation data for both PRNs. When, instead, the antenna was moving, a higher variation in the C/N0 is noticeable in both simulation and field test.
Figure 11. Carrier-to-noise ratio (top), pseudorange residual (middle), and doppler residual (bottom) for PRN 12 (left column) and PRN 24 (right column). (Image: Tommaso Panicciari, Mohamed Ali Soliman and Grégory Moura)
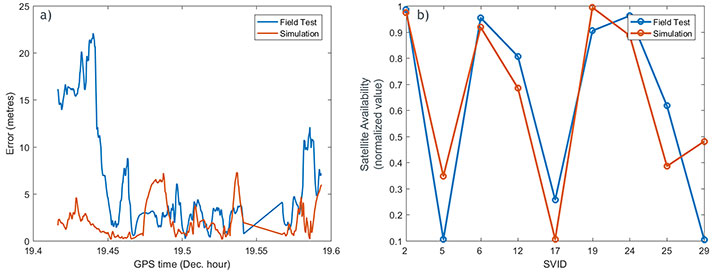
Figure 12a illustrates the positioning error obtained from simulated (red) and field test (blue). The first part of the simulation produced an error smaller than the one obtained from field data. However, from the time 19.48, a good agreement can be seen. The satellite availability is also shown in Figure 12b. This last result was obtained with the improved model described in Figure 9.
Figure 12. (a) Positioning error for field-test (blue) and simulation (red); (b) satellite availability for field data (blue) and simulation (red) after scene improvement. (Image: Tommaso Panicciari, Mohamed Ali Soliman and Grégory Moura)
CONCLUSIONS AND FUTURE WORK
A new real-time system for multipath simulation is designed to generate realistic multipath that depends on time, position and type of urban environment. The 3D scene is used to calculate the multipath (reflection and diffraction) caused by the buildings and objects around the antenna.
Some first results demonstrated that realistic multipath can be generated by simulating reflections and diffractions even with a simple 3D model. However, the inclusion of finer details in the model can improve the simulation and make it even closer to reality.
As always, simulation interest is a tradeoff between reliability in all conditions and efforts to adapt (that is, to specify) a generic and simple model. The added value of our model consists in its simplicity and its good compliance with field data.
Ray-tracing techniques coupled with geometrical optics and uniform theory of diffraction are efficient and simple methods to simulate the propagation of GNSS signals in complex urban environments. Their efficacy is demonstrated by a good agreement between simulation and field measurements. Some discrepancies still exist and are due to the limitations of such a model:
The accuracy of the model is never perfect and, as ray-tracing is a deterministic method, the returned results strongly depend on the quality of the input data used to generate the model.
Geometrical optics is a simple (but efficient) method. Only specular rays are modeled, thus the system won’t be able to generate all the signals coming from other phenomena such as scattering. Another limitation is given by the hardware. In fact, the number of simulated multipath depends on the number of available channels in the simulator.
The simulation parameters try to mimic the field conditions. However, the simulated trajectory is approximated, and other factors like pedestrian motion, vegetation (isolated trees or forest) and traffic may contribute to reduce some of the discrepancies that can be observed between simulation and field
All of these limitations can explain the differences between simulated and measured data. Currently, the impact of vegetation (forest and/or isolated trees) models, pedestrian motion and traffic on the multipath signal can also be simulated and their performances are under evaluation.
ACKNOWLEDGMENTS
We thank Colin Ford and Ajay Vemuru from Spirent Communications and Antoine Boudet, Yann Dupuy, Arnold Duquesne and Paul Pitot from OKTAL Synthetic Environment.
MANUFACTURERS
The system described in this article consists of a Spirent GNSS simulator equipped with a SimGEN software suite and the SE-NAV simulator developed by OKTAL Synthetic Environment. SE-NAV is interfaced with SimGEN via the SimREMOTE protocol, a real-time control and motion API.
Tommaso Panicciari obtained a Ph.D. in telecommunications from the University of Bath (UK). He is a software/project engineer at Spirent Communications where his main activity focuses on spoofing and multipath simulation.
Mohamed Ali Soliman is completing a master’s degree in telecommunications with business at University College London. He is a product manager at Spirent Communications, managing multiple products including the multipath simulation offering.
Grégory Moura graduated from the French Institute of Aeronautics and Space with an M.S. in cosmology from Université de Toulouse. He manages the GNSS activities of the French company OKTAL Synthetic Environment.
During my tenure as the GIS manager for the Atlanta Regional Commission, I had the opportunity to work with many first responders, primarily police, fire and E911. I always promoted the capabilities of GIS to develop a common operational picture.
However, most first responders were not interested in becoming GIS experts, especially with traditional GIS software and ortho imagery. They just wanted easy and effective tools that would help them do their job better. Then Pictometry metric oblique imagery hit the scene. It was a game changer because it was easy to use and, most important, the oblique images provided a visual perspective that average users could grasp quickly. (See my 2008 column that explains why.)
Soon, 3D model creation and navigation became common. In my opinion, 3D models are just a more robust way of viewing oblique views. 3D models are becoming more commonplace, but generating those models is more time consuming and resource intensive.
A few of you may remember that four years ago, USSOCOM (U.S. Special Operations Command) had more than 20 — yes, 20 — different 3D model viewers. These were mostly proprietary systems from major contractors that required separate maintenance and support, and sometimes led to user confusion and delays, not to mention expense. USSOCOM appointed a team to evaluate and reduce the number of 3D viewers, and they got it down to two, with Skyline TerraExplorer being one of them.
Building on that 3D reputation, Skyline Software Systems recently developed a 3D model creation capability that puts easy and rapid model creation in everyone’s toolbox. PhotoMesh is Skyline’s new 3D model creation software designed to build photorealistic 3D models as a fully automated process using auto-triangulation (AT) of multiple aerial images. Skyline can provide 3D model creation as a service or provide the software so customers can do the model creation in-house.
Below is a screenshot of a sample model created using PhotoMesh from UAV video I shot. then geolocated by Remote GEO (see my February column). The below 3D model was processed locally by Skyline using a typical laptop, and the entire process was finished in under 35 minutes. However, if speed was critical, Skyline could generate the model in the cloud, with the whole process taking a minute or two.
Here is a quick overview video that will give you an idea of the system capability.
Live demo at GEOINT 2016
While I was at GEOINT 2016 this May, I had had the chance to talk to Steve Marks, the director of business development at Skyline. He gave me an excellent video overview of PhotoMesh.
Steve then provided additional detail in several aspects of PhotoMesh including:
Other developers have come up with similar capabilities, but the Skyline system is the most robust I’ve seen, especially with the flexibility for very rapid model creation through the cloud or local creation in a disconnected environment. Additionally, unlike many other 3D model systems, the Skyline models do include trees and shrubs so viewshed and line-of-site analysis is very realistic and accurate.
How would it be used?
In actual use, I can envision first responders arriving at a scene. They could use legacy imagery such as Pictometry oblique images to build a historic as-built model. They could then launch UAV or manned aircraft and capture current geo-located video, selecting and processing images in PhotoMesh and getting back a current 3D model in minutes via the Skyline Cloud service.
In a disconnected environment, the models could be generated locally but at a slower pace. The 3D models would permit horizontal, vertical and angular measurements. Other analyses could include: line-of-sight and viewshed, determination of blast zones and shielding, overhead hazards such as power lines.
ince the system is so robust and easy to use, I can see it supplementing ortho and oblique imagery while providing a very user friendly common operational picture as well as very capable analytic tools.
Retiring soon
At age 70, I’m looking at real retirement later this year so I’m also looking for a relief. If you have an interest or know someone interested in taking over this monthly column, let me know. The folks at Geospatial Solutions and North Coast Media have been a pleasure to work with so I don’t want to leave without a replacement. You can email me at [email protected]