Tag: city planning

  • Bringing 3D perception beyond autonomous vehicles

    Bringing 3D perception beyond autonomous vehicles

    Predictions for the next big industries in lidar

    By HanBin Lee
    CEO, Seoul Robotics

    HanBin Lee
    HanBin Lee

    Lidar sensors that used to cost tens of thousands of dollars now cost only hundreds of dollars. With prices significantly decreasing, 3D sensors are more accessible than ever before. Now, what was once a niche technology exclusively for autonomous vehicles is being deployed globally to make places safer and smarter. Additionally, the industry is continuing to grow: market analysis firm Yolé estimates that the lidar industry will be worth nearly $4 billion by 2025, a 19% CAGR between 2020 and 2025.

    While decreasing sensor prices are a critical factor in the proliferation of lidar, an arguably more significant development is the development of robust perception software that can track, identify and monitor with far greater accuracy and efficiency than ever before.

    Effective 3D sensors, from lidar to radar and 3D cameras, require both hardware and software components. The hardware is critical to capturing data with high resolution and accuracy, while the software processes and comprehends the data, making them actionable. Essentially, software is the “brain” of sensors. Lidar, without equally strong perception software, is like an iPhone without iOS — inoperable and just a piece of machinery.

    Today, at the confluence of these factors, we are beginning to see a proliferation of 3D perception applications beyond autonomous driving. Cities, security and retail are a few key sectors where I predict we will continue to see advancements over the next few years.

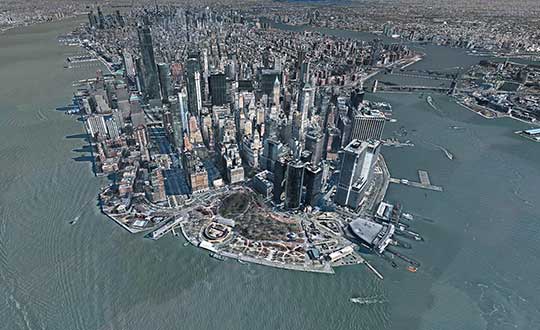
    Making Cities Smarter

    The steep drop in the cost of lidar sensors has made 3D sensors more accessible than ever. (Image: Seoul Robotics)
    The steep drop in the cost of lidar sensors has made 3D sensors more accessible than ever. (Image: Seoul Robotics)

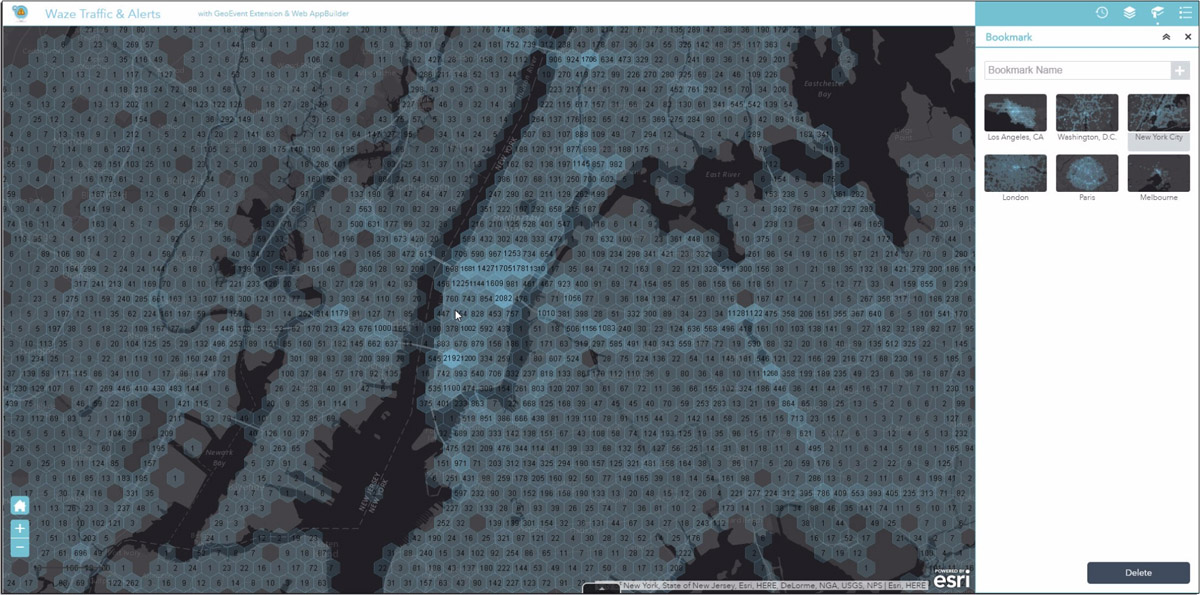
    Today’s cities have a variety of challenges to address, from decreasing traffic collisions to reducing congestion, and we are witnessing municipalities leveraging lidar to collect critical insights into city safety and efficiency.

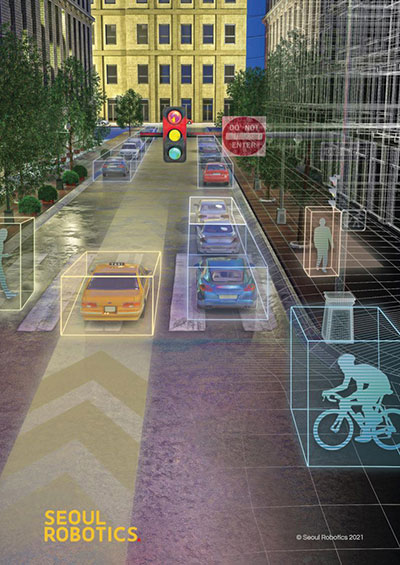
    However, why are they turning to 3D solutions, specifically? Because they can capture the data necessary to make actionable changes. 3D sensors were developed to quickly track and analyze city surroundings for autonomous vehicles, so they are an effective way to ensure that vehicles are not veering into opposing lanes or traversing crosswalks already occupied by pedestrians.

    Cities also adopt 3D applications because they can often address multiple challenges with one system. For example, a city may install a lidar system on an intersection to detect traffic violations, but the system can also capture data about pedestrian safety and traffic flow. These multi-benefit solutions are ultimately more cost-effective for cities because they eliminate the need to install multiple different solutions to solve these problems.

    Creating Safer Spaces

    Companies are turning to 3D data to create safer and more secure environments. (Image: Seoul Robotics)
    Companies are turning to 3D data to create safer and more secure environments. (Image: Seoul Robotics)

    From airports to museums, from stadiums to music venues, the market for 3D-based security solutions is vast. While each of these environments is unique in how it operates, they all rely on technology to ensure that areas are secure, visitors do not enter prohibited areas, and crowds are seamlessly moving through the space.

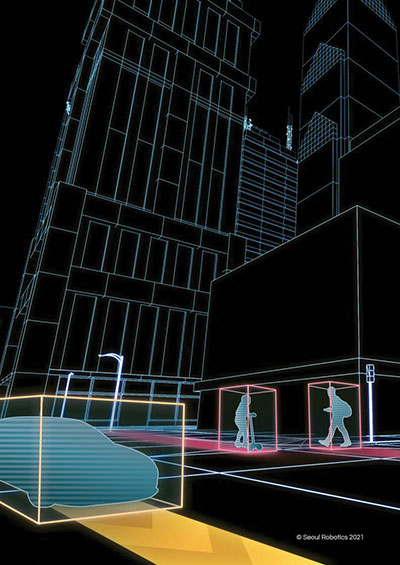
    3D perception helps address these challenges by creating “zones” that can alert security systems if someone enters. Additionally, because 3D sensors can detect and track various objects, including humans, they are increasingly becoming a popular solution for crowd control. They can help venues monitor and address foot traffic, such as with security lines, and they can be valuable in the event of an emergency to ensure that an area is clear.

    Beyond the tangible benefits 3D sensors bring to different venues, companies are turning to 3D data to create safer and more secure environments because they are more accurate and anonymous. Unlike traditional camera-based systems such as CCTV, which are often prone to false positives, 3D data are incredibly accurate and precise, so they are less likely to set off alarms unnecessarily. Additionally, 3D data do not include biometric information, so they address privacy concerns while still ensuring that areas are secure.

    Building 3D Retail Environments

    By implementing 3D-based solutions into a physical retail environment, companies can better understand how shoppers are moving through and spending their time in stores. They can glean insights into key metrics, such as:

    • How long are people in line?
    • What areas of the store are receiving the most traffic?
    • With what products are people engaging most frequently?

    As one example, Mercedes-Benz has integrated 3D sensors into its showrooms in Korea, gaining fascinating insights into customer behavior. For example, they’ve discovered that nearly 60% of customers spend their time looking at the trunk space of SUVs, and that red is the most popular color.

    As these solutions continue to become more sophisticated and accessible, we should expect to see them in more areas of our everyday lives. The future of 3D perception is exciting, and it will ensure safer, smarter and more efficient spaces — improving the quality of life.


    HanBin Lee is CEO of Seoul Robotics, a 3D perception company specializing in lidar.

  • Nearmap unveils streaming 3D aerial imagery, AI technology

    Nearmap unveils streaming 3D aerial imagery, AI technology

    Aerial imagery business Nearmap has launched its new 3D product to streamline the way industries such as urban planning, architecture, construction, government and councils view and shape cities across Australia and the U.S.

    The company is also previewing its groundbreaking artificial intelligence (AI) technology at its customer event Navig8.

    Nearmap 3D allows customers to stream and export 3D imagery on demand at massive scale through its proprietary MapBrowser web application. Because the imagery is updated frequently, businesses can work with the most current information to make more informed decisions.

    Nearmap’s new AI technology is turning millions of aerial images — captured over a decade and multiple times a year — into valuable datasets. The datasets can be used to more accurately and efficiently measure change and quantify attributes, such as solar panels, pools, roofs or construction sites.


    Organizations ranging from small businesses to large companies and cities will be able to take advantage of AI-driven location intelligence.

    “Product innovation is in our DNA. Everything we do has the customer at the core,” said Tony Agresta, executive vice president of product at Nearmap. “Our customers’ worlds are evolving every day. We need to keep innovating to continue to give our customers a competitive advantage through technology breakthroughs like the ones we are sharing today at Navig8.

    “Nearmap 3D is the result of a significant investment in R&D, but also listening to our customers and what they need to transform the way they work,” Agresta said. “Accessing 3D imagery up to now has typically been an arduous, time-consuming and expensive process — but not anymore. This represents the single largest, most frequently updated footprint of 3D accessible through a browser. The ability to measure in 3D space, size up an area and then export Nearmap 3D for use in other platforms will transform the aerial imagery market.

    “The AI technology that we’re working on will allow organizations to identify locations with specific attributes and in so doing, reduce site visits, generate more leads, and eliminate the time involved to inspect properties manually. Nearmap AI does the heavy lifting so you don’t have to,” Agresta said.

    Composite aerial image of Perth, Australia. (Image: Nearmap)
    Composite aerial image of Perth, Australia. (Image: Nearmap)

    Instant access to 3D through MapBrowser

    Nearmap is making 3D imagery accessible to anyone, in the same way it has with 2-D. While Nearmap has offered 3D imagery since 2017, this new iteration of the technology allows users to instantly stream 3D content at massive scale via its MapBrowser web application.

    The lightweight platform offers customers an immersive 3D experience, allowing them to visualize cities in 3D from any direction, measure distances, and immediately export a custom area in a variety of 3D formats at unprecedented speed — the download time is a matter of minutes for most requirements and only a few hours for very large footprints.

    “It’s like switching from DVDs to streaming services,” said Tom Celinski, executive vice president of technology and engineering at Nearmap. “Our camera technologies have been capturing 3D since 2017, but now our secret sauce is bringing it onto MapBrowser, allowing users to easily and instantly stream this content with many export options. Now users can visualize, measure, define a custom area, export our 3D and use it in their workflows with other commercial platforms and tools. We’re helping 3D experts and novices alike access reality like never before, and this is an important next step in our Reality as a Service journey.”

    Nearmap 3D comes with an extensive library, covering more than 400,000 square kilometers. It is updated once a year and covers major urban areas in Australia and the U.S.

    “We live in a 3D world, we think in 3D, and so we have to ensure that our products give the closest representation of reality as possible,” Celinski said. “That means businesses that rely on visualizing 3D content, like architects, for example, can now access up-to-date 3D models instantly and export them in just minutes. In a tender process, for example, that can be the difference between winning a new project or not. The opportunities for Nearmap 3D are endless.”

    3D image of Manhattan. (Photo: Nearmap)
    3D image of Manhattan. (Photo: Nearmap)

    A living data set

    Nearmap AI technology is the result of more than two years’ worth of research and development, and a team of close to 20 data scientists and machine learning engineers. The team, led by Dr. Michael Bewley, is using the petabytes of imagery that the business has captured over the past 10 years and turning it into a living dataset to accurately identify changes or quantify attributes from the Nearmap library of aerial imagery.

    Nearmap has built highly accurate machine learning models and deployed them on a massive scale. The automated process, and the constantly learning engine, means that the AI technology can be applied to any new geography. Nearmap also applies the models to new surveys, generating fresh results with current imagery.

    To date, Nearmap has performed analysis on over 1 million square kilometers of imagery across Australia and the U.S. (which constitutes about 80 million properties) and is performing more analysis every day. Nearmap is now inviting customers to take part in a beta program to experiment with various use cases.

    “We don’t prescribe how our technologies or content can be used by our customers,” said Michael Bewley, director of AI systems at Nearmap. “Our solar customers could use the AI technology to easily identify where and when solar panels have been installed for maintenance jobs, to prospect new clients in an area where solar energy’s popularity is on the rise; or a government entity that previously had the arduous task of tracking swimming pools or construction in their jurisdictions will be able to do it automatically.”

    “But this is the tip of the iceberg — we’re just getting started. This technology is going to profoundly change the way that cities are built,” Bewley said. “Our plans include delivering AI results in many forms, much the same way we deliver our imagery today.”

    Both technologies will be presented at Nearmap’s flagship event, Navig8, in Perth on June 6, Melbourne on June 11 and Sydney on June 13.

  • GIS is key to developing smart cities and buildings

    ItalImage: Italy3d/Shutterstock.comy3d/Shutterstock.com
    Image: Italy3d/Shutterstock.com

    GIS is growing in importance to urban development, whether for environmental impact studies, geofencing or building information modeling (BIM). Sharing GIS data with developers is critical to a coordinated approach to smart city growth.

    By Christine Easterfield, Principal Analyst, Cambashi

    Just over half the world’s 7 billion population lives in cities. In Europe, this rises to three quarters, and 30 cities worldwide have populations of more than 10 million — the majority in India, China and South America.

    This trend will continue. It is projected that the global population will reach almost 10 billion by 2050, which means cities will need to cope with increasing demands on housing, transport and communications.

    Growing urban populations place considerable stress on housing stock. Cities need to provide scope to build new, but also to look at best use of existing properties.

    In the growing urban population, there will always be a proportion that needs more support as employment rates shift and wages do not always keep up with city expenses. Social housing projects need to keep pace, and making the most of city resources opens opportunities for smart buildings.

    The role of GIS

    Proposed Indianapolis zoning map. (Image: City of Indianapolis)
    Proposed Indianapolis zoning map. (Image: City of Indianapolis)

    Coordinating new build and refurbishment plans across a city requires planning and organization, and a set of tools to support planners and designers. The layout of city-planning zones is the starting point for many new developments — sharing data about these areas is typically achieved using a GIS (geographic information system).

    The standard city map with records of roads, emergency routes, bike routes, key buildings, new development zones, existing housing stock, utility services and street lighting are a central resource for most cities.

    Sharing data between these city maps and developers’ plans is critical to a coordinated approach to city growth.

    Environmental impact

    The early stages for many developments involve an environmental impact study. How will the new development fit into the existing landscape? What restrictions are imposed because of the conditions of the site or the current demands on local resources? What options are there for addressing these constraints?

    This last point is important for acceptance of the development. Being able to show a level of flexibility to accommodate local concerns and developers’ challenges will build a cooperative relationship. The ability to easily integrate building plans with the city map means that confidence is quickly built into the new plans.

    Combining the geography of the city view with the building model destined for development provides a perfect foundation for an integrated GIS/BIM model to take the development from drawing board to handover.

    Maintaining a digital twin of a development, in the form of a BIM, provides a rich source of information about the as-built building — exact measurements, materials used, changes from the original design and more. Integrating this with the city maps held in GIS means a continuous dataset can be formed.

    Tools for construction site inspection and reporting

    construction
    Photo: Alen Ajan/Fotolia.com

    Developing building information models (BIMs) requires monitoring the build activity and accurate recording of the construction. The best way to do this is as it happens.

    Simple-to-use tools that are robust enough to cope with a construction site are becoming more available from software providers. These support gathering data by construction teams and contractors as the work is completed.

    As well as recording data, these tools are also useful in registering the progress and completion of tasks. Many enable interaction with central systems that can send changes and updates directly to the site for immediate action.

    The same tools can register the location of the user, enabling safer working practices to be enforced.

    The practice of geofencing to monitor or even restrict access to parts of a construction site, by registering the location of a device against a predefined region on a map of the site, can track critical activities and react with the most appropriate action if an incident is reported.

    Remote site inspection and reporting

    The Aeryon SkyRanger. (Photo: Aeryon Labs)
    The Aeryon SkyRanger. (Photo: Aeryon Labs)

    The safest inspections don’t involve human intervention at all. Sending an unmanned aerial vehicle, UAV or drone, to fly over your site removes risk to staff when viewing hazardous environments.

    Photographic imagery collected by drone can be loaded into GIS tools and accurately registered against the map of the area to provide a seamless view of the site.

    Data integration is key

    The range of data that can be accurately gathered and viewed together now covers original 3D designs, 2D construction plans, inspection photo-imagery and as-built updates.

    Integration of BIM and GIS tools means that these different data types can be viewed together and in the same spatial context.

    Support for building operation, management and maintenance in the wider context of a smart city

    On-the-spot data capture of accurate as-built building information models that can seamlessly integrate with existing city plans leads to a data resource that cities can build on to improve safety, security and facilities for their citizens.

    So what should the smart city planner be looking for?

    Existing geospatial and data management tools already address many of these challenges, and when an opportunity for a technology refresh is presented, the approach to smart city support should be a big part of the mix.


    Christine Easterfield
    Christine Easterfield

    Christine Easterfield is principal analyst for Cambashi. She has more than 20 years’ experience in the software business. Her experience has covered geospatial asset management for the utility industry: assessing market needs and opportunities, managing customer requirements, liaising with development teams and running global product introduction programs.

    Previous roles include programming, training, consultancy and product marketing management.

    She has worked for a range of companies from multinationals to small start-ups, resulting in an understanding of how different sized organisations operate, grow and manage change. Christine has a BSc in Computational Sciences and an MA in English Literature.

  • Esri and Waze deliver near real-time data for smarter cities

    Esri and Waze deliver near real-time data for smarter cities

    Esri and Waze smart cities partnership grows. (Image: Esri)
    Esri and Waze smart cities partnership grows. (Image: Esri)

    Waze Live Alerts on traffic and infrastructure now available in ArcGIS Marketplace.

    Waze live alert data will now be available in Esri’s ArcGIS Marketplace for free to members of the Waze Connected Citizens Program.

    The Connected Citizens Program, a two-way sharing of publicly available traffic and road condition information, offers governments a stream of data, constantly updated in real-time, whenever they need it. This enables personnel to make data-driven infrastructure decisions and improves the efficiency of incident response.

    Waze, a free crowdsourced traffic and navigation app, is now fully supported by ArcGIS Online, where its live feed of mapped traffic alerts and other information, such as accidents, congestion and street damage, can be used in applications in minutes.

    “Municipalities can now leverage near up-to-the-minute reports without having to write code or purchase additional software,” said Andrew Stauffer, manager of civic technology at Esri. “Mapped Waze data is available immediately in all ArcGIS apps, where traffic engineers and even city planners can use it to maintain and build safer, more efficient transportation systems.”

    Municipal personnel like traffic engineers can start using this data to analyze where the biggest problems exist on the roads so they can create targeted solutions. For instance, by seeing exactly where the most crashes are occurring, engineers can know where they need to place more officers, replace street signs, or adjust the timing of traffic lights.

    “The Waze Connected Citizens Program is all about removing any barriers to innovation,” said Adam Fried, Waze Global Partnerships manager. “We want to help our partners leverage existing infrastructure and be able to make better data-driven decisions. Now, with just a couple of clicks, a city can easily access and analyze Waze data within Esri ArcGIS and use those insights to improve roadway management and build safer roads for its citizens.”

    Much of the information government organizations rely on to make decisions is becoming obsolete as communities are starting to use technology like sensors and drones to monitor the quality of roads, bridges, and utilities. The Waze Connected Citizens Program gives municipalities the power to harness crowdsourced driver data to not only improve safety and congestion but also make better-informed decisions by giving planners an edge to start building infrastructure that meets the demands of a twenty-first-century city.

    Governments can sign up for the free Waze Connected Citizens Program and start working with the alert data in ArcGIS to create operational dashboards that departments can use right away.

  • Bentley Systems to celebrate Year in Infrastructure in October

    Bentley Systems’ Year in Infrastructure 2018 Conference will be held Oct. 15-18 in London at the Hilton London Metropole.

    Bentley Systems is a global provider of comprehensive software solutions for advancing infrastructure.

    Presented by Bentley Institute, the conference is a global gathering of leading industry executives and prominent thought leaders in the design, construction and operations of the world’s infrastructure. The theme of this year’s conference is “Going Digital: Advancements in Infrastructure.”

    The conference features nearly 70 speakers and more than 50 informative sessions, including keynotes by leading industry experts, interactive workshops, forums, panel discussions and product demonstrations. Attendees can visit the Technology Pavilion, which features exhibits and presentations from Bentley Systems and its strategic partners Microsoft, Siemens, Topcon and Bureau Veritas.

    On the first day of the conference, Bentley Institute will host Digital Advancement Academies, featuring presentations and interactive discussions with subject matter experts who provide insights and best practices in their areas of expertise including reality modeling, BIM strategy and constructioneering.

    The conference also includes the selection and announcement of the winners of Bentley’s Year in Infrastructure 2018 Awards (formerly known as the Be Inspired Awards), which honors the extraordinary infrastructure projects by users of Bentley software throughout the world.

    During six industry-focused forums featured during the conference — Buildings and Campuses, Digital Cities, Industrial Infrastructure, Rail and Transit, Roads and Bridges, and Utilities and Water — more than 55 awards finalists will present their projects to independent panels of jurors, more than 100 members of the press, and conference attendees.

    From those presentations, winners are selected by the jurors, and will be announced at the conclusion of the conference on Oct. 18 during an evening ceremony and gala.

    Aret Garip, technical director for WSP, attended Bentley’s conference last year in Singapore to represent WSP’s One Blackfriars project in London, which was chosen as an awards finalist.

    “The conference has been truly inspiring and educational,” Garip said. “It’s a great event to learn about the latest tech in engineering design software and an opportunity to meet the creative, intelligent people who develop new tools to make it easier for us to design buildings.”

    In October 2019, the Year in Infrastructure Conference will return to the Marina Bay Sands Expo and Convention Centre in Singapore.

  • OnTerra offers new version of MapSavvy web map service

    mapsavvy-logoOnTerra Systems has introduced a new version of its MapSavvy aerial imagery service and a corresponding new website, www.MapSavvy.com.

    MapSavvy is an affordable Web Map Service providing OGC-compliant images for anyone who needs aerial images in the course of their work or research.

    The new version of MapSavvy offers users access to two versions of Bing Maps aerial imagery: original Bing Maps imagery and the recently updated aerial imagery updates introduced in 2017.

    Typical users of MapSavvy are GIS and CAD professionals from business, research, or government organizations that need to use aerial imagery as part of projects, presentations, reports, or visual analysis of trends.

    Examples of MapSavvy users include:

    • Architects and developers: Architects and developers use MapSavvy in GIS and CAD applications to obtain aerial imagery of construction sites to incorporate into projects, proposals and presentations that show where new buildings or structures would be located in the context of an existing built environment.
    • Research teams: Research teams use MapSavvy in GIS and CAD applications to access aerial imagery that will be incorporated into research reports, or to be able to spot trends by visually depicting information on top of an aerial image. MapSavvy is used for wildlife tracking, hydrology, environmental programs and a host of research activities.
    • Public safety: Law enforcement teams use MapSavvy to access base map where crimes are occurring, either to spot trends or to help solve a specific criminal case.
    • City planning: City planners use MapSavvy to see base map aerial views of cities, municipalities and unincorporated areas as part of their process of planning city infrastructure and new developments.
    • Oil and gas: Oil and gas companies use MapSavvy in GIS and CAD applications to view aerial imagery  to plan for pipeline facilities placement.

    The new MapSavvy aerial imagery service offers the flexibility of access to original Bing Maps imagery as well as the new updated aerial imagery introduced in 2017. The original Bing Maps imagery offers the highest resolution. The newly updated Bing Maps imagery offers the most up-to-date imagery of developed areas that have undergone changes to streets and buildings, or wild land areas that have seen changes due to geological shifts or wildfires.

    “By offering MapSavvy users access to the original Bing Maps imagery and the new updated imagery, users get the best of both worlds,” said Steve Milroy, OnTerra Systems president. “This new version of MapSavvy lets users access original Bing Maps imagery if their application requires high-resolution images, or access recently updated Bing maps imagery if they require the most up-to-date images showing changes to cityscapes or wild lands.”

  • Agency9 releases free global 3D world in CityPlanner

    Agency9 has released free global 3D terrain and buildings in CityPlanner, its cloud solution for collaborative urban planning on the web. Agency9 is a provider of software for online 3D visualization of geographic information and maps.

    “Agency9 currently serves many customers with web-based 3D visualization tools in CityPlanner. With the release of the free global 3D world in CityPlanner, we aim to further stimulate users transition to 3D using modern planning paradigms — as well as lower the financial hurdle of adopting such services. Bundling free 3D data with the service allows any city in the world to start using CityPlanner instantly, without the lead time of acquiring data,” said Håkan Engman, CEO Agency9 AB.

    CityPlanner represents a new generation of 3D tools for the preparation of plans, project communication, and citizen dialogue in smart cities, according to Agency9. CityPlanner is used by many cities for urban planning, promotion, GIS presentation and crowdsourcing.

    The free global 3D model has a terrain based on open satellite data and LOD1 buildings generated dynamically from OpenStreetMap building data. Buildings are currently available for the Nordics, expanding globally throughout the year.

    “Later this year Agency9 will add large scale paid 3D premium content on a region, national, and continental basis. This further supports market adoption with easy access to 3D data and services.” continued Engman

    CityPlanner is available as a subscription service with the new global data included at price plans starting at €220/month. In the Enterprise plan, customers can expand the number of users and capacity to suit organisational needs, as well as use their own 3D data of any size — including highly detailed textured 3D city models.

    CityPlanner is available as a free 30-day trial, which includes the free global 3D data.

  • Esri UC: How Esri CityEngine powered Disney’s Zootopia

    Brandon Jarratt took plenary attendees behind the scenes of city creation in Zootopia, using Esri CityEngine. (Photo: Esri)
    Brandon Jarratt, Disney.

    Brandon Jarratt took GIS professionals behind the scenes of animated city creation at the Esri User Conference, being held this week in San Diego.

    Jarratt served as general technical director for Disney’s Zootopia, which won the 2016 Academy Award for Best Animated Feature Film. Jarrett took the stage during the plenary session to describe how the Zootopia team used Esri CityEngine software to create the complex city that serves as the backdrop for the movie.

    Jarratt said Disney animated features need three elements: compelling stories, appealing characters and believable worlds. That’s believable worlds, not realistic worlds.

    Disney animated movie elements. (Photo: T. Cozzens)

    In this case, the complex city of Zootopia had to be designed from the ground up as a complex city with various districts designed to accommodate the vast array of animal species.

    In the world of Zootopia, humans don’t exist. Transportation systems, houses, streets and services need to accommodate animals as tall as giraffes and as small as a shrew. To meet these challenges, the designers turned to Esri CityEngine and its multi-scaling feature.

    The Zootopia world also needed to incorporate various habitats, or in this case, districts. At the center a large complex city dominates.

    The four burroughs of Zootopia. (Image: Disney)

    CityEngine was used in the creation of the city in Big Hero 6 as well. In Big Hero 6, the base city geography used was San Francisco, upon which Japanese-style buildings were placed. In all, 80,000 buildings were incorporated into San Fransokyo.

    San Fransokyo in Big Hero 6. (Image: Disney)

    Zootopia, on the other hand, was built from scratch — including the terrain. The team started with research of various landscapes to create a basemap.

    Zootopia concept map. (Photo: T. Cozzens)

    At the city-building stage, CityEngine’s custom tool was used to lay down streets.

    Buildings were designed for each district. The building styles couldn’t be repeated too often, or the city would look unrealistic, Jarratt said. The designers used carefully calibrated mix rules to keep the cities lively.

    The desert area of Sahara Square is make of 61,000 parts, including buildings, wall segments and palm trees. (Image: Disney)

    The ability in CityEngine to change the makeup of a city, adjusting the frequency of the various parts, made it easy for the illustration team to meet the art director’s requirements. When he wanted more skyscrapers, or buildings of a certain design, the team was able to provide new concept images the same day.

    Zooptopia being built in Esri CityEngine. (Photo: T. Cozzens)

    Esri’s CityEngine GIS technology is used by city planners to design our future smart cities. “It’s so similar to how city planners create real cities,” said Esri President Jack Dangermond. He then presented Jarratt with Esri’s first-ever Best Animated Feature Using GIS award.

  • Esri UC: How CityEngine powered Disney’s Zootopia

    Esri UC: How CityEngine powered Disney’s Zootopia

    Brandon Jarratt took plenary attendees behind the scenes of city creation in Zootopia, using Esri CityEngine. (Photo: Esri)
    Brandon Jarratt, Disney.

    Brandon Jarratt took GIS professionals behind the scenes of animated city creation at the Esri User Conference, being held this week in San Diego.

    Jarratt served as general technical director for Disney’s Zootopia, which won the 2016 Academy Award for Best Animated Feature Film. Jarrett took the stage during the plenary session to describe how the Zootopia team used Esri CityEngine software to create the complex city that serves as the backdrop for the movie.

    Jarratt said Disney animated features need three elements: compelling stories, appealing characters and believable worlds. That’s believable worlds, not realistic worlds.

    Disney animated movie elements. (Photo: T. Cozzens)

    In this case, the complex city of Zootopia had to be designed from the ground up as a complex city with various districts designed to accommodate the vast array of animal species.

    In the world of Zootopia, humans don’t exist. Transportation systems, houses, streets and services need to accommodate animals as tall as giraffes and as small as a shrew. To meet these challenges, the designers turned to Esri CityEngine and its multi-scaling feature.

    The Zootopia world also needed to incorporate various habitats, or in this case, districts. At the center a large complex city dominates.

    The four burroughs of Zootopia. (Image: Disney)

    CityEngine was used in the creation of the city in Big Hero 6 as well. In Big Hero 6, the base city geography used was San Francisco, upon which Japanese-style buildings were placed. In all, 80,000 buildings were incorporated into San Fransokyo.

    San Fransokyo in Big Hero 6. (Image: Disney)

    Zootopia, on the other hand, was built from scratch — including the terrain. The team started with research of various landscapes to create a basemap.

    Zootopia concept map. (Photo: T. Cozzens)

    At the city-building stage, CityEngine’s custom tool was used to lay down streets.

    Buildings were designed for each district. The building styles couldn’t be repeated too often, or the city would look unrealistic, Jarratt said. The designers used carefully calibrated mix rules to keep the cities lively.

    The desert area of Sahara Square is make of 61,000 parts, including buildings, wall segments and palm trees. (Image: Disney)


    The ability in CityEngine to change the makeup of a city, adjusting the frequency of the various parts, made it easy for the illustration team to meet the art director’s requirements. When he wanted more skyscrapers, or buildings of a certain design, the team was able to provide new concept images the same day.

    Zooptopia being built in Esri CityEngine. (Photo: T. Cozzens)

    Esri’s CityEngine GIS technology is used by city planners to design our future smart cities. “It’s so similar to how city planners create real cities,” said Esri President Jack Dangermond. He then presented Jarratt with Esri’s first-ever Best Animated Feature Using GIS award.

  • Esri CityEngine 2017 designed for efficient urban planning

    Esri CityEngine 2017 designed for efficient urban planning

    Esri has released Esri CityEngine 2017 with a variety of new features.

    This latest version of Esri’s 3D modeling software offers new features that let planners and architects compare different scenarios and visualize them with dashboards to view how each would affect the same geographic area — all in real time.

    Image: Esri
    Image: Esri

    With the updates available in the new version of CityEngine, users can make changes to specific features — such as adjusting the size of windows or adding a balcony — in a model without affecting the entire structure.

    Before this, planners would have to create two entirely different projects to understand the consequences of a proposed building’s design variations.

    “With this release of CityEngine, we focused on the needs of urban planners, designers and architects,” said Pascal Mueller, director of Esri R&D Center Zurich AG, where CityEngine is developed. “We are proud to introduce a groundbreaking new-tool concept for the scenario-based planning in a 3D application.

    The software team also implemented long-awaited user requests such as measurement tools and computer-generated architecture (CGA) neighborhood queries, Mueller said. Also, the graphical user interface has been completely revamped with a fresh, modern look and improved ease of use.

    The new CityEngine also introduces procedurally generated 3D city content. This means that planners can automatically create unique design features on buildings without manually rendering them. This feature saves time that urban planners and architects would otherwise spend generating details themselves.

    “Smart cities of the future will be designed more transparently, and the design process will engage citizens,” said Dominik Tarolli, head of 3D geodesign business at Esri. “With CityEngine 2017, smart city scenes can be created in minutes and shared via the web or Esri’s ArcGIS 360 VR app in a single click.”

    The latest version of CityEngine is available for Windows, Mac and Linux platforms. A free 30-day trial with full export capabilities can be downloaded.

  • Roadmap helps guide city planners to the smart, connected cities

    Smart-Cities-Roadmap-Cover_1494274629094The 5G network, augmented reality, machine learning and other innovations are delivering a wealth of options to rapidly advance the power of Smart Cities technology.

    The Smart Cities Technology Roadmap helps city planners know what’s on the horizon for tomorrow so that they can start developing their technology vision today. The report is developed by the Alliance for Telecommunications Industry Solutions (ATIS), an organization that brings together the top global information and communication technology (ICT) companies.

    The roadmap is the first ICT industry publication designed for city decision makers including CTOs, CIOs and technology advisors that provides an overview of the network-enabled technologies to have the greatest impact on the evolving Smart City.

    The goal is to foster better budgeting, purchasing and staging decisions. The end result will be to position city decision makers to more effectively manage their upcoming technology investments as they create the connected cities of the future.

    ATIS’ Smart Cities Technology Roadmap was developed through extensive discussions with city leaders, solution providers and manufacturers — all heavily invested in creating successful Smart Cities environments. It is available free of charge on the ATIS website.

    “Rapidly advancing capabilities to collect and analyze constant real-time data are starting to help better manage many citizen-centric functions, improving traffic flow monitoring, public safety, and more,” said ATIS President and CEO Susan Miller. “The Roadmap is a much-needed focal point for dialogue between city planners and the ICT industry. It can enable planners to turn their Smart Cities projects into a comprehensive Smart Cities vision.”

    Plans being made now will be more effective if they consider the introduction of 5G solutions in the next few years. These deliver the promise of high bandwidth, low-latency and pervasive connectivity offering Smart City ecosystems a new generation of applications.

    The Roadmap helps planners look ahead to leverage advancements such as these. It provides an overview of Smart Cities technology challenges and benefits and offers a high-level technology framework and summary of key technology enablers.

    The Roadmap also includes a deeper analysis on the current state of standards, a review of technology choices, and an assessment of critical factors that may impact future deployment.

    Following publication of the guide, ATIS will gather feedback on collaborative activities that can advance Smart Cities technology investments. Input from city planners is welcome. ATIS is engaging cities to develop prioritized next steps, whether it be developing data exchanges, building on ATIS’ Internet of Things registry or another business framework. Opportunities are being explored to standardize foundation-level aspects of Smart City infrastructure, allowing customization and innovation to meet each city’s unique vision.

    Companies participating in the roadmap include AT&T, Bell Canada, C-Spire, CenturyLink, Cisco, Cox Communications, Ericsson, Fujitsu, HPE, iconectiv, InterDigital, JMA Wireless, Motorola, NextNav, Nokia, Oracle, Qualcomm, Sprint, TELUS, Verizon, Viavi and West Safety Services.

  • Esri unveils CityEngine mobile virtual reality solution

    Esri has released a virtual reality (VR) solution for CityEngine, the company’s 3D modeling software.

    The newest version of CityEngine allows urban planners, architects and GIS professionals to simply and quickly create VR experiences on mobile devices, the company says in a news release. These experiences can be viewed in the free ArcGIS 360 VR app from Esri Labs. Users can immerse themselves into 3D scenes by teleporting to static viewpoints and comparing different urban planning scenarios.

    “We are pleased to see Esri add a mobile VR solution to its 3D smart city platform,” says Christian Huerzeler, project manager at the department of urban planning in Zurich. “By using ArcGIS 360 VR, our planning board and jurors can now study the impact of new architectural developments and urban planning scenarios from the perspective of pedestrians and citizens.”

    Now, rather than relying on high-performance graphics computers and cumbersome wired VR accessories, having a simple smartphone paired with an affordable wireless headset is all that is required to be immersed in a VR experience.

    “We greatly simplified the creation and sharing of the mobile VR experience,” says Dominik Tarolli, head of 3D geodesign at Esri. “In a matter of minutes, a CityEngine user can now create a VR experience out of a 3D scene and share it in ArcGIS Online, Esri’s cloud solution.”

    CityEngine comes with many new additional features, including an OpenStreetMap-ready rule set, says Esri, who is offering a 30-day free trial.