Descartes Labs, a geospatial data analytics company, is using satellite imagery analysis to examine how the coronavirus reduced nitrogen dioxide (NO2) emissions in China.
NO2 is produced by vehicles, power plants and heavy industries such as cement manufacturing, which were shut down during the coronavirus epidemic.
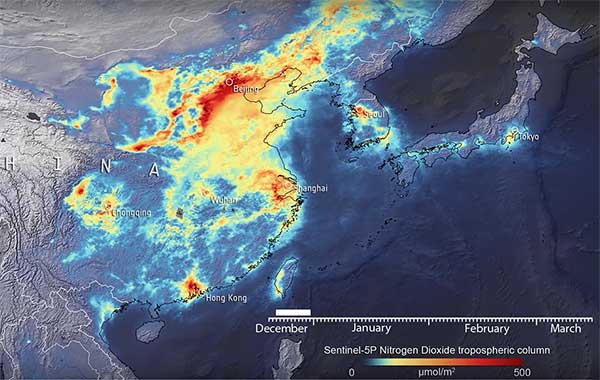
Descartes Labs shared its visualization in a Facebook post. The visualization maps a time series of NO2 levels across Eastern China, Japan and the Korean Peninsula using data from the European Space Agency (ESA) Sentinel-5P satellite.
Plots of NO2 emissions from 2019 compared to 2020 show declines of nearly 60%. Read more on Descartes Lab’s blog.
Copernicus data shared
In a video provided by ESA, a drop in concentrations in late January is visible in China, coinciding with the nationwide quarantine; from the beginning of March, the nitrogen dioxide levels have begun to increase.
Italy reduction
Copernicus data also reveals the decline of air pollution, specifically nitrogen dioxide emissions, over Italy. This reduction is particularly visible in northern Italy, coinciding with its nationwide lockdown to prevent the spread of the coronavirus.
“Satellites offer a unique vantage point to monitor the health of our planet,” said Josef Aschbacher, ESA’s director of Earth Observation Programmes. “Sentinel-5P is one of seven Copernicus satellites in orbit today. It currently provides the most accurate measurements of nitrogen dioxide and other trace gases from space.
“As nitrogen dioxide is primarily produced by traffic and factories, it is a first-level indicator of industrial activity worldwide,” Aschbacher said. “What is clearly visible is a significant reduction of nitrogen dioxide levels over China, caused by reduced activity due to COVID-19 restrictions, but also the Chinese New Year in January. The Copernicus programme is a perfect example of how space serves all European citizens by combining the political strength of the EU with the technical excellence of ESA.”
“We can certainly attribute a part of the nitrogen dioxide concentration reduction to the impact of the coronavirus,” said Claus Zehner, ESA’s Copernicus Sentinel-5P mission manager. “We currently see around a 40% reduction over Chinese cities, however these are just rough estimates, as weather also has an impact on emissions. We are conducting a detailed scientific analysis which will soon provide more insights and quantified results in the following weeks and months.”
The Copernicus Sentinel-5 Precursor mission, also known as Sentinel-5P, is dedicated to monitoring air pollution by measuring a multitude of trace gases as well as aerosols — all of which affect the air we breathe.
Vexcel Imaging, a provider of aerial imagery data, large-format aerial cameras and photogrammetry software, has signed a definitive agreement to acquire the imagery sourcing group from Verisk’s Geomni business.
The acquisition will combine Geomni’s imagery surveying and content-related teams and assets into Vexcel. Verisk, a data analytics provider, will be a minority owner in Vexcel with full access to all aerial imagery libraries.
The combination of Geomni’s fleet of fixed-wing aircraft and aerial operations, mapping business and oblique aerial image library together with Vexcel’s sensor business and data program will create a world-leading geospatial data library.
Geomni’s analytics team and assets will remain part of Verisk and continue to focus on world-class advanced analytics. The team will work closely with Vexcel on a strategic road map and joint projects.
“The strategic alliance between Vexcel and Verisk demonstrates both companies’ resolve to drive rapid innovation across imagery and analytics — to enter new markets, create new categories, and better serve commercial and insurance customers,” said Jeffrey C. Taylor, president of Geomni. “Partnering with Vexcel is a huge leap forward in the services we can provide customers.”
Vexcel Imaging was founded in 1992. The company’s successful line of UltraCam systems was launched with the first UltraCam in 2003. Vexcel is headquartered in Boulder, Colorado; operates an office in Graz, Austria; and will now have teams and operational hubs strategically located throughout the United States and in Spain.
“Our alliance with Vexcel benefits our customers through a unified, robust, and rapidly expanding global aerial imagery library that will deepen their understanding of ground truth,” said Mark Anquillare, chief operating officer of Verisk. “The combination of Verisk’s and Vexcel’s data will provide tremendous coverage for customers and help drive Verisk’s proven ability to innovate advanced analytic solutions.”
“By combining forces with Verisk, we’re making a progressive move to accelerate innovation within the geospatial data industry,” said Erik Jorgensen, chairman and CEO of Vexcel Imaging. “Vexcel and Verisk share tremendous synergies, and we look forward to bringing the definitive imagery and geospatial data library to the market — unmatched in its size, quality and breadth.”
Vexcel maintains a strong partnership with the Geospatial Intelligence Center (GIC), an insurance industry consortium spearheaded by the National Insurance Crime Bureau (NICB), a nonprofit organization dedicated to fighting insurance fraud and crime, and powered by Vexcel’s data program. The GIC empowers its member insurers to improve their decision making and risk management by leveraging aerial imagery and data in visual tools and automated processes. The partnership will provide enhanced support to GIC member insurers in the form of additional flying and processing capabilities as well as access to the newly scaled and unified geospatial library and enhanced analytics.
The transaction is expected to close the first quarter of this year, subject to the completion of customary closing conditions.
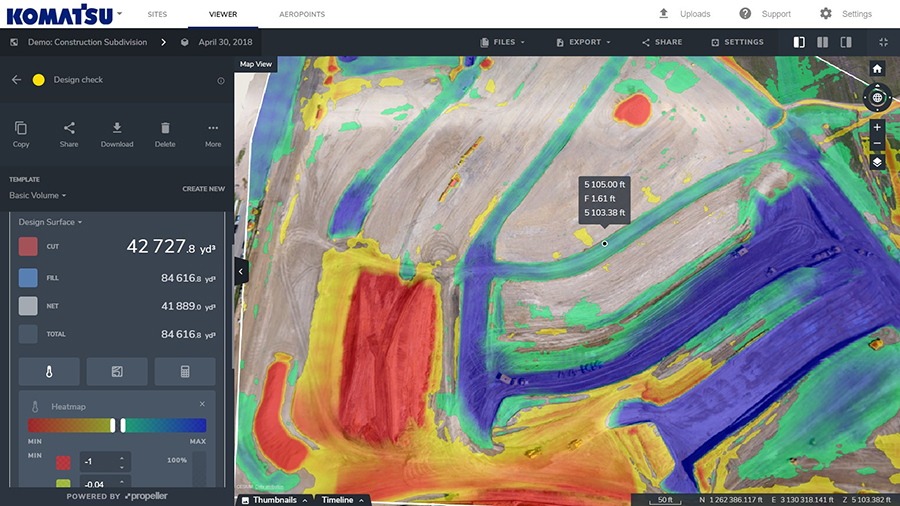
Komatsu America Corp. and Propeller Aero Inc. are partnering to boost the efficiency of construction job sites using drone-powered mapping and analytics software.
With drones becoming an increasingly common worksite tool, Komatsu has identified aerial mapping and analytics as a key component of its Smart Construction initiative — a range of integrated hardware and software products designed to offer an end-to-end workflow for each phase of construction.
Komatsu America Corp. spent several years testing various commercial drone mapping and analytics products in North America. In Propeller, Komatsu found a robust product suited to meet the needs of modern construction operations. Propeller expertly balances ease-of-use with survey accuracy and reliability, Komatsu said.
Propeller’s processing machinery crunches thousands of drone images in hours, and delivers the results as a cloud-based 3D model to the user’s desktop or tablet. From there, powerful collaboration and analysis tools let users perform height, volume and slope calculations, and measure change over time to confirm that a project is on track, the companies said.
(Image: PRNewsfoto/Propeller Aero)
Propeller’s technology platform supports multiple coordinate systems, including local site calibrations. This allows personnel to capture up-to-date survey data expressed in the specific geospatial coordinates they already use on that job site. Local grid support is crucial for ensuring drone-captured maps and models match up with plans and previous surveys.
“A Komatsu Smart Construction jobsite by definition is technology enhanced and production optimized,” said Jason Anetsberger, senior product manager at Komatsu America Corp. “Adding Propeller Aero as one of our key partners gives our North American distributors and customers exceptional capabilities to achieve this standard in the aerial mapping space. Propeller combines simple, yet powerful analysis tools with accurate and fast site visualization.”
“Worksites are starting to see the real business value of accurate, up-to-date drone data,” said John Frost, vice president of business development at Propeller. “We drive that value through workflows that enable everyone to understand who’s moved what material, how much, and where. It’s all about empowering worksites with the information they need to make data-driven decisions to reduce costs, ensure quality, and use resources efficiently. Now more than ever, stakeholders on site, or in the head office miles away, can stay up-to-date with exactly what’s happening on the ground.”
“Anyone can fly a drone — it’s what you do with the data that makes an impression,” said Chris Faulhaber, smart construction business manager at Komatsu Equipment Co. “Propeller provides fast, accurate data processing via a web platform that is unparalleled. The platform is easy to use, facilitates healthy collaboration and delivers vital information quickly — so everyone can work together better and faster than anticipated.”
Open access to information of geographic places and spatial relationships provides an essential part of the analytical processing of spatial data. Access to connected geospatial programs allows for improvement in teaching and understanding science, technology, engineering and mathematics.
Emerging Trends in Open Source Geographic Information Systems provides emerging research on the applications of free and open software in GIS in various fields of study. While highlighting topics such as data warehousing, hydrological modeling and software packages, the book explores the assessment and techniques of open software functionality and interfaces.
It will serve as a resource for professionals, researchers, academicians, and students seeking current research on the different types and uses of data and data analysis in GIS.
Topics covered include:
Data Warehousing
Geo-Crowdsourcing
Geospatial Databases
Geospatial Facilities
Hydrological Modeling
Multimedia Codes
Search Mechanisms
Software Packages
Spatial Data Mining
270 pages, ISBN13: 9781522550396/ISBN10: 1522550399, publisher: IGI Global
Esri has awarded Microsoft Corporation with the New Technology Integration Award at the Esri Partner Conference in Palm Springs. The award honors a company in Esri’s Partner Network for taking map visualization and location analytics to the next level by integrating ArcGIS in a new or innovative way.
Microsoft was recognized for integrating Esri’s ArcGIS Maps into Microsoft Power BI, a set of business analytics tools. Power BI allows users to share insights in the form of interactive maps layered with authoritative data in one process. Users can access valuable geographic information in order to make better business decisions more efficiently without having to export data from numerous sources online, Esri said.
Power BI enables users to create dashboards, reports, and visualizations of data through a cloud-based service. This allows anyone in an organization to use Power BI’s powerful analytical capabilities anywhere, and access them via an application that can be downloaded to mobile devices. For instance, a retailer surveying a new location can use ArcGIS Maps within the Power BI mobile app from the field to determine its proximity to potential affluent consumers.
“We’re excited and humbled to receive the 2017 Esri Partner Conference New Technology Integration award,” said Kamal Hathi, general manager, Power BI, Microsoft Corp. “Thanks to the dedicated team across Esri and Microsoft, we delivered a sophisticated solution in record time. This was made possible by the open and extensible Microsoft Power BI platform which makes it easy for partners such as Esri to plug in and add value to our mutual customers. ArcGIS Maps for Power BI continues to iterate and improve based on customer feedback, reflecting the agility and customer oriented approach of both companies.”
Armed with what Esri calls The Science of Where, a transformational way to unlock data’s full potential, Power BI users can create informed location-based analyses for everything from allocating resources to the best places to start a new business.
Last month I raised my anxiety level by writing about a revenant threat from terrorist-initiated biological attacks.
The same concerns were also cited by Director of National Intelligence James Clapper during recent Congressional testimony. These “poor man’s nukes” could potentially be more devastating than 9/11 and reach into every community and even our own homes. Additionally, the threats are not easy to ferret out and just as difficult to stop in our very complex and interconnected world.
From bioterrorism to natural disaster emergency management, predictive analytics used with geospatial tools and big data is proving to be a powerful new intelligence tool that may help counter global threats.
TransVoyant Predictions
TransVoyant CEO Dennis Groseclose.
Last year there was a lot of buzz at GEOINT surrounding a relatively new company in this field called TransVoyant. Several weeks ago, I visited TransVoyant’s Alexandria, Virginia, headquarters to learn more about their capabilities first hand. I was fortunate to be able to speak with TransVoyant CEO Dennis Groseclose, an Air Force Academy graduate who, with Tim Fleischer, a Naval Academy graduate and successful entrepreneur (Radian, PD Systems), co-founded TransVoyant.
Previously, Dennis led industrial base optimization restructure for the $37 billion dollar unmanned space launch program for the U.S. Air Force; directed and implemented Worldwide Supply Chain Optimization for IBM; and served as vice president at Lockheed Martin. These experiences built his expertise to solve complex supply chain and global risk management problems using advanced analytical intelligence. In 2011, Dennis and Tim put their collective experience together to form TransVoyant, a company that specializes in creating live and predictive insights from real-time big data.
The Internet of Things (IoT) has been a key component of their operation. In the mid-80s, connected remote sensors numbered in the thousands. In 2016 that number is expected to reach 6 billion connected “things” worldwide with estimates of 30 billion by 2020.
TransVoyant collects, cleanses and analyzes over 200,000 external events around the world every minute (such as severe weather, natural disasters, labor strikes, inventory locations, news, terrorism incidents, disease outbreaks and energy prices) from real-time IoT data sources such as sensors, radar, GPS, satellites, smartphones and meters. It then continuously applies advanced data scientist-crafted analytics to these data streams to assess important current and future behaviors, impacts, correlations, patterns and exceptions that deliver live and predictive insights ranging from forecasts of port disruptions and precise shipment arrival times to forecasts of economic flows to real-time and predicted threats to people and assets. The resulting insights — provided via cloud services, system API connections, email and mobile applications — improve mission-critical decision making.
The geospatial grid connection
This was all sounding like science fiction and black magic until an “aha moment” for me, as Dennis explained how they use a “multi-dimensional grid cell mathematics” based data structure to apply complex algorithms to real-world data and events. This put the very complex process of continuous real-time machine analysis that “understands” normal and abnormal behavior, both current and future, into something that was familiar to me.
Decades ago, I used the first release of ArcINFO GRID, now called ArcGIS Spatial Analyst, to complete my master’s thesis. For those of you that haven’t used a grid-cell-based GIS, let me highlight the differences between that and traditional GIS software.
Traditional GIS software describes our world as points, lines or polygons with topology describing the mathematical spatial relationship between each geographic element and its linked record in a database. This topological model is somewhat cumbersome and slow because the shapes and topological relationships are complex.
Grid: David Kidner, Mark Dorey & Derek Smith, University of Glamorgan, Wales, U.K. CF37 1DL
The other kind of GIS is a grid cell or raster-based GIS. The data model is significantly simpler because — unlike a traditional GIS of points, lines and polygons — the grid-based GIS world is broken up into simple uniform grid cells.
The big advantage is that the data structure and tools lend themselves to very fast processing. Almost any mathematical formula can be used to operate on the individual or collective grid cells. Most grid-based systems use predefined mathematical operations such as shortest path analysis, interpolation including Kriging or very complex formulas using map algebra.
So, very similar to the famous Napoleon Hill quote, “Whatever the mind can conceive… it can achieve.” With a grid cell GIS, if an analyst can think of a way to describe an analytical process and predictive results as a mathematic expression or formula, it can be done very quickly in the grid cell environment. (See two previous columns for more in-depth information — “GRID Cell Modeling” and “Topology is not Topography”.)
So what does grid cell GIS look like in action?
Evacuations during a flood.
Proactive Emergency Response
In my discussions with Dennis, a TransVoyant customer segment that caught my attention was support of first responders. Emergency responders are using TransVoyant to help with very early disaster response. One specific example is evacuation of invalid patients before a flooding disaster becomes life threatening.
A hospital evacuation.
Using TransVoyant’s analytics on an extensive network of satellite imagery, 911 and 311 calls, water-stage sensors, street closures, weather forecasts, registries and more, responders can predict areas that are at high risk for flooding hours before flood waters rise. Among other essential emergency management actions, these early warnings provide emergency responders with the ability to identify specific neighborhoods and homes that have disabled residents who can be easily evacuated, increasing the safety and efficiency of their operations.
Here is a screen capture of TransVoyant Continuous Decision Intelligence (CDI) predicting a flood event.
TransVoyant Continuous Decision Intelligence (CDI) predicts a flood.
Other Clients
TransVoyant’s live and predictive insight solutions have attracted customers ranging from large multinational corporations to National Security and Intelligence agencies.
I know that one hears echoes of Minority Report when reviewing the tools and capabilities of TransVoyant. However, given the serious threat we face for a situation far worse than 9/11, I have no reservations about using open-source data aggregation and brilliant analytics that correlate and uncover patterns of life and global anomalies to divine a threat.
So, will predictive analytics be the tool that stops a bio terrorist or saves lives in critical emergency situations? I don’t know, but the potential threat is too grave not try every tool, including continuous precognition, in our collective toolbox.
TransVoyant will be an exhibitor at GEOINT 2016 this month, so stop by and learn more.
Since we are approaching Mother’s Day and Memorial Day, I’d like to call your attention to my May 2014 column. It’s the best column I ever wrote.
PoLTE Corporation has developed technology that harnesses the global long-term evolution (LTE) deployment to provide accurate and reliable location data.
Unlike localized solutions, such as Wi-Fi and Bluetooth, PoLTE’s technology leverages its Positioning over LTE (PoLTE) Macro software to achieve precision of 2 to 6 meters. The technology makes use of the sounding reference signals (SRS) embedded in an LTE handset user’s transmission. Using adapted radar location techniques, it converts portions of the LTE uplink signal into a probe signal.
The technology enables mobile network operators to deliver highly accurate location data to customers in indoor and outdoor environments.
Traditional macro cell location methods require at least three towers to see the user device to locate the device with precision. Historically, single tower deployments were limited in accuracy to the width of the sector created by the 120-degree antenna that was serving the user device. For example, at a distance of 1.5 kilometers from a base station, the cross range precision would be 4,000 meters. PoLTE Macro can improve the precision to less than 2 meters.
The benefits to leveraging network-based positioning include speed, flexibility, accuracy and data analytics. Customers for the technology include machine-to-machine and Internet of Things technologies, mobile advertising, crowd and customer tracking, and public safety.