Tag: Denmark

  • Fugro delivers seabed geodata, employs wind lidar buoys

    Fugro delivers seabed geodata, employs wind lidar buoys

    Fugro has completed a geotechnical site characterization project for DRA Global as part of the proposed expansion of the port of Richards Bay in South Africa.

    Fugro’s self-elevating platforms being positioned in Richards Bay ready for their geotechnical site characterization for the planned port expansion. (Photo: Fugro)
    Fugro’s self-elevating platforms being positioned in Richards Bay ready for their geotechnical site characterization for the planned port expansion. (Photo: Fugro)

    DRA Global contracted Fugro to acquire critical seabed geodata required for the completion of preliminary engineering and design works. The project began with a cross-continental mobilization of marine assets from Bangladesh and UAE to Richards Bay and was safely delivered despite challenging ground conditions and ongoing COVID-19 restrictions.

    The very soft soils encountered at depths of more than 40 meters below the seafloor required an innovative solution for positioning the two geotechnical drill rigs safely, so Fugro mobilized two bespoke modular self-elevating platforms (SEPs) to acquire high-quality geodata in a wide range of water depths. Their experienced staff, combined with adaptable marine assets and tooling, enabled Fugro to deliver DRA Global’s requirements in full and avoid any data gaps that could have led to an over-engineered design and ultimately higher construction costs.

    “Fugro performed well under difficult circumstances, including challenging site conditions and intense focus on environmental management in sensitive areas, all while working in an operational port,” said Cobus Rossouw, principal marine engineer at DRA Global. “Their robust safety management systems resulted in an investigation completed without a single lost-time incident.”

    Energinet contract for wind lidar measurements

    Fugro’s Seawatch lidar buoys will record continuous wind measurements to support wind-resource mapping for Denmark’s Energy Island development. (Photo: Fugro)
    Fugro’s Seawatch lidar buoys will record continuous wind measurements to support wind-resource mapping for Denmark’s Energy Island development. (Photo: Fugro)

    Fugro has secured a contract with Energinet to provide floating wind lidar measurements for what an offshore artificial energy island, which is being constructed for the Danish Government.

    Fugro will install and operate four SEAWATCH wind lidar buoys at two locations, Energioe Nordsoen and Energioe Baltic, that will act as hubs connecting several offshore wind farms.

    Starting this month October, the buoys will record continuous wind measurements for a minimum of one year to support wind-resource mapping for the two islands, and the engineering and design of the future wind farms. Fugro is already performing geophysical surveys for the Energy Island project under a separate contract to provide Energinet with a reliable de-risked site interpretation.

    The SEAWATCH wind lidar buoy can record wind measurements up to 250 meters above sea level, and wave measurements and current profiles down to the seabed. The buoy also acts as a multipurpose platform for additional metocean sensors and, on this project, will be fitted with sensors to capture geodata on environmental impact parameters.

    Contract for erosion off Indian coast

    OCS Services Pvt. Ltd (OCS), one of India’s marine service providers, has awarded Fugro a two-year contract to support its asset integrity and corrosion management operations off the west coast of India.

    Fugro will help OCS deliver on ONGC’s Protective Coating of Process Platform Project 1, an infrastructure project to maintain and refurbish 32 offshore platforms in seven clusters. The project is expected to be completed by May 2023.

  • GNSS to assist construction on tunnel from Germany and Denmark

    GNSS to assist construction on tunnel from Germany and Denmark

    When completed, the underwater auto and rail tunnel will connect Germany and Denmark. (Image: Femern A/S)
    When completed, the underwater auto and rail tunnel will connect Germany and Denmark. (Image: Femern A/S)

    A European megaproject is relying on GNSS to guide supportive earthworks during construction. The Fehmarn Belt Fixed Link is a planned underwater tunnel that would allow travelers to go by car or train between Germany and Denmark in only seven to 10 minutes. Once completed, the 18-kilometer-long tunnel will be the world’s largest of its kind and is expected to employ up to 3,000 people.

    The 7 billion Euro project is expected to be completed in nine years. Danish construction company Holbøll A/S is building earthworks for 56 bridges on the main route crossing Denmark to where the tunnel would start. Holbøll’s undertakings include ramps and drainage work for the new bridges.

    Holbøll has 130 employees and a machine park of 22 machines equipped with machine control from Leica Geosystems, enabling it to deliver innovative and sustainable solutions on time and at the agreed price.

    At one of the bridges in Vordingborg, operator Flemming Ove Nielsen uses a Leica iCON GD4 3D system on the 61PX Komatsu dozer to perform the first rough work for building the slopes. Using the the iCON GPS 80 receiver, the iCON grade iGG4 system ensures fast and reliable grading with GNSS. Nielsen uses machine control to create the slope, and then the excavator takes over for the final grading work.

    Image: Femern A/S
    Image: Femern A/S

    “The dozer is very efficient for this sort of work because it can move so much dirt and, with machine control, hold the correct angle of the blade,” explained Carl-Ole Holbøll, co-owner and managing director of Holbøll. The dual GNSS solution for the dozer is an advantage because the slope is so steep, and to achieve an accurate cross-slope, dual GNSS is required.

    On another bridge, an excavator is using the Leica iCON iXE3 3D system for the finishing layer of the ramp slope. The operator can document the height of the different dirt layers simply by placing the bucket and letting the iXE3 register the height. This saves time — the operator doesn’t have to wait for a surveyor to conduct as-built documentation for each layer.

    The Fehmarn Belt Fixed Link prime contractor, Femern A/S, has taken the next steps to develop the area where the factory for the tunnel elements will be built. Continued archaeological surveys, preparatory supply infrastructure and drainage has been financed at 55 million Euros.

    Geared with Leica Geosystems, Holbøll A/S has prequalified for several of the derived projects, including the draining and moving of eight hectares in Strandholm Lake in Denmark.

  • Testbed enables infrastructure for autonomy, smart cities

    Testbed enables infrastructure for autonomy, smart cities

    Rooftop view of the central parts of Aarhus with the harbor area and the sea in the background. (Photo: DTU Space)
    Rooftop view of the central parts of Aarhus with the harbor area and the sea in the background. (Photo: DTU Space)

    A testbed in an active urban center can show real-world effects on GNSS as an aid for developing autonomous systems for green mobility, smart-city applications or transportation, to name a few.

    Sited in Denmark, the 600-square-kilometer Testbed in Aarhus for Precision Positioning and Autonomous Systems (TAPAS) covers both a densely populated city center and suburbs, a large industrial harbor and parts of Aarhus Bay. Aarhus is the second largest city in Denmark with a population of 350,000 people.

    The GNSS antenna at TAPAS station TA01. (Photo: DTU Space)
    The GNSS antenna at TAPAS station TA01. (Photo: DTU Space)

    Based on RTK methodology, TAPAS is a sound ground-based testbed to support, test and validate technological developments with a need for fast, efficient, flexible and reliable precision positioning. It is designed as a geodetic innovation platform, with both physical and virtual networks providing positioning to the centimeter (cm) level.

    Autonomous systems within transportation, agriculture and environmental monitoring constitute a large growth area for businesses and governments. Automated vehicles, drones and vessels are linked closely to geodetic infrastructure and communications networks such as 5G. TAPAS provides developers in these fields with opportunities to observe GNSS in urban canyons and under canopies, as well as challenges for coastal marine applications. The testbed is available for third-party research projects, and testing of ideas, initiatives and concrete prototypes.

    TAPAS is fully funded and owned by the Danish Agency for Data Supply and Efficiency (SDFE), the Danish agency for geodesy and geographical data. TAPAS is developed by the National Space Institute at the Technical University of Denmark (DTU Space), and is supported by the city of Aarhus. The TAPAS testbed was established partly because of Denmark’s National Space Strategy, which points to the new technological development within positioning, as well as possibilities for use of Galileo, the European GNSS, to the benefit of as many citizens as possible.

    In this article, we review the TAPAS testbed, including design and installation of the GNSS reference stations and the data-processing center, as well as initial performance testing carried out by DTU Space.

    Network of GNSS Reference Stations

    The network of TAPAS stations in and around the city of Aarhus in Denmark. (Map: DTU Space)
    The network of TAPAS stations in and around the city of Aarhus in Denmark. (Map: DTU Space)

    The basic component of TAPAS is high-accuracy carrier-phase-based GNSS positioning using the network RTK methodology, which can provide real-time position accuracies for the end user down to the cm level.Essentially, TAPAS is based on a network of 11 GNSS reference stations as well as data communication infrastructure, a central processing facility with a data server, processing software and data storage.

    TAPAS was designed to provide real-time position uncertainties for objects in motion within 1 cm in three dimensions (1 cubic cm), for end users with modern GNSS equipment. A dense network of GNSS reference stations was originally designed with stations 5 km apart in the city center and up to 10 km apart in the suburbs.

    Because suitable locations had to be found, in the final network distances range from 4.1 km to 22.3 km, with the longest distances across the water to station TA04 (see the network plot in the graphic above).
    Stations TA01, TA03, TA05, TA06 and TA08 are in the city center. Stations TA02 and TA04 are across Aarhus Bay, ensuring coverage for marine applications and contributing to more robust positioning near the sea and in the harbor area around station TA01.

    TAPAS Stations

    The TAPAS GNSS reference stations are equipped with the newest generation of GNSS receivers and antennas capable of tracking all available signals from the GPS, GLONASS, Galileo and BeiDou systems. The stations also have an antenna splitter, power supply, fuse box, programmable logic controller (PLC) for monitoring and control, trustgate, modem and uninterruptible power supply with battery pack (Figure 1). All units were integrated in the cabinets and tested in the lab before installation The stations are modular and flexible for future iterations and updates.

    The receivers can be accessed remotely via a VPN line to a web interface for monitoring, changing settings or firmware updates. All TAPAS stations transmit data to servers at DTU Space where the data is used for estimation of RTK corrections. Also, data is transmitted to servers at the SDFE for storage and backup (Figure 1).

    Figure 1. Design schematics of the TAPAS stations. (Image: DTU Space)
    Figure 1. Design schematics of the TAPAS stations. (Image: DTU Space)

    After installation in the fall of 2018, GNSS data quality was verified for each station by estimating preliminary positions and analyzing data quality. Also, signal strength as given by the carrier to noise ratio (C/N0) of the received signals was analyzed and plotted with 24 hours of data from each of the stations (Figure 2).

    "Figure

    Network Real-Time Kinematic (RTK)

    Data from the TAPAS stations streams in real time to the Central Processing Facility (CPF) operated at a dedicated server at DTU Space in Lyngby, North of Copenhagen. The GNSS observations are processed using the GNSMART 2 software from Geo++, where corrections for network RTK positioning are estimated. The corrections are estimates for errors affecting the GNSS positioning, such as inaccuracies in satellite positions and clock drift parameters as well as ionospheric and tropospheric effects. The dense network of reference stations in TAPAS will assure that corrections for the atmospheric effects will be of very high quality.

    For estimation of the RTK corrections, standard software settings are used. All corrections are estimated by a state space representation (SSR) technique, where error sources are modeled individually. This means TAPAS can deliver both RTK corrections and corrections for precise point positioning (PPP).

    TAPAS corrections are generated in the RTCM format and output using the NTRIP protocol. Registered users can access the corrections through the internet via an NTRIP caster. On the user side, the TAPAS corrections are applied in the positioning process of a GNSS receiver. To make full use of the TAPAS data, user equipment should be capable of tracking carrier-phase-based GNSS data and applying the TAPAS correction data supplied in the RTCM version 3.x format.

    An example of a use of TAPAS is provided in the photo in Figure 9 below where the authors of this article tested the position accuracy of TAPAS for a typical land surveying task, using a Septentrio Altus APS3G receiver with an allegro2 controller unit for RTK positioning. The user’s GNSS equipment can, however, be many other different types and makes of GNSS antennas and receivers, and the equipment can be installed on many different platforms for instance in vehicles, on drones, in robots etc.

    Geodetic Basis

    When determining positions with uncertainties at the 1-cm level, it is important to be aware of the geodetic reference frame used for the positioning. In this case, coordinates for the TAPAS stations have been estimated by DTU Space, using Bernese GNSS software, in the national Danish reference frame which is a realization of the European Terrestrial Reference System (ETRS).

    When applying corrections from the TAPAS caster in the positioning calculations at the user side, positions will be obtained within the same reference frame (coordinate system). In this case, where the national geodetic reference frame is used, this means that the user will obtain positions compliant with maps, charts and other types of geodata geo-referenced in the same coordinate system.

    For 3D positioning, the Danish geoid model must be applied on the user side to obtain heights relative to mean sea level in the national Danish Vertical Reference (DVR90).

    It is possible to configure the setup of the central processing facility using another reference frame for TAPAS given that precise coordinates for the TAPAS stations can be provided in the given reference frame. Future work with TAPAS can involve the use of dynamic geodetic reference frames and transmission of coordinate transformation parameters to the users.

    Performance Testing

    After the stations were installed, DTU Space conducted performance testing, including testing data communication between the TAPAS stations and the TAPAS server, analyses of data completeness from the TAPAS stations, and field tests carried out after the network RTK processing had become sufficiently stable.

    Performance test in static mode. In February 2019, a static mode test took place in a park-like area within the three innermost stations. Two different high-accuracy survey-grade RTK-receivers were used for the field test. RTK positions were estimated at 1 Hz for 30 minutes. For each minute, an average position was calculated based on the 60 observations, and for each of the minute-bins the standard deviation with respect to the reference position was computed.

    Test location indicated with purple circle in the network plot. (Image: DTU Space)
    Test location indicated with purple circle in the network plot. (Image: DTU Space)
    Altus APS3G unit mounted at the test location. (Photo: DTU Space)
    Altus APS3G unit mounted at the test location. (Photo: DTU Space)

    The results are shown in the plots below, where standard deviations are provided for each epoch (i.e., for each bin of 60 seconds).

    Standard deviation in meter for each 60 second with GNSS receiver Altus NR3 (left) and Altus APS3G (right). Results provided in meter. (Images: DTU Space)
    Standard deviation in meter for each 60 second with GNSS receiver Altus NR3 (left) and Altus APS3G (right). Results provided in meter. (Images: DTU Space)

    In the plots, results are provided for the vertical (red), the horizontal (blue) and the 3D position (green). Results of using the two different receivers are comparable, and focusing on the 3D solutions the largest standard deviation is 1.6 cm which is for the fourth epoch with receiver APS3G. Most of the 3D results shown in the plots are better than 1 cm.

    The same test was carried out using a dual-frequency non-survey-grade receiver developed for machine control and autonomous vehicle applications. This receiver was connected to the same antenna mounted on a tripod. Results of using this receiver in static mode are shown in the plot below. In this case, the 3D results are all better than 3.1 cm, and many of the 3D results are better than 1 cm in this open test area.

    Standard deviation for each 60 second with GNSS receiver u-blox F9P dual frequency (DF). Results provided in meter. (Image: DTU Space)
    Standard deviation for each 60 second with GNSS receiver u-blox F9P dual frequency (DF). Results provided in meter. (Image: DTU Space)

    Performance test in kinematic mode. In the same area used for the static test, a kinematic test was carried out with the same three receivers.

    The test was performed using a camera dolly and by placing approximately 10 m of rail on the ground. The camera dolly was pulled back and forth along the rail, a setup that provided a stable trajectory for testing positioning performance while the GNSS antennas were moved slowly and smoothly. A rigid bench, where the GNSS antennas could be mounted, was constructed and installed on the dolly. The three GNSS receivers with antennas were mounted on the bench, and the dolly was pulled back and forth along the tracks 10 times.

    Kinematic Test: Camera dolly with GNSS equipment pulled along tracks. (Photo: DTU Space)
    Kinematic Test: Camera dolly with GNSS equipment pulled along tracks. (Photo: DTU Space)

    For each 1-meter section of track, the standard deviation of the differences with respect to the reference trajectory of the 10 repetitions was calculated. Results for the two survey-grade receivers are shown in the plots in Figure 3. All of the 3D standard deviations are better than 1 cm for both survey-grade receivers.

    Figure 3. Kinematic test results are provided for the vertical (red), horizontal (blue) and 3D (green) positions. (Image: DTU Space)
    Figure 3. Kinematic test results are provided for the vertical (red), horizontal (blue) and 3D (green) positions. (Image: DTU Space)

    The non-survey-grade dual-frequency receiver also was mounted on the test bench, and the results of using this receiver are shown in the plot below. With this receiver, the 3D results are below 2.1 cm for all sections of the trajectory, except for the first meter, a deviation that may have been caused by issues with initialization of the test.

    Binned standard deviation of 10 repetitions with GNSS receiver u-blox F9P dual frequency (DF). Results provided in meter. (Image: DTU Space)
    Binned standard deviation of 10 repetitions with GNSS receiver u-blox F9P dual frequency (DF). Results provided in meter. (Image: DTU Space)

    These tests show that it is possible when using TAPAS to obtain position solutions at the cm-level in open areas in both static and kinematic mode.

    Performance test in dynamic mode. In November 2019, DTU Space carried out a performance test of TAPAS in dynamic mode, using a car with roof-mounted GNSS equipment. The car was driven within the TAPAS coverage area, passing through urban canyons, open streets and the harbor area. During the test, the car drove in normal Aarhus traffic, at speeds varying from zero at traffic lights up to 60 km/h on the wider roads leading into the city center.

    Four different receivers were strapped in the car and connected to either a small patch antenna or a survey-grade antenna mounted on the roof. A survey-grade receiver was mounted on the roof.

    Three different GNSS antennas mounted on the roof of the car used for dynamic testing. (Photo: DTU Space)
    Three different GNSS antennas mounted on the roof of the car used for dynamic testing. (Photo: DTU Space)

    Data from the receiver was converted to KML files, which can be used with Google Earth to illustrate the quality of the positioning obtained during the drives through the city. The plot in Figure 4 shows the quality of the position solution. The best quality is obtained when the ambiguities are fixed, such as an RTK fixed solution at the cm level (green). The second-best quality is with ambiguities estimated to float values, such as an RTK float solution at the dm level (purple). Orange shows differential position solutions at the meter level when corrections for the carrier-phase data have not been obtained. Finally, a few positions were stand-alone GNSS solutions when no aiding from TAPAS was applied in the roving GNSS receiver (blue).

    Figure 4. Quality of RTK positions obtained during one drive through the City of Aarhus. (Map data: Google, TerraMetrics)Photo:
    Figure 4. Quality of RTK positions obtained during one drive through the City of Aarhus. (Map data: Google, TerraMetrics)Photo:

    The plot clearly shows, as expected, that the quality of the positions determined by the survey-grade receiver in the car is good most of the time. But it suffers in areas with narrow streets aligned with buildings or trees.

    These results do not tell the actual uncertainty of the position solutions. But GNSS carrier-phase data collected with one of the receivers in the car during the drive will be post processed to serve as a reference trajectory. Upcoming analyses of the data will then reveal the uncertainty of the positions determined in real time as compared to the post-processed reference trajectory.

    Test Conclusion. After the field tests, we conclude that the TAPAS testbed is able to provide correction data that makes it possible to perform GNSS-based positioning in real time in both static and dynamic mode with position uncertainties at the cm-level. Further, as we analyze the test data thoroughly, TAPAS will be able to set a tone for new research. For instance, the plot in Figure 4 provides a foundation for testing assistance procedures to gain better coverage in the most densely built areas. In this way, TAPAS will aid research into feasible infrastructure for the technologies of tomorrow, such as autonomous driving.

    Outlook and Future Work

    Because TAPAS is not commercial, it is possible, upon agreement with the SDFE, to make changes to the system to adapt to specific testing or development needs. Examples are removing data from some stations in the estimation of RTK correction data, installing an extra receiver in one or more stations using the antenna splitters, or making changes to the settings in data processing on the TAPAS server for shorter time intervals.

    At DTU Space, plans for the testbed include further development of software for ionosphere and integrity monitoring. The station receivers can estimate total electron content (TEC) along the GNSS signal path in Earth’s atmosphere, as well as indices for ionospheric scintillation. DTU Space is researching using this output for an ionosphere monitoring service and to develop it into an integrity monitoring service for GNSS users.

    Upcoming additions to the RTCM data format will support more advanced modeling of the effects of the ionosphere and troposphere, and this will allow for full benefit of the TAPAS SSR network corrections. Research on such models to be applied on the server side, as well as on the user side, will be carried out by DTU Space and tested with TAPAS as a contribution towards the integration, or hybridising, of PPP and RTK. This is also referred to as PPP-RTK positioning which is expected to be especially useful for mass market applications such as autonomous driving. When implemented in TAPAS, such solution may effectively increase the number of simultaneous users as well as use-cases for TAPAS.

    TAPAS provides many opportunities for testing precision or high-accuracy applications, such as autonomous vehicles, vessels, drones and robots; location-based services requiring high accuracy on various digital platforms; and solutions for a more digitized and intelligent city environment through smart-city and green mobility initiatives.

    TAPAS is prepared for the implementation of the coming 5G technologies, and station intercommunication capabilities enable testing of internet of things (IoT) technologies where precision positioning is part of the development. The testbed also provides an excellent environment for validation of new services such as the Galileo High Accuracy Service (HAS). Another area in which TAPAS can play an important role is verification and validation of future 5G-based positioning services.

    For more on TAPAS, visit www.tapasweb.dk/english.

    Acknowledgments

    The TAPAS testbed was developed with close cooperation between DTU Space and SDFE. SDFE contributors include Kristian Keller, Casper Jepsen, Henrik Olsen, Martin Skjold Grøntved, Brigitte Rosenkranz, Maria Rask Mylius and Søren Fauerholm Christensen. DTU Space contributers include Ole Bjerregaard Hansen, Finn Bo Madsen, Lars Stenseng, Daniel Haugård Olesen, Stefan Emil Steffensen, Thor Heine Snedker, Per Knudsen and Niels Andersen.

    Manufacturers

    The GNSS receivers at the TAPAS stations are Septentrio PolaRx5S, and the antennas are Leica AR20. For field testing, a Septentrio Altus NR3 receiver, a Septentrio Altus APS3G receiver and a u-blox ZED F9P dual-frequency receiver were used. The TAPAS station cabinets were assembled and mounted by Nordtec-Optomatic A/S. The TAPAS testbed software solution is based on the GNSMART 2 software package from Geo++ GmbH. Data analyses and processing has been carried out using the Septentrio SBF Analyser and SBF Converter, the RTKlib and the Bernese GNSS software.


    Anna B. O. Jensen is senior advisor and team lead of the GNSS group at DTU Space in Denmark. She is also a part-time professor at KTH Royal Institute of Technology in Sweden.

    Per Lundahl Thomsen is a chief consultant at DTU Space. He has many years of experience with management of space technology projects and is project manager for the TAPAS testbed.

    Søren Skaarup Larsen is a Ph.D. student at DTU Space. Along with his GNSS studies, he runs the RTK-part of the TAPAS testbed.

  • Position: 20 Kilometers, Heavy Construction

    World’s Longest Immersed Tunnel, 40 Meters Underwater

    By Anna Jensen, Dirk Hermsmeyer, Bastian Huck, Jürgen Rüffer, and Peter Skjellerup

    The Fehmarnbelt Positioning System between Denmark and Germany includes a geodetic basis, four permanent GNSS stations, and a real-time kinematic (RTK) service for construction of a road and rail causeway between the islands of Fehmarn, Germany, and Lolland, Denmark, across the Fehmarnbelt, a 20-kilometer stretch of open water in the Baltic Sea. This homogeneous, consistent, coherent, highly accurate GNSS-based positioning system exemplifies comparable systems and services that can be established for any major construction site or infrastructure project. Now in use for environmental, geotechnical, and geophysical investigations, it provides cost-efficient operations and facilitates the precise navigation of large, costly offshore equipment.


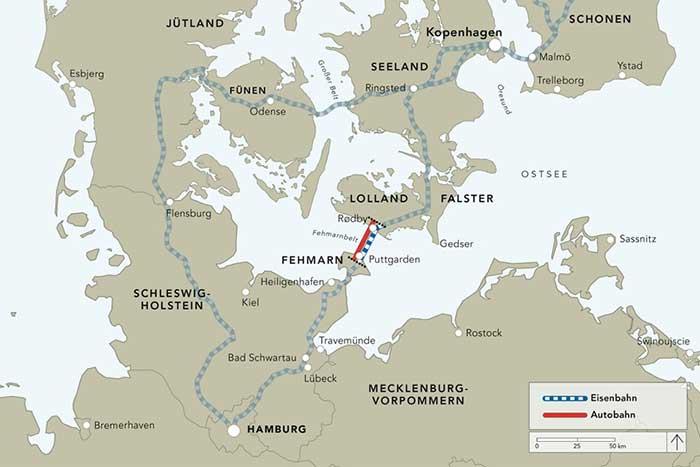
    A fixed road-and-rail link across the Fehmarnbelt body of water in the Baltic Sea will by 2020 connect the German island of Fehmarn and the Danish island of Lolland. It will provide a critical time- and cost-efficient trade and traffic link between north-central Europe and Scandinavia.

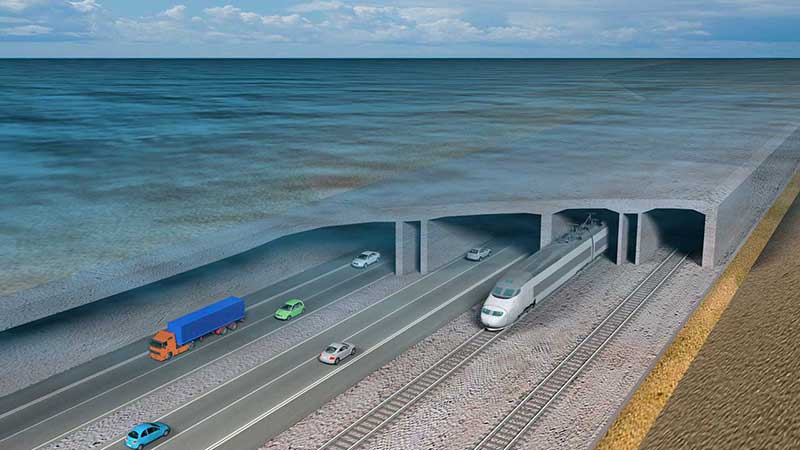
    Geophysical and geotechnical pre-investigations have been completed as well as an environmental assessment of the fixed link. Initially proposed as either a bridge or a tunnel (Figure 1), an immersed tunnel is now the preferred solution. It will be placed in a trench excavated on the sea floor, and covered with a layer of stones. It will be the longest immersed tunnel in the world at 17.6 kilometers, excluding peninsulas on both sides to be constructed for easier entrance to the tunnel. The strait is 20 kilometers wide at the site. The immersed depth is up to 40 meters.

    During planning and construction of the fixed link, it is very important to be able to perform reliable positioning with high accuracy. This requires a well defined geodetic basis — a 3D reference system and a reference frame for GNSS positioning, a height system and a geoid model for working with heights, and a map projection for plane maps and drawings. The ability to determine positions with high accuracy in real time within the project area is also very important. Therefore a carrier phase-based GNSS positioning service, a real-time kinematic (RTK) service, has been established.

    Altogether, we refer to the geodetic basis and the RTK service as the Fehmarnbelt Positioning System (FBPS), and the geodetic basis as the Fehmarnbelt Coordinate System (FCS). In this article we describe the geodetic basis and the RTK service, including four new permanent GNSS stations established for the purpose.

    Geodetic Reference Frame

    The reference system for the FCS is the International Terrestrial Reference System, realized by the ITRF2005, the newest and to date most accurate realization of the ITRS.

    Four permanent GNSS stations were established around Fehmarnbelt during the autumn and winter of 2009/2010: two on Fehmarn and two on Lolland (Figure 2).

    After establishment of the GNSS stations, seven days of GNSS data were collected in February 2010. Coordinates for the stations were determined by the National Survey and Cadastre-Denmark, using the Bernese GPS software. Data from six GNSS stations of the network of the International GNSS Service (IGS) was included in the data processing, and these stations with coordinates in the ITRF2005 were used as reference stations. Hereby, the ITRF2005 was introduced in the Fehmarnbelt area, and a reference frame for positioning in three dimensions has been established.

    Height System and Map Projection

    The height difference between Germany and Denmark is known from a 1987 hydrostatic levelling between Puttgarden and Rødbyhavn. For the Fehmarnbelt Fixed Link, precise levelling has been carried out between the connecting points of the hydrostatic levelling and stable point groups further inland. Levelling points with a large displacement since 1987 were eliminated, and the hydrostatic levelling was then used for transfer of the height difference between Germany and Denmark.

    The next step was determination of present mean sea level (MSL) in the Fehmarnbelt and establishment of a project-specific height system with the zero-level as close as possible to the actual MSL of Fehmarnbelt. In this area of the Baltic Sea, a slow rise of MSL relative to the neighboring land is taking place, and therefore water-level data from Heiligenhafen on the German mainland, and from Puttgarden and Rødbyhavn, was analyzed in cooperation with the Danish National Survey and Cadastre and the Danish National Space Institute.

    Analyses of the last 20 years of water-level data show an increase in the water level of approximately 2 millimeters per year at Rødbyhavn. Data from Heiligenhafen was also analyzed; as Heiligenhafen is not directly adjacent to the site, the time series was not used directly for establishing the MSL datum but instead used as an independent control.

    Water-level data was used for estimation of the present MSL in Fehmarnbelt, and the zero level for the FCS Vertical Reference 2010 (FCSVR10) coincides with MSL at Rødbyhavn in 2010. The zero level of FCSVR10 thus deviates from both the German and the Danish height systems.

    The Danish National Survey and Cadastre conducted precise levelling to determine FCSVR10 heights to the four new permanent GNSS stations, and determined FCSVR10 heights to a number of existing height benchmarks on Fehmarn and Lolland. Local land uplift on Fehmarn and Lolland causes differences between the FCSVR10, the national German DHHN92 height system, and the national Danish Vertical Reference 1990 height system. Differences between the height systems are not constant values but vary within the area, so it is very important to use the geoid models when converting heights for high-accuracy applications.

    To determine heights relative to MSL with GNSS it is necessary to utilize a geoid model. The Danish National Space Institute performed new gravity readings to supplement the existing gravity database. Then all existing gravity data from the area was used for development of a local geoid model for the Fehmarnbelt. The geoid model is fitted to the height system FCSVR10 and to the ITRF2005 by the four new permanent GNSS stations, and the model can be used for conversion between MSL heights and ellipsoidal heights.

    The last item of the geodetic basis is the definition of a map projection, using a transverse Mercator projection. The projection is fitted to the area to obtain a scale factor as small as possible within the construction area. Also, a false Easting value was chosen to provide FCS Easting values within the construction area which are different from Easting values of the ITM, UTM, or Gauss-Krüger projections used in Germany and Denmark. Table 1 gives the defining parameters for the map projection.


    Permanent GNSS Stations

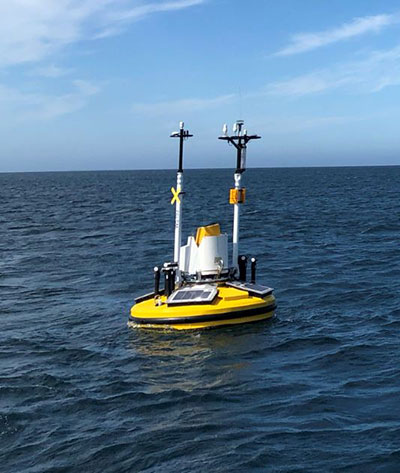
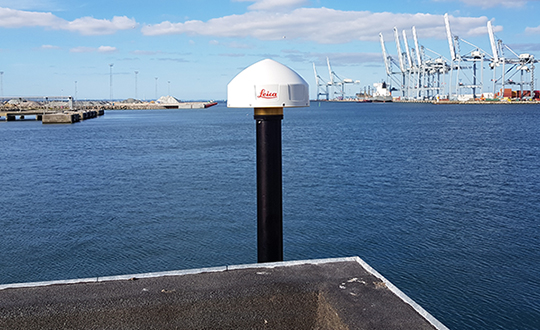
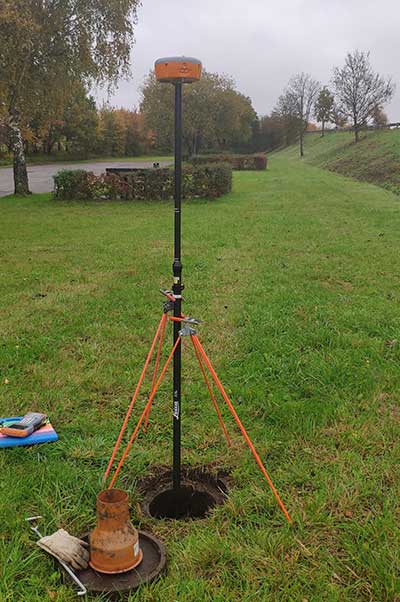
    The four permanent GNSS stations are established as geodetic-grade stations, as shown in the photo. Individually calibrated GNSS choke ring antennae are mounted on 3-meter tall concrete pillars, with foundations 3 meters into the ground at stations 1, 2, and 4, with predominantly silty glacial till of stiff consistency at about 0.70 (stations 1 and 2) and 1.70 meters (station 4) below soil surface. At station 3, foundations for the antenna monument are built 9 meters into the ground. Soil conditions are sandy at this location to about 7 meters below soil surface, where stiff glacial till is met. In geotechnical investigations and analyses carried out before establishment of the GNSS stations, the glacial till at the station locations was rated as a good to very good foundation ground, with little tendency to settlement.

    The concrete antenna monuments are surrounded with about 0.30 meters of styrofoam for thermal insulation. The monument head is bevelled with an angle of 30° from vertical, reflecting GNSS satellite signals striking the monument head underneath the antenna away from it, to further minimize signal multipath effects.

    The GNSS reference station receivers are capable of processing GPS and GLONASS L1 and L2, GPS L5, and Galileo E1, E5a, E5b, and Alt-BOC frequency band signals. Galileo signals can be processed when Galileo satellites are available; a firmware update on the receivers will be required. In view of the long-term demand for the FBPS (until 2020 or longer), its compatibility with Galileo signals in particular makes the system future-proof.

    GNSS reference station receivers, access points to power grids, and uninterruptible power supply are mounted in cabinets adjacent to the antenna pillars. Additional equipment in each cabinet comprises an industrial PC, Internet router, GSM/UMTS router, satellite communication equipment, transmitting and receiving radio modems, and a heat exchanger to cool the in-cabin room if required.

    At each station, a radio mast of about 10 meters height carries a satellite dish for wireless Internet access, and a Yagi antenna to broadcast GNSS correction data into the proposed construction area in the Fehmarnbelt. Radio masts are located directly north of the GNSS antennae.

    RTK Service

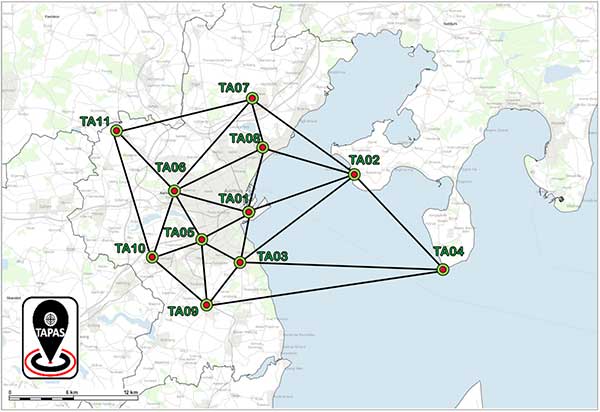
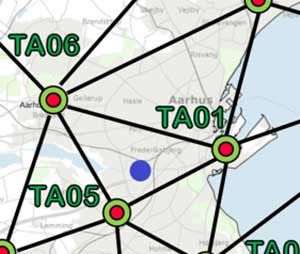
    To ensure accurate GNSS positioning, an RTK GNSS service has been established, based on GNSS data from the four new permanent GNSS stations (primary stations) as well as four GNSS stations located further away in Germany and Denmark (secondary stations), which existed previous to our work. Figure 3 shows the locations of the eight stations used for the RTK service. The stations relay GNSS data to the control center, which derives and transmits RTK correction data to surveyors in the project area with RTK rovers.

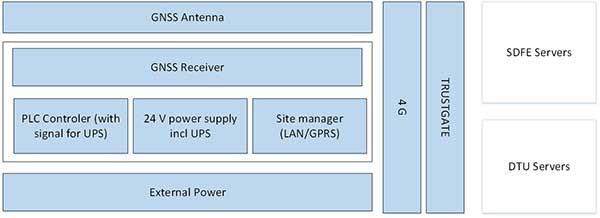
    The RTK service has been developed with focus on robustness, with two control centers at different addresses in Germany. Three different communication carriers provide data communication between the GNSS stations and the control centers, and RTK correction data is distributed to users in two different ways, via ultra-high frequency (UHF) radio and mobile Internet. Figure 4 shows the communication lines of the RTK service.

    FBPS RTK users who wish to receive RTK corrections via UHF radio require a UHF radio modem and antenna, in addition to an RTK rover. The four primary GNSS stations broadcast RTK correction data on four separate radio frequencies. By switching their radio modem to one of the frequencies, users receive the correction signal from the control center via the respective station. RTK corrections via UHF radio can be used where radio signals from one of the four primary GNSS stations can be received.

    From the users’ point of view an advantage of using UHF radio over using a mobile Internet connection is that the UHF connection is free-of-charge and can be collected from four different sources.

    Users who wish to receive RTK corrections via mobile Internet must connect via General Packet Radio Service (GPRS) and require a GPRS modem, antenna, and a subscriber identity module (SIM-card) in addition to their RTK rover. GPRS connections will be charged according to tariffs of the respective mobile phone network provider.

    Figure 5 shows areas of signal coverage. Areas 1 and 2 are covered by UHF radio and mobile Internet. Area 3 is covered by mobile Internet.

    The FBPS RTK service generates and broadcasts RTK corrections in two different modes: master-auxiliary corrections (MAX) mode, and virtual reference station (VRS) mode. MAX and VRS are two different calculation methods to generate RTK corrections in a standard format defined by the Radio Technical Commission for Maritime Services (the RTCM format). The version used for the FBPS RTK service is the RTCM version 3.1.

    With MAX corrections, the RTK rover does not send its position to the reference network software. The GNSMART reference network software calculates and sends MAX corrections to the rover. These contain the measurements from a master station and correction data from the auxiliary reference stations. The rover individualizes the corrections for its position, which means it determines the best suitable RTK corrections. RTK data in MAX mode can be received by users of RTK rovers via both possible types of connection, UHF radio and GPRS.

    With the VRS concept, the user’s RTK rover transmits its approximate position to the control centre, which returns to the rover observations or corrections of an individual VRS near the user’s position. Data is transmitted back and forth between the RTK rover and the control center. Therefore a two-way communication link must be established with VRS. Because the UHF radio connection is one-way, GNSS correction data in VRS mode can be received via digital cellular phone (GPRS) only. For data transmission via GPRS, the FBPS RTK service uses the networked transport of RTCM via Internet protocol (NTRIP).

    Multiple RTK rovers (that is, multiple users) can receive RTK corrections from the FBPS simultaneously with any of the connections described above, while every user may select his or her favourite connection type. The RTK service can be used with any commercially available geodetic GNSS receiver that is capable of processing RTK data.

    System Test and Results

    The RTK service was established during the spring of 2010 and was run in test mode May 12–July 31 to test system accuracy, signal coverage area, and signal availability.

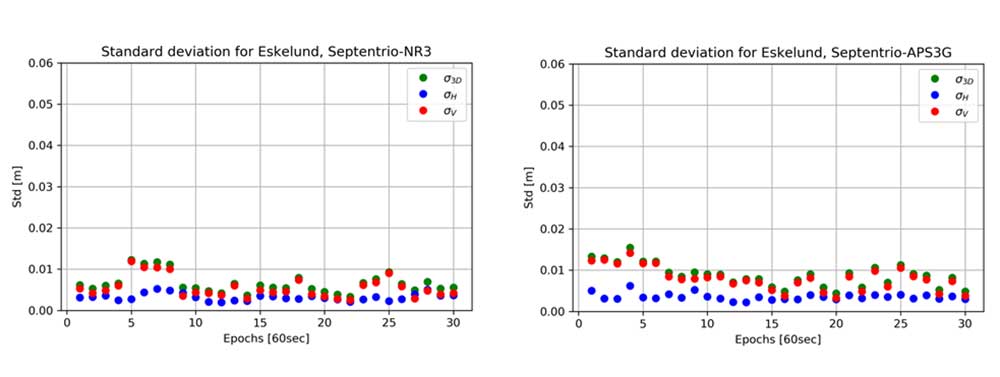
    Accuracy. An error budget of the RTK service is provided including all known error sources and latencies in the system, and a description of how these errors are handled. The accuracy obtainable by end users is better than 1.0 centimeters in the horizontal and better than 1.8 centimeters in the vertical. Values are provided as one sigma, and are valid during normal ionospheric activity. Applying an RTK rover and RTK corrections received from the FBPS RTK service, users inside the coverage area can determine the coordinates of a marked survey point repeatedly with these accuracies.

    System inspection is carried out monthly. Part of monthly inspection is the visit of marked control points with an RTK rover. ISO 17123-8:2007 (ANSI, 2007) standard procedures are applied to determine control point coordinates.

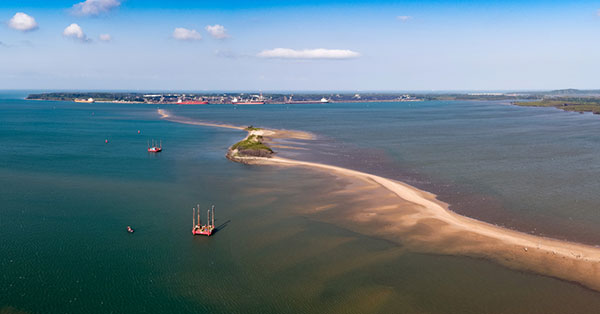
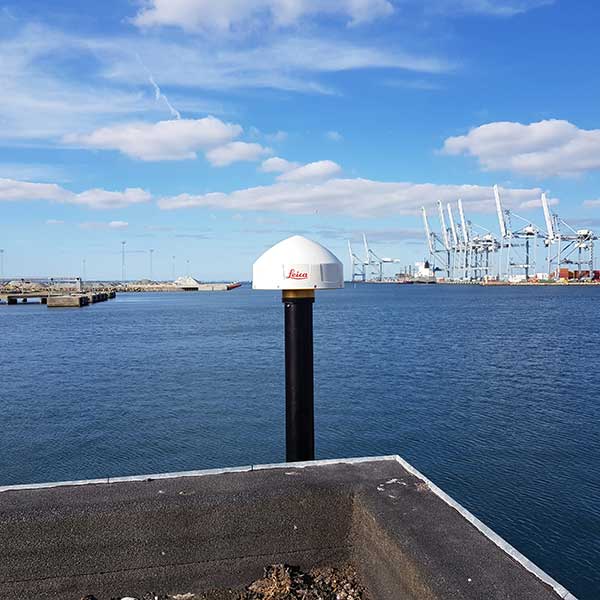
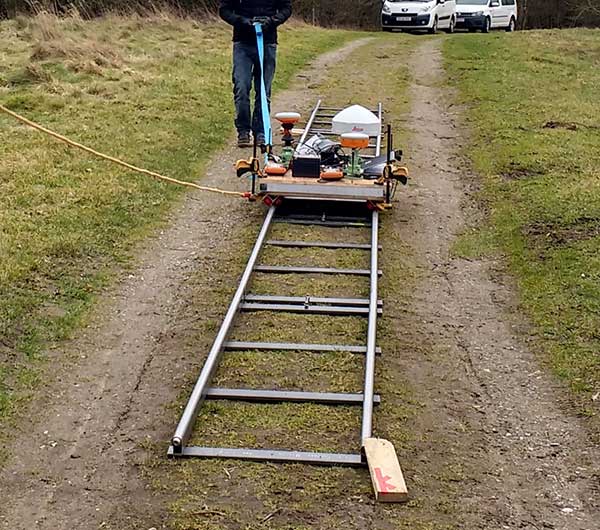
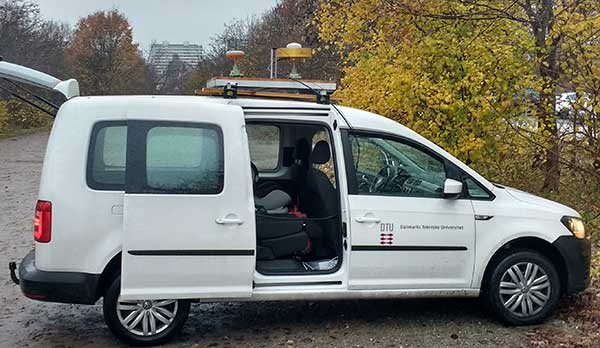
    Coverage Area. The RTK service coverage area shown in Figure 5 is defined as the geographic area where the described accuracy can be obtained for end users at any time. Test measurements of UHF radio signal strengths from the four primary GNSS stations have been carried out onshore Lolland and Fehmarn, as well as offshore across the Fehmarnbelt (see photo). Modelled UHF radio signal broadcasting areas are closely verified during these tests.

    Availability. The positioning system and the RTK service are designed using necessary technology, redundancy, and back-up to ensure that the system is operational and available in the entire coverage area for more than 99 percent of the time. Availability is defined as the time where all elements of the positioning system are available for end users and where the described accuracy can be obtained for all users within the coverage area. Availability is evaluated in percent of time per day: the system must be available for at least 23 hours and 45 minutes per day. During the first year of operation it is accepted that RTK correction data from the system are available to end users for 97 percent of the time or more per day.

    A control segment has been established to constantly monitor RTK service accuracy and the availability of the system. The control segment is installed in such a way that all relevant output and data streams from the GNSS stations are available through the system’s website.

    Evaluation of availability is carried out automatically by the control segment, and an overall evaluation of availability is performed every month. Results from evaluation of availability during the test operation are listed in Table 2. During test operation, the required availability of 97 percent per day during the first year of operation was reached on all days. Availability only fell below 99 percent, as is the required availability during following years, for 5 out of 81 days (5.6 percent) of the test period.

    Conclusions and Outlook

    System tests results regarding accuracy, coverage area, and availability show that the positioning system and the RTK service fulfil all specifiecation requirements.The first RTK user was registered in July 2010, and the complete system is now being used for environmental, geotechnical, and geophysical investigations.

    User benefits of the FBPS include:

    • ensured consistent and uniform geodetic reference throughout the planning, construction and operation phases of the Fehmarnbelt Fixed Link, available to all stakeholders at any time;
    • seamless, real-time data flow from the point measurement at the construction site into computer-aided design (CAD) or geographic information systems (GIS);
    • simplified geodata transfer across interfaces between project stakeholders and project phases;
    • cost efficiency, reducing costs in both surveying and data management, particularly in precise operation of large, expensive offshore equipment, including during critical procedures in the construction phase.

    The positioning system for the Fehmarnbelt Fixed Link is an example of a homogeneous, consistent, coherent, and highly accurate GNSS-based positioning system. Comparable systems and services can be established and used for any major construction site or infrastructure project.

    Acknowledgments

    This work is funded by Femern A/S. The authors acknowledge contributions from the National Survey and Cadastre, Denmark, Danish National Space Institute, Land Survey Office of Schleswig-Holstein in Germany, German Federal Agency for Cartography and Geodesy, Richter Deformationsmesstechnik GmbH, Günther Steimann, and Ohms Nachtigall Engineering GbR. Also Mr. and Ms. Thomsen, Stadt Fehmarn, Mr. Henriksen, and Mr. Boserup for permitting establishment of FBPS GNSS stations on their property.

    Establishment, operation and maintenance of the GNSS stations and RTK service was entrusted by Femern A/S to AXIO-NET GmbH, with ALLSAT as subcontractor for implementation of the four GNSS stations (both companies in Hannover, Germany). Ramboll Arup JV was entrusted by Femern A/S with project coordination and geodetic consultancy, using AJ Geomatics as subcontractor. More information about the fixed link is available, and more on the RTK service.

    Manufacturers

    The RTK service is based on GNSMART software (GEO++ GmbH). The permanent GNSS stations are equipped with Leica Geosystems AR25 antennas and GRX1200+ receivers.


    Anna Jensen is owner and CEO of AJ Geomatics in Denmark. She holds a Ph.D. in geodesy and has worked with research and development within GNSS and geodesy for more than 15 years.

    Dirk Hermsmeyer holds a Ph.D. from the University of Hannover, and is a project management professional. He previously worked at ALLSAT and is now with the Chamber of Commerce in Lübeck, Germany.

    Bastian Huck is head of operations and quality management with AXIO-NET. He is a university-level geodesist and certificated project management practitioner with 10 years of experience in RTK projects.

    Jürgen Rüffer is co-owner and CEO of ALLSAT and AXIO-NET. He is a university-level geodesist, a publicly certified expert for GNSS positioning at the chamber of engineers in Germany, working with GPS and GNSS since 1977.

    Peter Skjellerup is chief advisor on geotechnology with Ramboll Denmark. He has worked with ground engineering for many years, and holds a M.Sc. in physics-geophysics from the University of Copenhagen.


    Note from author Anna Jensen (2/27/13):

    “Since publication of the article, the opening year for the Fehmarnbelt tunnel has been changed to 2021.”