This month I am writing to you from Munich, where I have just attended the Munich Satellite Navigation Conference. I have written up the full Summit proceedings for GPS World’s new European GNSS & Earth Obersvation Report (EAGER) newsletter. You can read that (much longer) column here and while you’re at it, sign up for the new quarterly newsletter. What follows is an excerpt of it, specially focused on professional GNSS OEM interests.
I used to spend quite a lot of time in Munich working on a multi-national, multi-role fighter aircraft program, so returning for this year’s Munich Satellite Navigation Summit stirred some good memories for me. Held in the opulent Residenz Muenchen March 25-27, the conference always has a special atmosphere that these historic 1385 surroundings convey to the attendees.

Munich is in the Southern German state of Bavaria, and Bavaria has taken a real interest in the promotion and success of Galileo; witness the extensive Bavarian booth at recent European and North American GNSS conferences. Germany has, of course, been one of the principle nations providing significant funding for Galileo from its inception.
So with this backdrop, the summit brings together people involved with GNSS from around the world to report on the current status of GNSS and to relate how their participation in satellite navigation has progressed. And, of course, Europe, Germany, Bavaria and the European GNSS industry, which is now recognized around the world, all take the opportunity to present their capabilities and successes.
The first day’s session contained constellation updates from GPS, Galileo, Beidou and the UN International Committee on GNSS (ICG) — GLONASS delegates were notably absent. There was much speculation that they declined to attend due to the Crimean situation, and one U.S. delegate even inferred that they were “uninvited.” For the constellation updates, see the longer article referenced above.
Munich Highlights
A collection of examples of Bavarian GNSS innovations followed in a very interesting session led off by an overview of Business Incubation Centers and their collaboration with government agencies and research centers. Small business start-ups are apparently encouraged to apply during four annual time-slots, and receive two years’ incubation support and cash incentives. This has lead to 81 new ventures and has apparently been the source of the 1,000 new jobs mentioned by the Minister of Economic Affairs. The annual European Satellite Navigation Competition and Galileo Masters competition have also generated a whole bunch of ideas and concepts (8,000), some of which have found support through this incubation process.
Airbus Defence gave a short overview of the testing work it accomplished in supporting the first Galileo fix and has prepared several vehicle test platforms, ready to take the next phase of Galileo testing to the streets in realistic, real-world environments.
DLR provided insights into a number of its activities, namely:
- Iono mapping
- Signal distortion
- Multipath
- Jammer mitigation – adaptive antenna and processing
- GNSS repeaters – how they can become unintentional jammers
- Spoofer and Multipath inbvestigations
- Antenna designs
- GNSS evolution – Maser and clock combination benefits

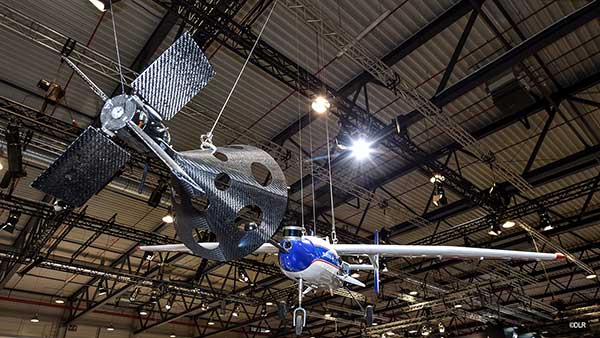
Army University of Munich discussed radio science experiments in the Solar System and experiments using Mars Express (above) in polar orbit around Mars and resulting measurements of the moon Phobos. Internal and external outreach efforts with numerous organizations were also mentioned.
IFEN provided more down-to-Earth information on the on-going activities at the GATE ground-based pseudolite range, which has enabled realistic outdoors testing of Galileo receivers, well in advance of signals from orbiting satellites. Recent testing has now been able to include the four operating Galileo SVs on orbit with GATE pseudolite signals. GATE will continue to evolve over the next few years to keep up as more Galileo orbital signals come on-line.

Fraunhofer presented information on its 40-channel GPS/Galileo/GLONASS chip-receiver (above) – claiming 1-meter accuracy, low-cost, robust reliable position solution, small form-factor and low-power. Following PRS test-bed development efforts, Fraunhofer has now received a contract to also deliver 20 pre-operational Galileo PRS receivers for use in initial pilot projects.
GNSS Interference
Vidal Ashkenazi, in his inimitable form, lead a panel discussion on interference, jamming (in particular Personal Privacy Devices, or PPD) and spoofing, and coaxed his panel members to provide a whole bunch of information on what’s being done, mitigation capabilities and potential enforcement. Unlike all the other sessions, Vidal’s panel members didn’t use presentations, but rather responded to wide-ranging questions on the subject from the session chair. For a complete view of this, as well as a subsequent session on “Legal Impacts of Personal Privacy Devices (PPDs),” see the EAGER newsletter column.
Precise Point Positioning (PPP)
The group discussing PPP options consisted of the the European GNSS Agency (GSA, charged with exploitation of Galileo services), several principle industry service providers of PPP, and the federal agency, which provides PPP-like services in Germany.
The GSA presented its ideas concerning the provision of high-accuracy PPP corrections over the Galileo E6 signal – the so-called Commercial Service (CS). The intent, however, would not be to disrupt the commercial marketplace. Nevertheless, GSA is proposing a public-funded service to be sold to users within a market that is already well served by commercial worldwide service providers who charge users for cm-level PPP service.
And while Trimble made a polite presentation on the many levels of capabilities of its TerraSat services, as did Veripos and to some extent Fugro, it was clear that the commercial providers are not eager to find competition in their market from a government entity. NovAtel also chimed in on this conflict as it will be involved in Veripos/TerraStar, following its acquisition by Hexagon. Fugro appeared to be interested in acquiring rights to distribute CS on behalf of GSA.
The German federal agency promoted open data, source and standards from the IGS network to which it contributes: IGS is supported by numerous national agencies around the world. Orbit and clock PPP service is available 24/7 from multiple sources. However, the service is offered on a best efforts basis without a service guarantee, and cannot achieve the accuracies or convergence times of commercial services.
I talked subsequently with Michael Ritter, CEO of NovAtel, to learn the background to the Veripos/TerraStar acquisition. It’s clear that providing PPP services means added value to NovAtel when they sell receivers with PPP capability, so they will quickly discontinue offering Omnistar subscriptions and will shortly launch NovAtel Correct, offering Veripos (marine) and TerraStar (land) PPP subscription services. NovAtel is making significant inroads in the agriculture segment, and they see PPP service as an essential element of this and other businesses. The acquisition was worth something on the order of $200 million, so there is a vested interest in making these services pay and discouraging GSA entry into this market. Veripos will continue supplying other GNSS OEM receiver manufacturers — notably Septentrio, who use TerraStar services, now also NovAtel, and potentially another major GNSS manufacturer.
Future of GNSS in User Segment
Chaired by Greg Turetzky of Intel, this session opened the third day of the Summit. The presenters offered their concepts for current and future GNSS equipment and systems.
Stanford University outlined its work with FAA on an alternate PNT system to be used as a back-up to GNSS. It used to be that GNSS systems were designed to overcome space-weather effects and faults in equipment design or manufacture — nowadays, there are “bad guys” out there and we need to “protect, toughen and augment” these systems. Antennas can be built that impart a specific signature to the signals they transmit, and this may aid in finding and prosecuting the bad guys, but the main focus of work is development of a hybrid system using Distance Measuring Equipment (DME) and a pseudolite.

Tests have demonstrated good performance, and these prototype efforts could lead to aviation requirements (MOPS) development by 2018 and deployment by 2020.
Septentrio has been involved in Galileo since it began and was the first company with Galileo receivers. Nowadays, they have receivers fielded in multiple commercial applications, including machine control, maritime, aviation, automation, and measurement, delivering accuracies from a meter down to a centimeter. They will add E6 to their AsteRx family of multiple-channel, multi-frequency, multi-constellation receivers, and have developed a number of hardware and software mitigation techniques to combat jamming, interference and multipath, and to integrate receivers with inertial units for aiding.
Furuno is interested in resilient PNT for marine applications, and has examined the use of eLoran as an alternative to GPS, but has moved towards a system of radar beacons that detect radar pulses from passing ships and transmit their positions, enabling position determination. In tests, accuracies of around 2 meters have been obtained with two beacons.
Quascom’s approach is to add firewalls inside receivers, which toughen the processing and prevent distortion of position information. Quascom believes this will be necessary until authentication can be added into the GNSS system itself, so that any data received is validated and is known to be good.
Chris Rizos from the University of New South Wales, Australia, drew attention to the “holes” that exist in GNSS, and reviewed a number of possible “Band-Aid” fixes, such as Wi-Fi especially for indoor location. However, his solution seems to be to establish terrestrial networks transmitting GNSS-like signals.
Eurocontrol indicated that aircraft currently use inertial and DME extensively as a back-up to GNSS navigation. By 2030, there will be multiple constellations, and dual-frequency use should become commonplace in aviation, so GNSS navigation should be much more robust. Aircraft approaches are required to be in conformance with Required Navigation Performance (RNP), so would it be possible to develop RNP procedures for DME and inertial to be used as back-up during approaches in the event GNSS is disrupted?
To conclude the session, Airbus provided a “starter course” overview on inertial systems – how they work, the range of different types available, what they can achieve, costs, strengths and weaknesses and integration with GNSS.
The summit continued with subsequent sessions on:
- Space technologies and users
- GNSS monitoring of Earth and disaster management
- Copernicus – Earth Observation
- GNSS Education
Unfortunately, my deadline didn’t allow me to attend these equally interesting presentations.

There is also a manufacturers’ exhibit area at the summit that just fits into a couple of corridors near the main hall – around 20 booths. I talked with several of the manufacturers, including Spirent who has launched its latest GSS9000 multi-frequency-constellation simulator, with a four-fold increase in system iteration rate over the previous model. Exhibitors appeared to be pleased to be at the summit and by the level of interest shown by the attendees.
So, as this year’s Munich Summit concludes, where does this leave us? We’ve learned some new things about several GNSS topics and heard some interesting new concepts. Europe appears to be now focused on users and applications, to ensure there is market growth and use of Galileo. What stands out for me is the contrast between how European governments go about GNSS and how North America and the commercial world does the same thing without as much direct influence. This is nothing new, of course, it’s just the European way…
Tony Murfin
GNSS Aerospace