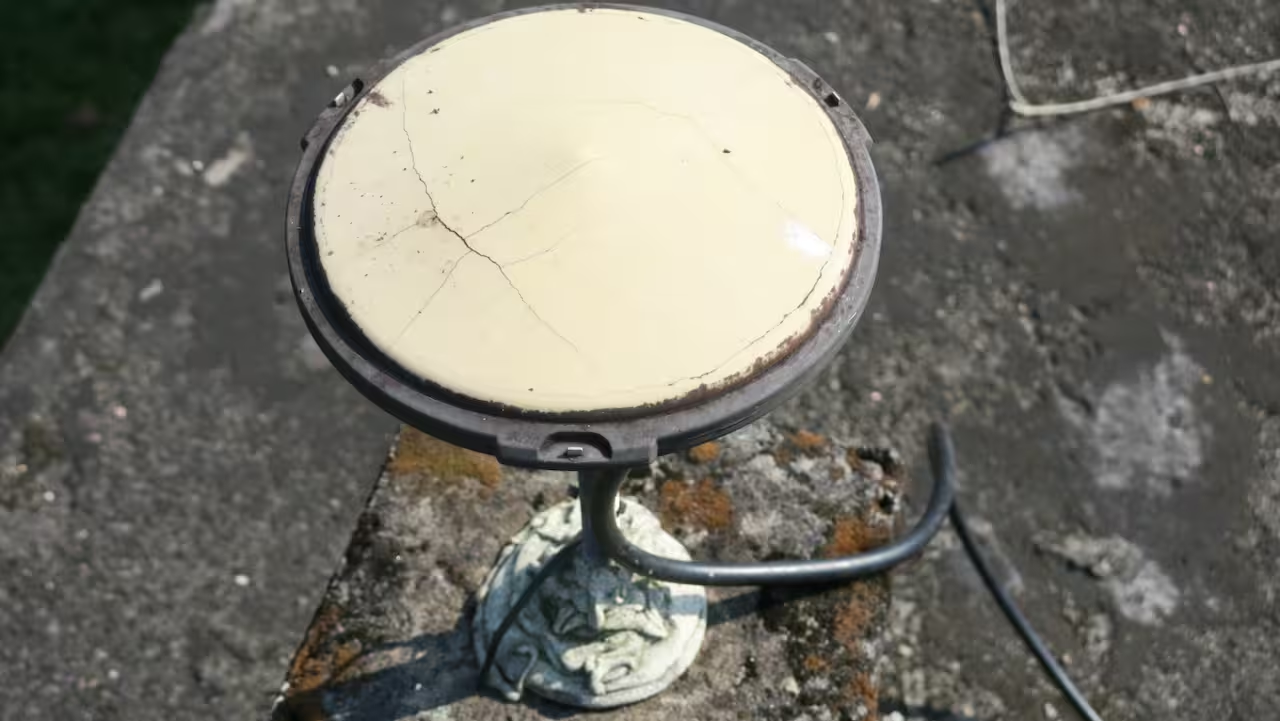
The challenge of repairing GNSS stations in Bangladesh is recounted in a Nov. 6 article by Mike Steckler, a researcher with Columbia Climate School.
Steckler has been conducting research in the country for 25 years. He previously installed a continuously operating reference station (CORS) network in the southern region of the country.
Data from the network has enabled study of the tectonic motions of the Earth leading up to earthquakes. It also revealed the sinking of the land in the world’s largest delta to less than 1 mm/y.
“I still find that amazing compared to the days before GNSS became routine,” he writes. “I’ve been at sea where the crew had to use sextants to estimate our position to within 10 miles.”
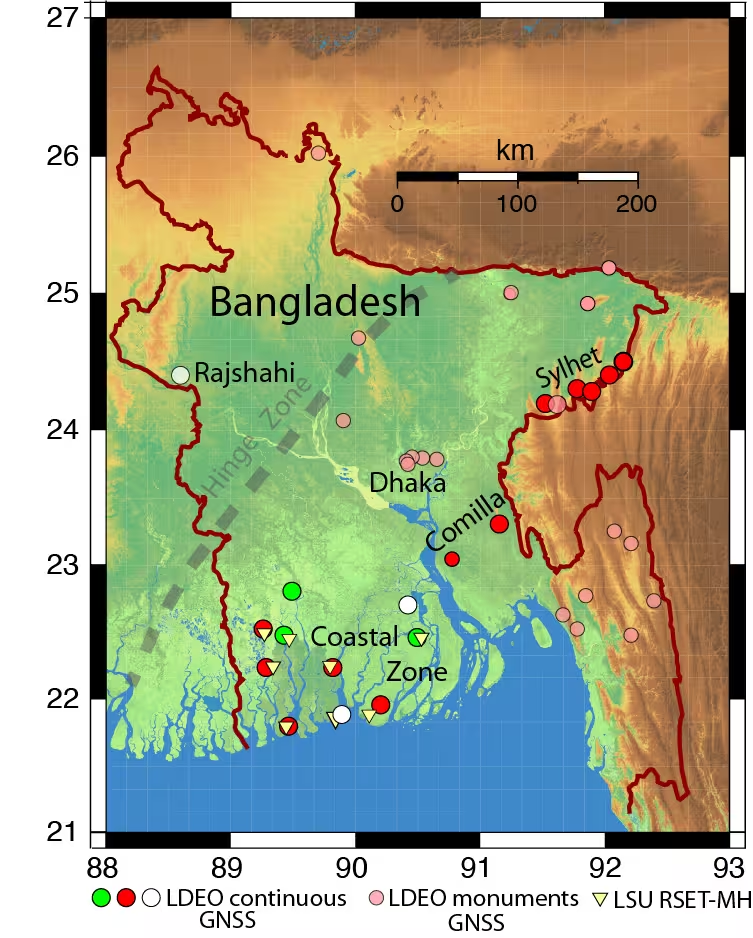
Of 16 stations running in the country, only three (green) were transmitting data back to the U.S. “I have returned here once again with others to get them working again and add three new stations (white),” Steckler writes.
Steckler was joined by a team from Dhaka University to visit the sites, make repairs and install new equipment.
Map of Bangladesh showing the locations of Steckler’s GNSS sites and regions he is visiting. The green circles are working systems, the red ones need repair, and the white ones are new. The pink circles are monuments with no active system. (Image: Mike Steckler)
A massive earthquake and subsequent tsunami off Russia in late July tested an experimental detection system that had deployed a critical component just the day before.
A recent tsunami triggered by a magnitude 8.8 earthquake off Russia’s Kamchatka Peninsula sent pressure waves to the upper layer of the atmosphere, NASA scientists have reported. While the tsunami did not wreak widespread damage, it was an early test for a detection system being developed at the agency’s Jet Propulsion Laboratory in Southern California.
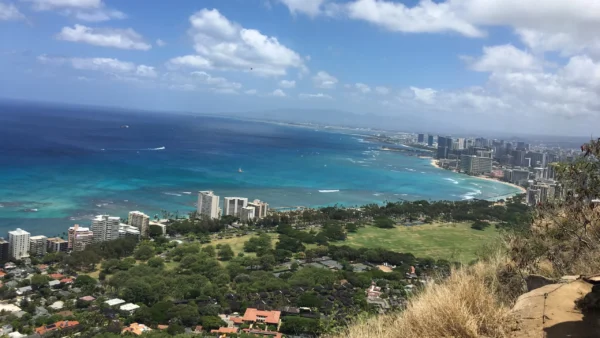
Called GUARDIAN (GNSS Upper Atmospheric Real-time Disaster Information and Alert Network), the experimental technology “functioned to its full extent,” said Camille Martire, one of its developers at JPL. The system flagged distortions in the atmosphere and issued notifications to subscribed subject matter experts in as little as 20 minutes after the quake. It confirmed signs of the approaching tsunami about 30 to 40 minutes before waves made landfall in Hawaii and sites across the Pacific on July 29 (local time).
“Those extra minutes of knowing something is coming could make a real difference when it comes to warning communities in the path,” said JPL scientist Siddharth Krishnamoorthy.
Near-real-time outputs from GUARDIAN must be interpreted by experts trained to identify the signs of tsunamis. But already it’s one of the fastest monitoring tools of its kind: Within about 10 minutes of receiving data, it can produce a snapshot of a tsunami’s rumble reaching the upper atmosphere.
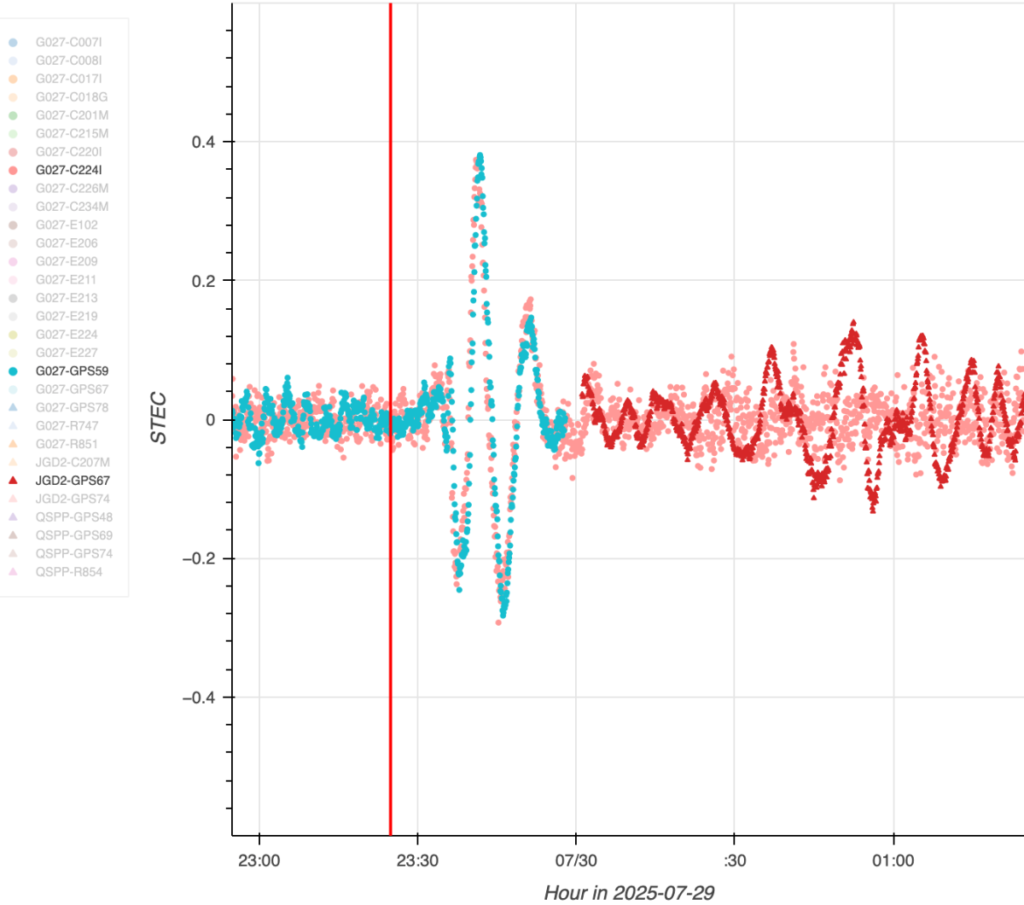
The dots in this graph indicate wave disturbances in the ionosphere as measured between ground stations and navigation satellites. The initial spike shows the acoustic wave coming from the epicenter of the July 29 quake that caused the tsunami; the red squiggle shows the gravity wave the tsunami generated. (Image: NASA/JPL-Caltech)
The dots in this graph indicate wave disturbances in the ionosphere as measured between ground stations and navigation satellites. The initial spike shows the acoustic wave coming from the epicenter of the July 29 quake that caused the tsunami; the red squiggle shows the gravity wave the tsunami generated.
The goal of GUARDIAN is to augment existing early warning systems. A key question after a major undersea earthquake is whether a tsunami was generated. Today, forecasters use seismic data as a proxy to predict if and where a tsunami could occur, and they rely on sea-based instruments to confirm that a tsunami is passing by. Deep-ocean pressure sensors remain the gold standard when it comes to sizing up waves, but they are expensive and sparse in locations.
“NASA’s GUARDIAN can help fill the gaps,” said Christopher Moore, director of the National Oceanic and Atmospheric Administration Center for Tsunami Research. “It provides one more piece of information, one more valuable data point, that can help us determine, yes, we need to make the call to evacuate.”
Moore noted that GUARDIAN adds a unique perspective: It’s able to sense sea surface motion from high above Earth, globally and in near-real-time.
Bill Fry, chair of the United Nations technical working group responsible for tsunami early warning in the Pacific, said GUARDIAN is part of a technological “paradigm shift.” By directly observing ocean dynamics from space, “GUARDIAN is absolutely something that we in the early warning community are looking for to help underpin next generation forecasting.”
How GUARDIAN works
GUARDIAN takes advantage of tsunami physics. During a tsunami, many square miles of the ocean surface can rise and fall nearly in unison. This displaces a significant amount of air above it, sending low-frequency sound and gravity waves speeding upwards toward space. The waves interact with the charged particles of the upper atmosphere — the ionosphere — where they slightly distort the radio signals coming down to scientific ground stations of GPS and other positioning and timing satellites. These satellites are known collectively as the Global Navigation Satellite System (GNSS).
While GNSS processing methods on Earth correct for such distortions, GUARDIAN uses them as clues. The software scours a trove of data transmitted to more than 350 continuously operating GNSS ground stations around the world. It can potentially identify evidence of a tsunami up to about 745 miles (1,200 kilometers) from a given station. In ideal situations, vulnerable coastal communities near a GNSS station could know when a tsunami was heading their way and authorities would have as much as 1 hour and 20 minutes to evacuate the low-lying areas, thereby saving countless lives and property.
Key to this effort is the network of GNSS stations around the world supported by NASA’s Space Geodesy Project and Global GNSS Network, as well as JPL’s Global Differential GPS network that transmits the data in real time.
The Kamchatka event offered a timely case study for GUARDIAN. A day before the quake off Russia’s northeast coast, the team had deployed two new elements that were years in the making: an artificial intelligence to mine signals of interest and an accompanying prototype messaging system.
Both were put to the test when one of the strongest earthquakes ever recorded spawned a tsunami traveling hundreds of miles per hour across the Pacific Ocean. Having been trained to spot the kinds of atmospheric distortions caused by a tsunami, GUARDIAN flagged the signals for human review and notified subscribed subject matter experts.
Notably, tsunamis are most often caused by large undersea earthquakes, but not always. Volcanic eruptions, underwater landslides, and certain weather conditions in some geographic locations can all produce dangerous waves. An advantage of GUARDIAN is that it doesn’t require information on what caused a tsunami; rather, it can detect that one was generated and then can alert the authorities to help minimize the loss of life and property.
While there’s no silver bullet to stop a tsunami from making landfall, “GUARDIAN has real potential to help by providing open access to this data,” said Adrienne Moseley, co-director of the Joint Australian Tsunami Warning Centre. “Tsunamis don’t respect national boundaries. We need to be able to share data around the whole region to be able to make assessments about the threat for all exposed coastlines.
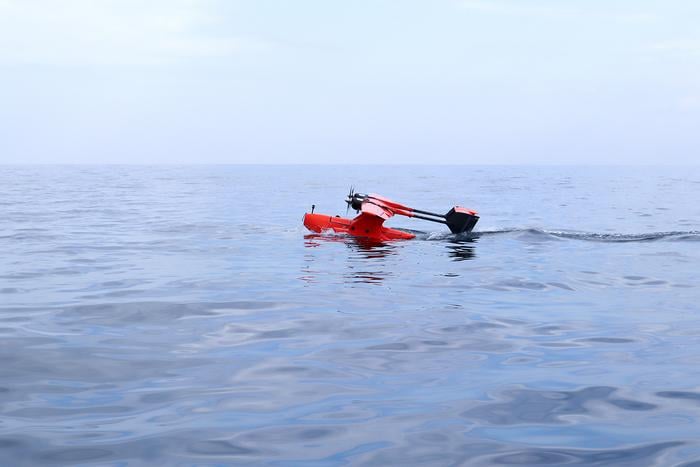
Researchers demonstrate a seaplane-type UAV using GNSS-A can precisely measure seafloor deformation
Megathrust earthquakes are large earthquakes that occur on faults found along the boundaries between tectonic plates. The Nankai Trough is a megathrust earthquake zone lying off the southwestern coast of Japan, and experts estimate that this zone could generate a potentially devastating (magnitude 8 or 9) large earthquake sometime in the next 30 years. A seismic event of this magnitude could trigger cascading hazards such as destructive tsunamis.
Developing the technologies for efficient and reliable seafloor monitoring is paramount when considering the potential for socioeconomic harm represented by megathrust earthquakes. Traditionally, seafloor measurements have been obtained using transponder stations on the seafloor that communicate with satellites via buoys or ocean-going vessels to produce accurate positional information. However, data collection using such systems has problems such as low efficiency and speed.
In a study published in Earth and Space Science, researchers at Institute of Industrial Science, the University of Tokyo, addressed the challenge of acquiring reliable, high-precision, real-time seafloor measurements by constructing a seaplane-type unmanned aerial vehicle (UAV) that can withstand ocean currents and wind. This vehicle is intended for use with the GNSS–Acoustic (GNSS-A) ― a system that uses satellites to determine locations on Earth ― to provide a communication link with seafloor transponder stations.
“We conducted initial experiments in a water tank,” explains lead author of the study Yuto Yoshizumi, “and found that the proposed system can detect distances to an accuracy within 2.1 cm.”
To further evaluate the system, at-sea trial tests were performed by landing the UAV on the sea surface off the coast of Japan under optimal sea conditions. “The results were hugely encouraging,” said senior author Yusuke Yokota. “These seafloor positioning measurements are the first ever achieved using a UAV, and we attained a horizontal root mean square error of approximately 1–2 cm, which is easily comparable to that of existing vessel-based systems.”
The rapid real-time acquisition of seafloor information using the UAV system developed by the research team at Institute of Industrial Science, the University of Tokyo, is expected to provide the foundation for advanced research into earthquake disaster prevention. Such data are urgently needed given the speed and frequency of occurrence of megathrust earthquakes on the Nankai Trough.
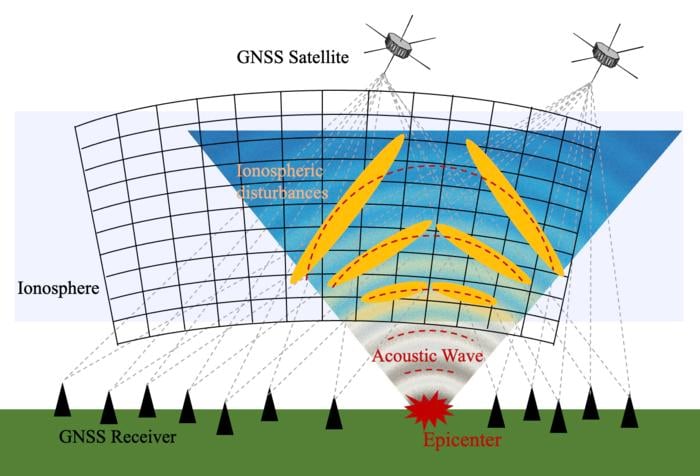
Scientists at Japan’s Nagoya University have used Japan’s extensive network of GNSS receivers to create the first 3D images of atmospheric disturbances caused by the 2024 Noto Peninsula Earthquake. Their results show sound wave disturbance patterns in unique 3D detail and provide new insights into how earthquakes generate these waves.
Japan has one of the densest GNSS networks in the world, with more than 4,500 receivers spread across the country. The network helps with precise location tracking and can also detect changes in the ionosphere.
A research team led by Dr. Weizheng Fu and Professor Yuichi Otsuka from Nagoya University’s Institute for Space-Earth Environmental Research (ISEE) has captured the detailed 3D structure of electron density changes in the ionosphere after the 7.5 magnitude Noto Peninsula Earthquake that occurred on January 1, 2024, in Ishikawa Prefecture, Japan.
When satellite signals travel through the ionosphere, they slow down because the radio waves interact with electrically charged particles. By measuring how much the signals slow down, scientists can calculate how many electrons are in the signals’ path and map the total electron content. Mapping these electrons allows them to effectively probe and monitor the state of the ionosphere.
About 10 minutes after the earthquake, the sound waves it generated traveled upward through the atmosphere and reached the ionosphere (60-1000 km above Earth). This created ripple disturbances similar to throwing a stone in a pond.
To build a 3D model of wave patterns, the researchers used a technique called “tomography” — similar to how CT scans create 3D images of the human body. They collected data on electron numbers from thousands of receivers tracking signals from satellites at different angles. By tracking their 3D models at different times after the earthquake, they created a time series of how electron density changed.
Sound waves generated from entire fault lines, not single points
South of the epicenter, the researchers observed a tilted sound wave pattern that gradually became more vertical over time. When an earthquake creates sound waves that travel upward through the atmosphere, the upper parts of the waves move faster than the lower parts. This makes the wave front lean or tilt as it moves. Over time, the tilted pattern gradually straightens into a more vertical alignment.
The researchers produced the first detailed 3D visualization of how the tilt angle changes over time during a seismic event. They tracked how the tilted wave patterns gradually straightened in unprecedented detail.
Earthquakes do not create atmospheric waves from just one spot, but rather from multiple points along the entire fault as different sections rupture over time. This explains why the atmospheric disturbances observed, such as tilted waves, were more complex than previous simpler models had predicted.
Previous models assumed all sound waves came from a single point at the earthquake’s center. While this matched some of their observations, it could not explain the complex, uneven wave patterns they saw in their 3D images.
To understand this, they included data from multiple wave sources along the fault line in their model, assuming that some parts of the fault generated waves about 30 seconds after the initial rupture. The results better matched their real-world observations and showed that earthquakes do not create atmospheric waves from just one spot, but rather from multiple points along the entire fault as different sections rupture over time. This explains why the atmospheric disturbances observed, such as tilted waves, were more complex than previous simpler models had predicted.
“By including multiple distributed sources and time delays, our improved modeling provides a more accurate representation of how these waves propagate through the upper atmosphere,” Professor Otsuka said.
“Disturbances in the ionosphere can interfere with satellite communications and location accuracy. If we understand these patterns better, we could improve our ability to protect sensitive technologies during and after earthquakes and enhance early warning systems for similar natural events,” lead author Weizheng Fu added.
Moving forward, the researchers are working on applying their model to other natural events such as volcanic eruptions, tsunamis, and severe weather events.
Fairweather crew lower a launch into Puget Sound, Washington, for Hydrographic Systems Readiness Review testing. (Photo: NOAA)
U.S. researchers have completed the first high-resolution, comprehensive mapping of one of the fastest moving underwater tectonic faults in the world, located in southeastern Alaska.
The mapping information will help communities in coastal Alaska and Canada better understand and prepare for the risks from earthquakes and tsunamis that can occur when faults suddenly move.
Since 2015, scientists have been gathering data on the Queen Charlotte-Fairweather fault system, a 746-mile long strike-slip fault line that extends from offshore of Vancouver Island, Canada, to the Fairweather Range of southeast Alaska.
Team members are from the National Oceanic and Atmospheric Administration (NOAA), the U.S. Geological Survey (USGS) and their partners.
The most recent survey came from NOAA ship Fairweather, with USGS scientists aboard from April through July, when it collected multi-beam bathymetric data in an area along the U.S. and Canadian international border in water depths ranging from 500 to more than 7,000 feet deep.
Researchers aboard NOAA Ship Fairweather collected multibeam bathymetric data in an area along the U.S. and Canadian international border in water depths ranging from 500 to more than 7,000 feet deep from April through July. (Image: USGS)
“Providing scientific information to help protect vulnerable communities is one of our most important missions,” said W. Russell Callender, assistant NOAA administrator for the National Ocean Service. “Working with USGS and our state and academic partners, allows us to speed the development of information that can help communities better anticipate and prepare for risks from tsunamis and earthquakes.
“This project has been a great collaboration on an important scientific issue with significant implications for public safety,” said David Applegate, USGS associate director for natural hazards. “We will apply what we learn from this mapping mission to hazard assessments for Alaska’s coastal communities. Partnering with NOAA reflects the importance of addressing earthquake and associated tsunami hazards to both our missions, and it enables the USGS to bring our geologic expertise to bear on offshore fault structures that have significant onshore implications.”
Fault line activity poses a hazard to the growing populations of Juneau, Sitka and other communities throughout southeastern Alaska, as well as more than a million annual tourists and the seafloor infrastructure critical for Alaska’s communications and offshore energy industries.
With a slip rate of more than 2 inches per year, this fault may be one of the fastest-moving strike-slip faults in the world. (For comparison, the San Andreas fault in central California slips about an inch to an inch-and-a-half each year.)
Movement between the tectonic plates at the fault line has generated six earthquakes of magnitude 7 or greater within the last century. One of those earthquakes, a magnitude 7.8 earthquake near Lituya Bay, Alaska, in 1958 triggered a landslide that sent water 1,720 feet up an adjacent mountainside, one of the highest recorded run-ups of a tsunami — a rapidly rising turbulent surge of water often choked with debris.
A NOAA survey ship uses its multibeam echo sounder to conduct hydrographic surveys. (Image: NOAA)
A series of large-magnitude earthquakes and associated aftershocks in 2012 and 2013 spurred research cruises in 2015, in the first systematic effort to study the offshore Queen Charlotte-Fairweather fault system in U.S. territory in more than three decades.
A similar effort led by the Geological Survey of Canada has been underway along the portion of the fault located in Canadian territory.
The 2018 Fairweather survey built on five previous USGS-led marine geophysical and geological surveys between 2015 and 2017 in southeastern Alaska aboard a number of research vessels, as well as two cruises led by researchers from the Geological Survey of Canada, Sitka Sound Science Center and USGS.
During these surveys, researchers used an array of instruments to collect data on seafloor depth and texture, to profile sedimentary layers beneath the seafloor, and to derive sediment ages.
NOAA Ship Fairweather underway in Alaska. (Photo: NOAA)
NOAA nautical charts will be updated with the Queen Charlotte Fault data within a year once the data goes through a standard quality control process — although the fault area is too deep for any obstructions to pose a threat to marine traffic.
This research is part of a larger two-year effort between the NOAA Integrated Coastal and Ocean Mapping Program and USGS to map large portions of the Cascadia continental margin in federal waters offshore of Alaska, California, Oregon and Washington.