The new edition of Cartographies of Disease: Maps, Mapping, and Medicine from Esri traces the long history of how maps have been used to help unlock the mysteries behind the cause and spread of diseases such as cholera, yellow fever and Ebola. Ebola is the focus of two new chapters.
Cartographies of Disease was first published in 2005 and showed how maps could be used as an important tool for studying both chronic conditions and disease epidemics. It became a must-read for policy makers and others working in public health and medicine.
In this expanded edition, author Tom Koch adds new material to deepen readers’ understanding of medical mapping from the 17th to 21st centuries. The book covers the mapping of diseases and medical conditions such as cholera, yellow fever, typhoid fever, sandfly fever, hernia, lymphoma, arteriosclerotic heart disease, cancer, influenza, AIDS, West Nile virus and Ebola.
“Cartographies of Disease is a book about our confrontations with bacterial and viral agents across history,” Koch wrote in the book’s introduction. “It is also about how maps help us profile those conditions in our attempts to restrict them. Ebola in 2014 reminded us that it’s urgent to understand the conditions that promote disease and the ways we confront them on the ground.”
The book provides a nontechnical narrative and a visual history of mapping’s role in studying what causes disease, understanding where and how diseases spread, and how they can be combated. The illustrations include more than 100 maps and charts, from a pair of 1694 maps of plague locations and containment zones in Bari, Italy, to digital maps of the 2014 Ebola outbreak, created using geographic information system (GIS) technology.
Ebola charted
Ebola is the focus of the two new chapters. In Chapter 13, the international perception of Ebola’s threat is charted and, with it, the fear engendered by the possibility that a local outbreak might become an international pandemic. Perceptions of the disease and reactions to it are mapped using contemporary technologies such as GIS.
Chapter 14 is devoted to the practical issues of mapping an infectious virus like Ebola in developing countries. It describes how the potential for Ebola to spread was initially overlooked and how, in the future, new epidemics might be better contained. Mapping, Koch argues, can help identify disease threats, direct medical assistance when necessary, and educate people—locally and internationally — about new diseases.
Koch is a medical ethicist and gerontologist based in Canada. As an adjunct professor at the University of British Columbia, Vancouver, he developed a series of teaching labs for medical geography.
Cartographies of Disease: Maps, Mapping, and Medicine, new expanded edition, is now available in print (ISBN: 9781589484672, 412 pages, US$79.99) or as an e-book (ISBN: 9781589484764, 412 pages, US$59.99). The print edition of the book can be obtained from online retailers worldwide, at esri.com/esripress, or by calling 1-800-447-9778.
The e-book edition is available for purchase from online retailers. Outside the United States, visit esri.com/esripressorders for complete ordering options.
Longing for the good old days when we mostly worried about nukes
Years ago, Navy colleague Commander Stephen Rose drew a lot of attention at the Naval War College with his essay entitled “The Coming Explosion of Silent Weapons.” The essay was awarded both the Colbert Memorial Award and the Joint Chiefs of Staff Writing Prize. I never thought that 27 years later his paper would seem so timely and highlight the critical need for the geospatial work being done by the NIH (National Institutes of Health), CDC (Centers for Disease Control), DTRA (Defense Threat Reduction Agency), U.S. Army and others.
In his paper, Commander Rose reviewed emerging warfare technologies including chemical warfare, biological warfare, gene splicing, nano technology, remotely piloted vehicles (RPVs) and more. He compared the complexity and expense of a country trying to develop a nuclear capability compared to the relative ease and low cost of developing chemical and biological weapons, which were sort of a “poor man’s nuke.”
Although, years later, the countries named in the paper have not changed significantly: Iran, Iraq, Syria and Libya. You can read the full paper at the Naval War College website.
Worrisome at the time, most of us took comfort in the built-in deterrence that was intrinsic with chemical and, more so, biological weapons. It was a genie that with a slight change of wind direction could hurt friendly troops as easily as enemy troops. Even more problematic, biological agents could affect not only friendly troops but even the user’s families in their own home towns. So for the past 27 years we’ve whistled past the graveyard in the belief that no one would be crazy enough to use biologics.
Although we were Cold War enemies, I knew that my Soviet counterparts shared most of my values. They enjoyed life, loved their families, relished their vodka and just wanted to go home and perhaps work on their Dachas. Even Star Trek Klingons were philosophically not that different from either of us. Enter the 21st century, and now suicide bombing has become a virtue with cash rewards paid to the surviving family members and a path to heavenly pleasures for the bomber. This, of course, changes everything.
Congressional testimony by National Intelligence Director Clapper and others have pointed to a growing concern about chemical and biological attacks. Additionally, some terrorists are not intellectual lightweights. Recently, the former Iraq chemical and biological expert Sleiman Daoud al Afari was captured, and this week the number two man in ISIS, former physics professor Haji Imam, was killed. So is it just a matter of time before someone with the right knowledge, skills and relatively light resources builds a biologic that gets out of control?
Esri Federal GIS Medical Special Interest Group
During the recent Esri Federal GIS Conference in D.C., I attended a session concerning GIS and global responses to pandemics and biological threats. The session was moderated by Dr. Este Geraghty, MD, MS, MPH, CPH, FACP, GISP, who is Esri’s chief medical officer.
Although the discussion focused mostly on the Zika virus, much of the background information covered the geospatial aspects of the Ebola outbreak in Africa. According to one of the presenters, David Foster, a U.S. contractor and prior Air Force veteran who participated in the response, the world response was quick, but it was also a dizzying collection of government and non-government agencies with more than 80 different responding groups. Somewhat disconcerting was that no one was really in charge and communications was poor.
Dr. Geraghty was kind enough to do a video interview, primarily focused on the concerns of this article and the need for a strong geospatial monitoring and analysis capability.
One example: Early GIS at CDC
In 199 when I retired from the Navy and became the GIS manager of the Atlanta Regional Commission, we established the region’s first Esri ArcView Learning Center. A number of CDC doctors and staff members took our ArcView II classes. Six months later, I was humbled with what those early students had accomplished. They used the relatively basic ArcView II to map disease outbreaks domestically and worldwide. The maps provided a valuable visualization tool that helped with understanding complex outbreaks and how to combat their spread.
The growing need for more sophisticated spatial monitoring, analysis and display led to the creation of GRASP (Geospatial Research, Analysis and Services Program). CDC and the Agency for Toxic Substances and Disease Registry, Division of Toxicology and Human Health Sciences (ATSDR/DTHHS) worked to build the needed geospatial capability, and in 2013 Booz Allen Hamilton was awarded a competitive contract to build a unified and comprehensive GIS support system for CDC and ATSDR.
GRASP program specifics include:
GIS analysis, research and geospatial statistics.
GIS remote sensing imagery analysis.
Cartographic design and production.
GIS web/desktop/mobile application design, development and maintenance.
GIS shared service design, development and maintenance.
GIS database design, development, management and maintenance.
GPS data-gathering, training and support.
GIS systems integration.
GIS training.
GIS project management.
GRASP has grown into a sophisticated monitoring and analysis system. When a serious outbreak occurs, CDC responds like other emergency response organizations and stands up an Emergency Operations Center (EOC) in accordance with the National Incident Management System (NIMS). GRASP maps, imagery and visualizations help everyone understand the nature and scope of the threat by creating a common operational picture.
This capability is further enhanced with new Esri tools such as Insight, easy geocoding, big-data deep analysis, tools for activating response teams, as well as sharing and collaboration with other federal agency and resources such as GEOINT, HUMINT (human intelligence), SIGINT (signals intelligence) and social media.
Natural or man-caused, and who makes the call?
Getting back to Commander Rose’s paper, one is left with the following points to ponder. Following a conventional or nuclear attack, a country instantly knows three things: that it’s been attacked, when it was attacked and where it was attacked. As a result, the subject country stands a good chance of figuring out who did the attack.
Conversely, with a biological attack, a country may not know when or where the attack occurred, or if it was even an attack and not just a natural outbreak. This then becomes a tough decision for our analysts, because announcing a devastating outbreak as a biological attack could be tantamount to announcing a modern-day Pearl Harbor without the benefit of seeing burning ships or falling buildings. Additionally, the path from analysis to a definitive determination and by who may not be completely clear.
Existential threat?
So, are we in a Cornelian dilemma? Are we better off pulling back and lying low in hopes that “they” won’t hate us enough to initiate a suicidal attack that launches Armageddon? Or do we act preemptively with all our intelligence and military resources to beat down any group that shows the slightest inclination and potential to entertain this suicidal activity?
Some politicians have stated that although we lost more than 3,000 people during 9/11, it was a relatively small percentage loss in the grand scheme of things; that the U.S. is so big and so powerful that we don’t face an “existential threat.” So one would have to ask if the loss of 10, 20 or 50 percent of our population would be existential enough?
Complicating the issue, as some of my intel colleagues are fond of pointing out, is that if some actions we are currently taking or not taking seem to make no sense, it’s probably because you don’t know all the facts.
Regardless, our monitoring and analysis capability may be one of the most important activities being done by our geospatial community. Additionally, we need to make sure that our protective agencies get what they need to do the monitoring and analysis to keep us safe. My hope is that we really are doing what needs to be done and not just dreaming of the good ol’ days when all we had to worry about was a nuclear attack.
The National Geospatial-Intelligence Agency made available October 23 a public-facing website to assist U.S. and international relief efforts to combat the spread of the Ebola virus disease, providing unprecedented online access to its unclassified geospatial intelligence in support of lead federal agencies and partners.
NGA’s efforts add important value to the support offered by other organizations, including the All Partners Access Network, which provides community spaces and collaborative tools to the Department of Defense and mission partners to leverage information to effectively plan, train and respond to mission objectives.
“The dynamic site provided by NGA allows the agency to automatically federate its geospatial content, which then is used by organizations such as APAN for mission-related efforts,” said agency Director Robert Cardillo.
NGA’s role in the Ebola crisis has been in step with many other global events that have required the agency’s disaster support, including Hurricane Katrina in 2005, the Haiti earthquake in 2010, Hurricane Sandy in 2012 and Typhoon Haiyan in 2013. The
agency’s focus on unclassified support to the crisis allows its content to be available with no caveats or limits in distribution.
The large number of non-governmental organizations, or NGOs, involved in the relief effort requires NGA take a different approach to disseminating unclassified information so the people who need NGA’s information on the crisis, have it.
The dynamic site uses Esri’s ArcGIS Platform hosted in the cloud by Amazon Web Services, both publically available services. The site features various base maps that provide foundational context for users, who will then have the ability to visually overlay public NGA data, as well as ingest open-source data. NGA’s data can provide logistical information relevant to the situation on the ground affected by the Ebola crisis.
NGA’s first exposure of data includes geospatial layers relevant to the Ebola outbreak in Guinea, including cultural places and structures, and communication, electric power and ground transportation infrastructure. For example, Ebola cases by province and
locations of emergency treatment units will be visually accessible for users to ascertain the distance from a certain airfield to the closest emergency treatment unit.
The American Red Cross Geographic Information System team is enlisting volunteers to help map areas in Africa hard hit by the ebola virus. The Red Cross is attempting to get ahead of the virus by creating detailed maps of rural towns and villages so officials can track the deadly virus as it spreads, according to ABC News. Volunteers have been drafted to study satellite imagery of homes, schools and villages.
Once the maps are detailed, they are sent to Red Cross partners, including Doctors Without Borders and the International Federation of the Red Cross and Red Crescent, which are working in the field to treat victims and stop the outbreak.
The maps are useful in a variety of ways. With better maps, epidemiologists can track where the disease is spreading, and find sick individuals in remote areas. In a specific example, the World Health Organization requested that GIS professionals look at cemeteries, a key location where infection can occur.
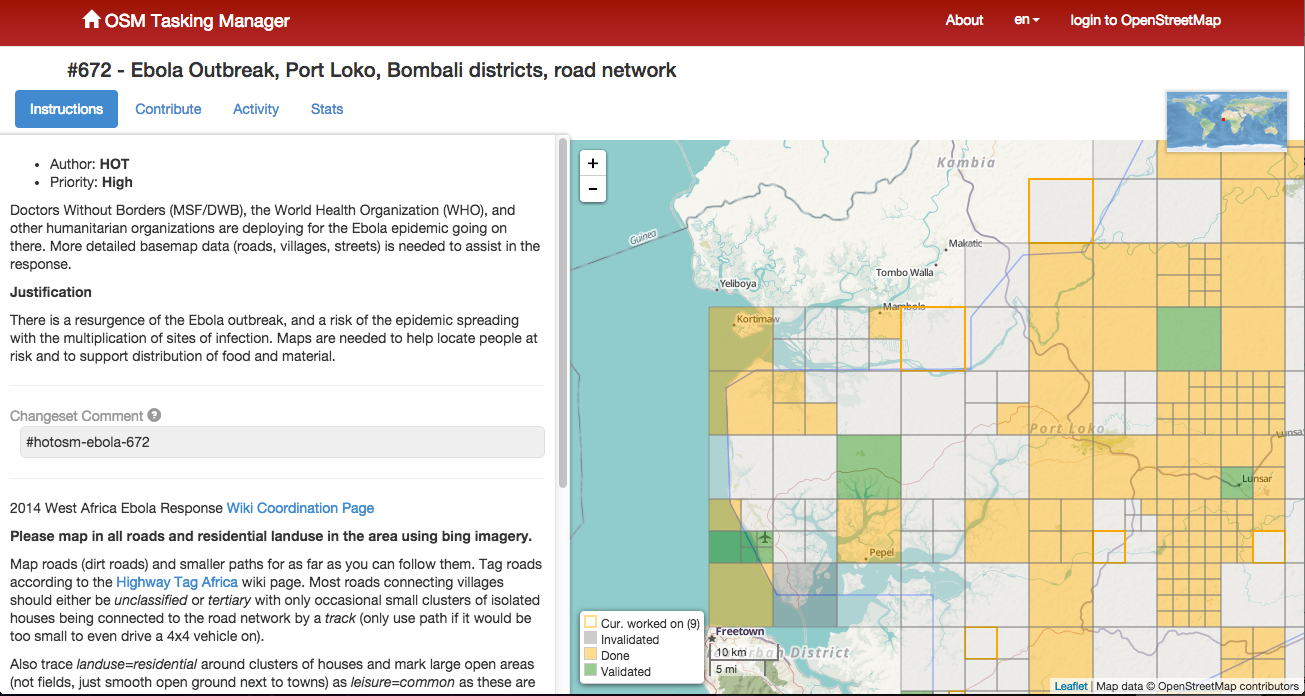
The volunteers have been able to fine-tune maps of remote villages which are used by relief workers trying to navigate rural roads, towns and neighborhoods. For instance, the original map for Guéckédou, Guinea, a town near the epicenter of the outbreak, showed just nine roads. After volunteers studied satellite photographs, they were able to add hundreds of roads and streams.
The project goes both ways, as people working in the remote areas send in GPS locations for villages that have never been mapped before. The maps can be vital to fight Ebola in rural areas where road signs, maps and GPS locations are scarce.
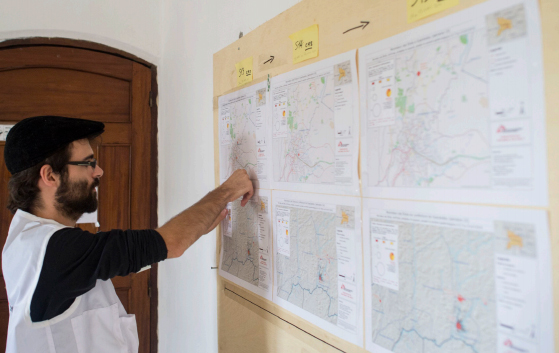
A GIS expert helps the Doctors without Borders epidemiological team respond to the ebola outbreak. Photo: American Red Cross Geographic Information System
The effort is similar to an effort by MSF-Switzerland (Doctors without Borders) in March 2014, which deployed a dedicated GIS officer to Guinea in response to the Ebola outbreak in the south of the country. During his eight-week his mission, the GIS officer produced 109 maps for this previously very poorly mapped area. The maps included basic orientation maps that showed roads, landmarks and villages but also specialized maps that visualized population density or the spread of the disease.
With the help of the newly created database and subsequently produced maps, the GIS officer was able to pinpoint the exact location of villages and identify villages that had the same name but were in different parts of the prefecture. Based on this information, MSF program staff were able to respond to the outbreak faster, in a more targeted way and with fewer resources.
Plus, the weekly mapping of confirmed and suspected Ebola cases helped translate the progression of the epidemic from technical data into an easy-to-grasp map. As a result, staff at all levels had a better understanding of the emergency.
Just like the American Red Cross is currently doing, the GIS unit crowdsourced certain mapping tasks, which resulted in a substantial number of overview maps created with the help of close to 250 online volunteers. The volunteers helped to map previously unmapped cities and roads within a few days, and at a granular level, mapping individual buildings. These overview maps then became the foundation of many maps that the GIS officer created for the outbreak response.
To learn more about that project, download a PDF report, “GIS Support for the MSF Ebola response in Guinea in 2014.”
For historical context, Esri’s ArcGIS is provides a story map that shows previous ebola outbreaks in Central Africa, 1976–2013, as well as the current outbreak. The interactive story map explores the first known contact with the disease in 1976 in the Democratic Republic of Congo and every outbreak since then, including the ongoing crises in Guinea, Liberia, Sierra Leone, and Nigeria. Users get basic statistics about each outbreak and browse reports from different agencies, all directly within the map.
Esri is making available an interactive Ebola Outbreaks story map. Users can explore the first known contact with the disease in 1976 in the Democratic Republic of Congo and every outbreak since then, including the ongoing crises in Guinea, Liberia, Sierra Leone, and Nigeria.
The story map includes basic statistics about each outbreak, and reports from different agencies, all accessed directly from within the map. The map appears below:
 The new edition of Cartographies of Disease: Maps, Mapping, and Medicine from Esri traces the long history of how maps have been used to help unlock the mysteries behind the cause and spread of diseases such as cholera, yellow fever and Ebola. Ebola is the focus of two new chapters.


 Esri is making available an interactive