Tag: GEOID18

  • ArcGIS web app incorporates datasets, NGS data layers for surveyors

    ArcGIS web app incorporates datasets, NGS data layers for surveyors

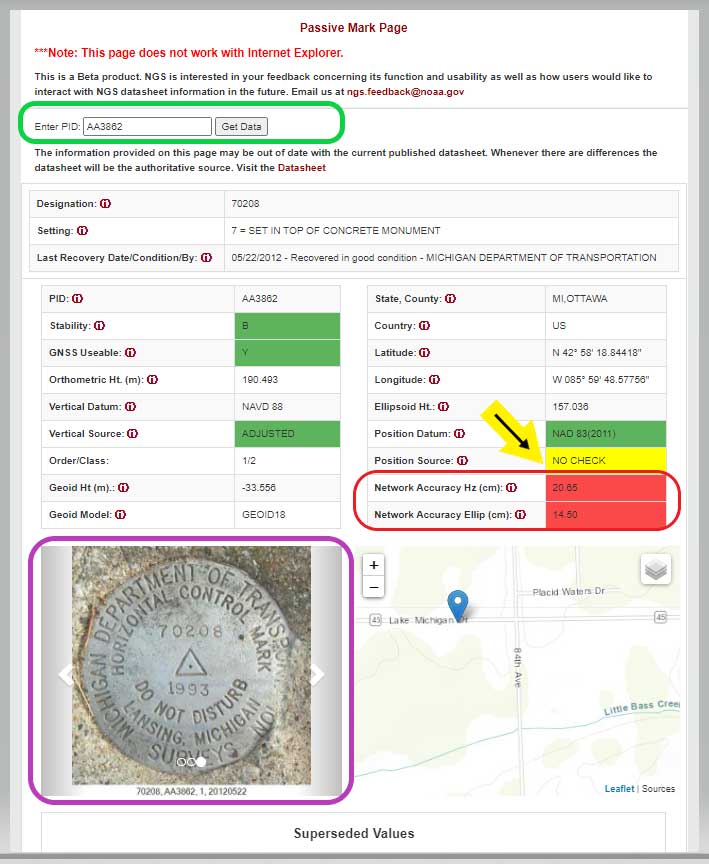
    My last column described a new National Geodetic Survey (NGS) webtool for obtaining geodetic information about a passive mark in their database. The column highlighted some features that may be of interest to GNSS users. It provides all of the information about a station in a more user-friendly format. This column highlights an ArcGIS web application that incorporates various California specific datasets and NGS data layers to assist surveyors planning vertical control surveys. The GNSS Leveling Web Application was provided to me by Jay Satalich, chief, Office of Surveys, Caltrans (see box titled “Linkedin Notification from Jay Satalich).

    Linkedin Notification from Jay Satalich

    Supervising Transportation Survey (Chief, Office of Surveys) at State of California, Department of Transportation:

    “GNSS Leveling Web Application” [is] an Esri ArcGIS online web app created for my “GNSS Leveling” students at College of the Canyons. Designed as a practical tool when planning vertical control surveys using GNSS. National datasets include: National Spatial Reference System (layers: satellite visibility, stability, and vertical control source), geology, and GEOID18 (layers: GEOID18 height, difference between GEOID18 and GEOID12B, and GEOID18 uncertainty). California-specific datasets include: oil/gas/fracking/injection wells, fault lines, oil fields, groundwater basins, and landslide areas. The NOAA National Geodetic Survey data layers were created and published by Brian Shaw. People who influenced development of this app include Dave Zilkoski, Kevin M Kelly, Ken Hudnut, David D Jackson, Ross S. Stein, and Arthur Sylvester.

    Go to the app here.

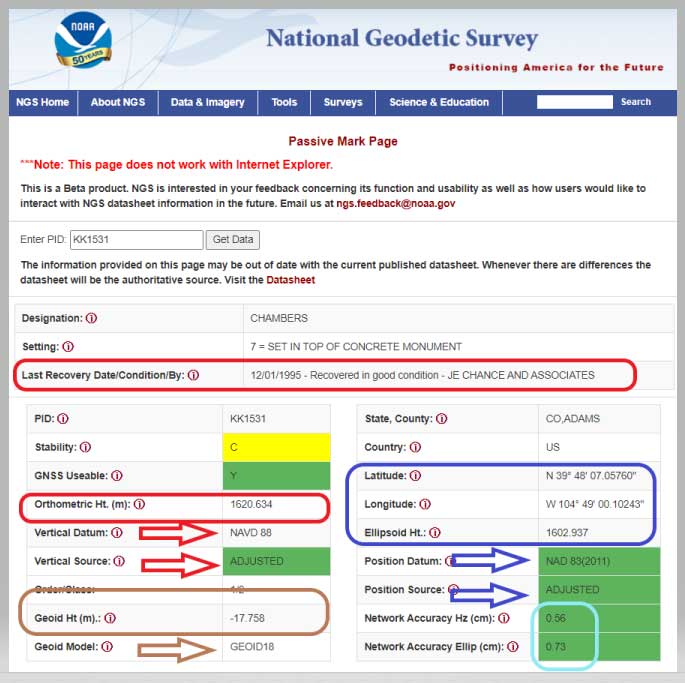
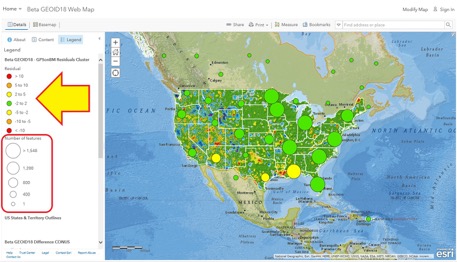
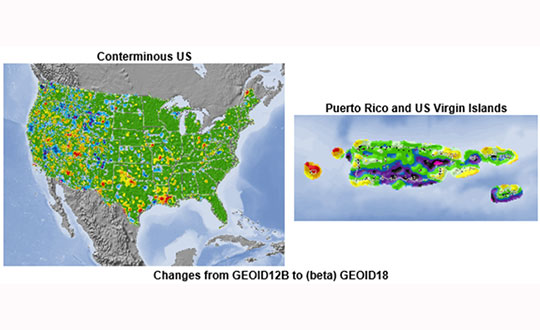
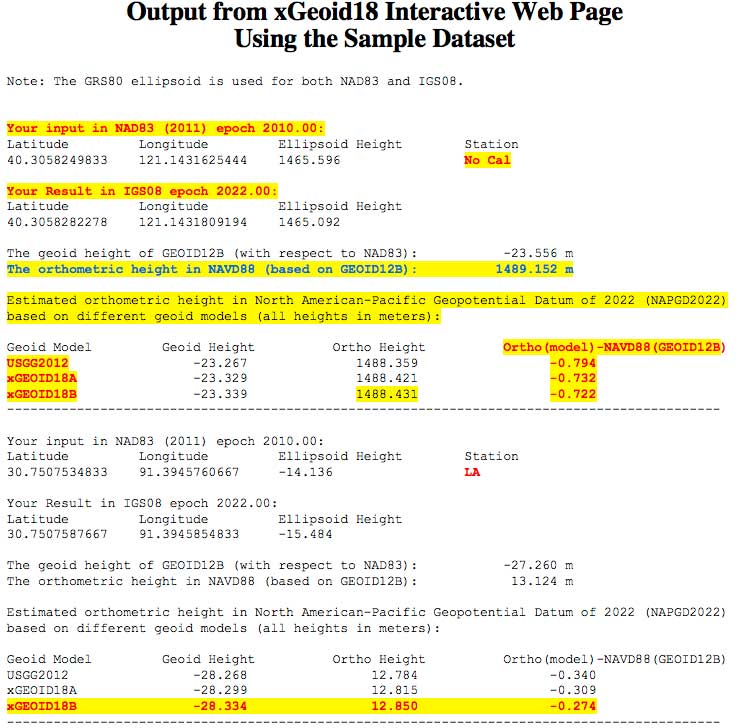
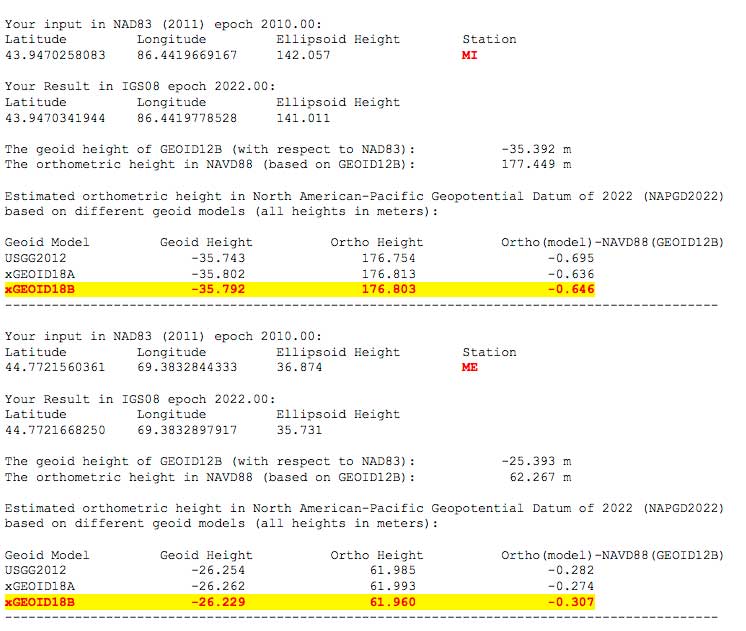
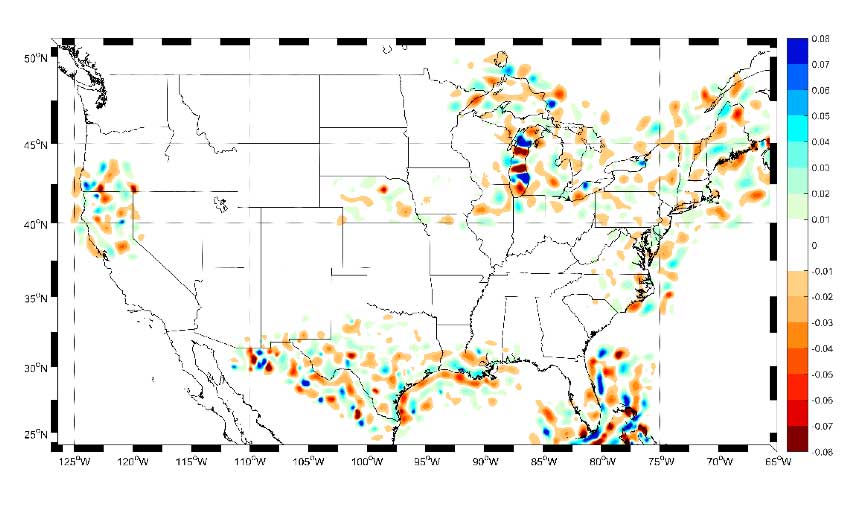
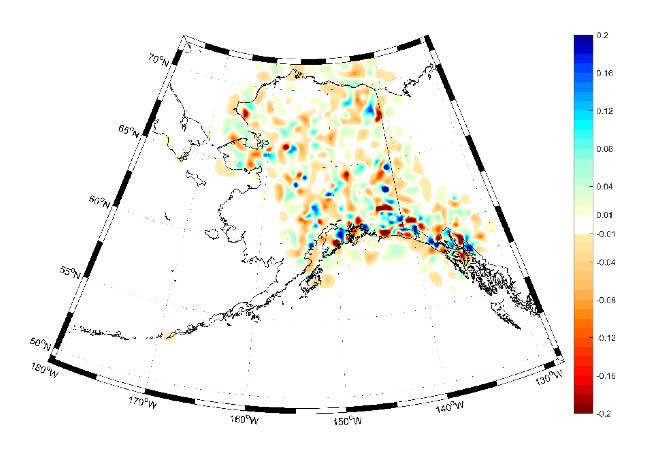
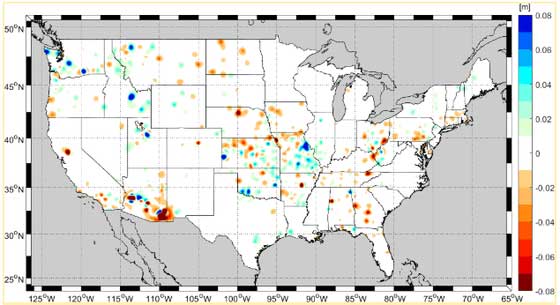
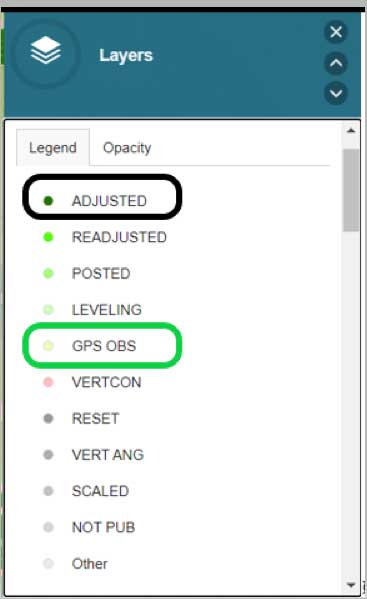
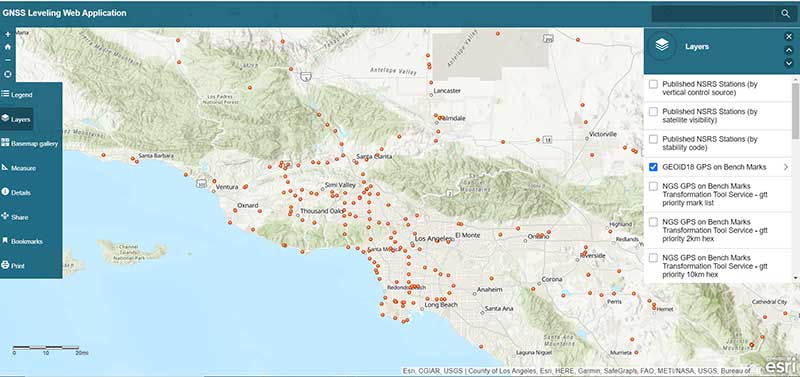
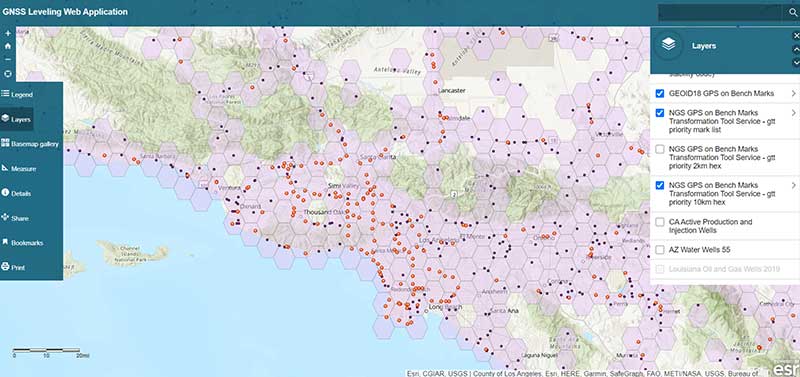
    The box titled “GNSS Leveling Web Application” depicts a map of the Los Angeles area that provides the list of published marks in NGS’ database with an overlay of the uncertainty of NGS’ hybrid geoid model GEOID18. Plotting the published marks from NGS’ database is very useful for surveyors reconning marks for a GNSS survey project. The attributes allow users to quickly identify stations that have published heights from leveling adjustments projects (labeled as ADJUSTED) and those that have heights published from GNSS adjustments projects (labeled as GPS OBS). (See here for definition of attributes.)

    GNSS Leveling Web Application

    (https://www.arcgis.com/apps)

    Source: Esri ArcGIS GNSS Leveling Web Application
    Source: Esri ArcGIS GNSS Leveling Web Application
    Source: Esri ArcGIS GNSS Leveling Web Application
    Source: Esri ArcGIS GNSS Leveling Web Application

    Source: Esri ArcGIS GNSS Leveling Web Application
    Source: Esri ArcGIS GNSS Leveling Web Application

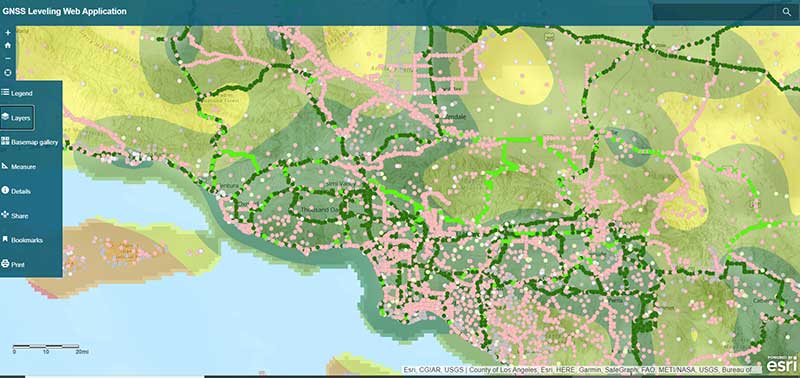
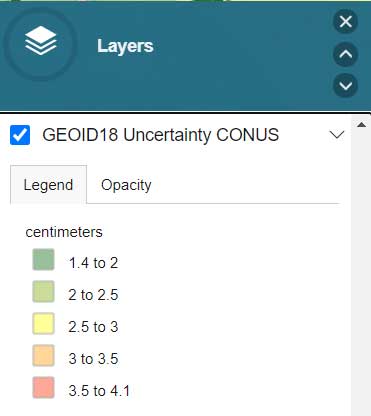
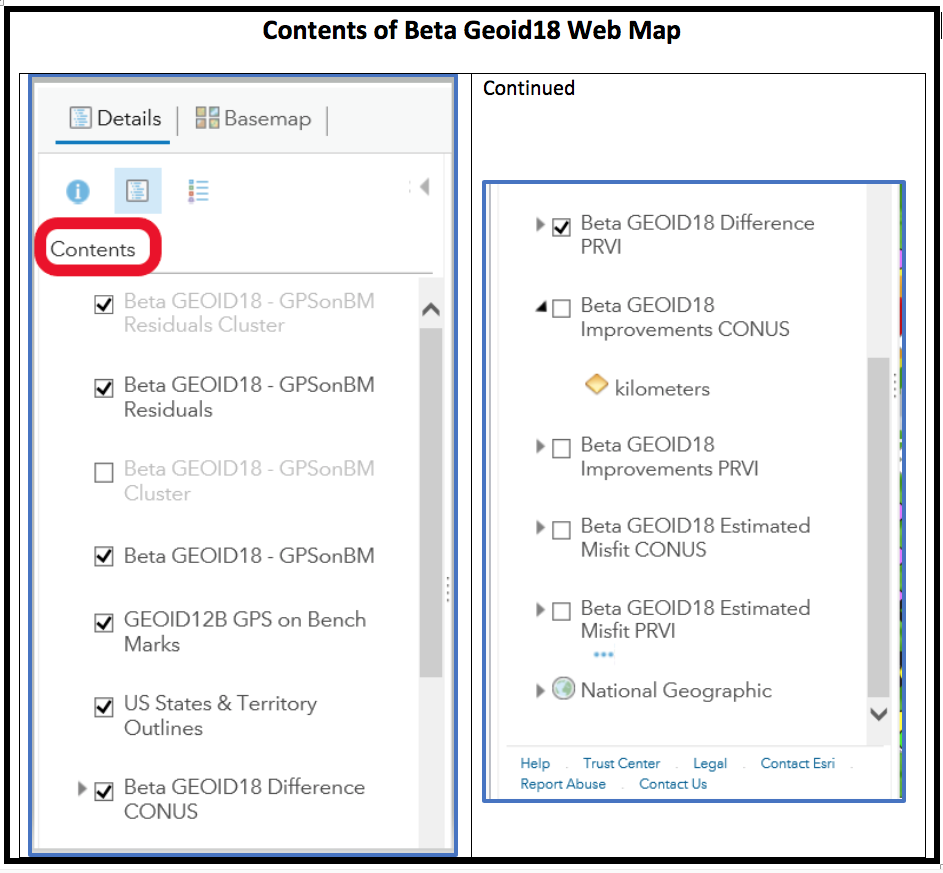
    The list all of the layers of the web application are provided in the box titled “GNSS Leveling Web Application Layers.” (Note: After you open up the web application, click on the Layers icon to obtain the list of available layers.)

    GNSS Leveling Web Application Layers

    Source: Esri ArcGIS GNSS Leveling Web Application
    Source: Esri ArcGIS GNSS Leveling Web Application
    Source: Esri ArcGIS GNSS Leveling Web Application
    Source: Esri ArcGIS GNSS Leveling Web Application
    Source: Esri ArcGIS GNSS Leveling Web Application
    Source: Esri ArcGIS GNSS Leveling Web Application

    Source: Esri ArcGIS GNSS Leveling Web Application
    Source: Esri ArcGIS GNSS Leveling Web Application

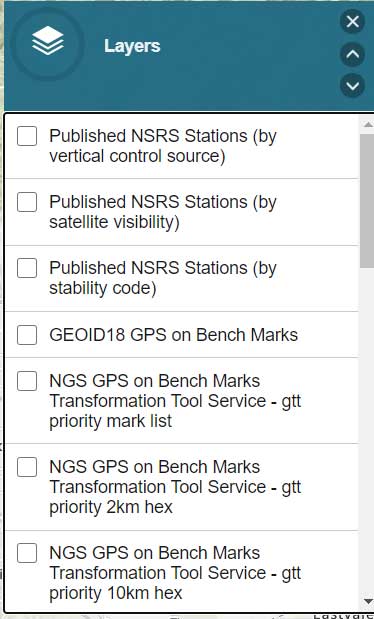
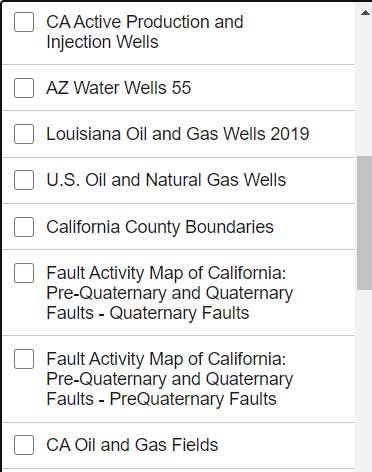
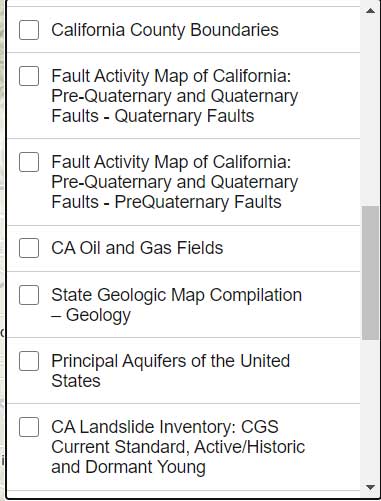
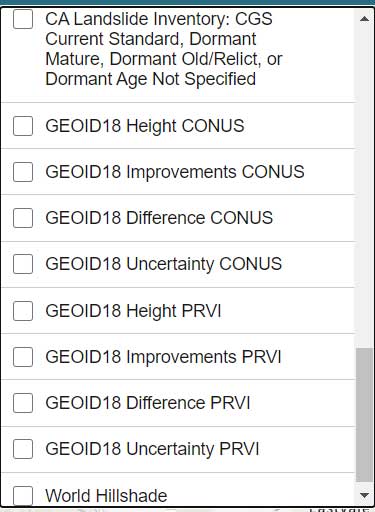
    As you can see from the list of layers, the web application enables users to select the layers that are pertinent to their survey project requirements. The application is designed for California surveyors but the concept is transferable to other States. For example, the following layers are not just for California surveyors: Arizona water wells, Louisiana oil and gas well, U.S. oil and natural gas wells, Principal Aquifers of the United States, and, of course, all of the NOAA NGS data layers.

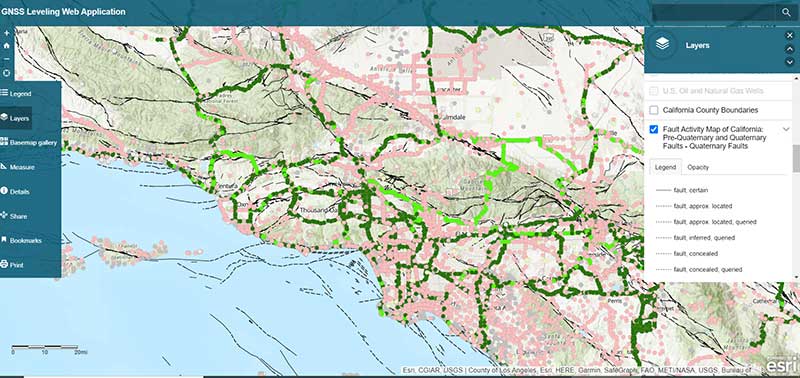
    One layer that is very important to California users is the layer that provides the fault activity in their region. The box titled “Fault Activity Map of California: Pre-Quaternary and Quaternary Faults – Quaternary Faults” depicts the list of published marks in NGS’ database with an overlay of the fault activity map.

    Fault Activity Map of California: Pre-Quaternary and Quaternary Faults — Quaternary Faults

    Source: Esri ArcGIS GNSS Leveling Web Application
    Source: Esri ArcGIS GNSS Leveling Web Application

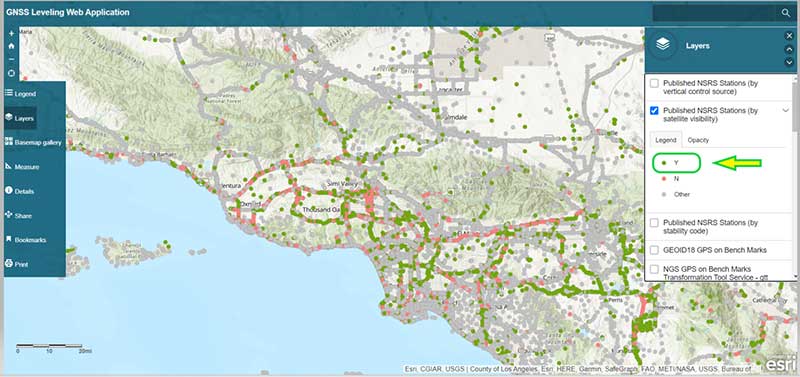
    Another great feature of the application is that it has a layer providing the satellite visibility code for published NSRS marks (see the box titled “Published NSRS Stations (by satellite visibility”). Once again, a great feature for field personnel performing reconnaissance.

    Published NSRS Stations (by satellite visibility)

    Source: Esri ArcGIS GNSS Leveling Web Application
    Source: Esri ArcGIS GNSS Leveling Web Application

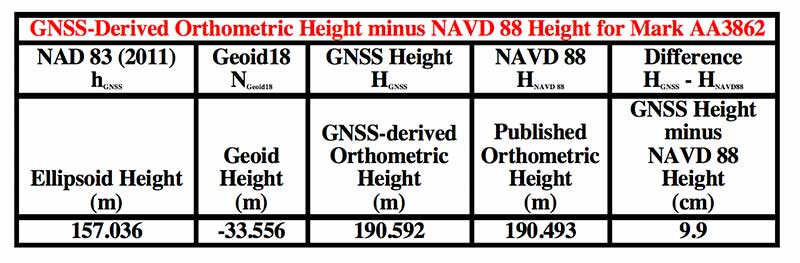
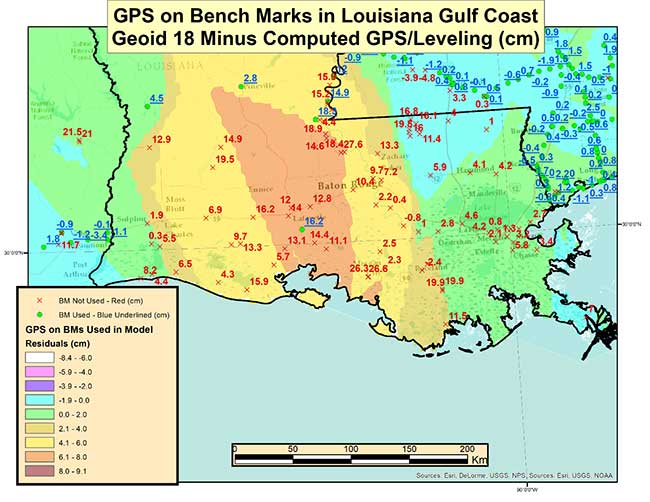
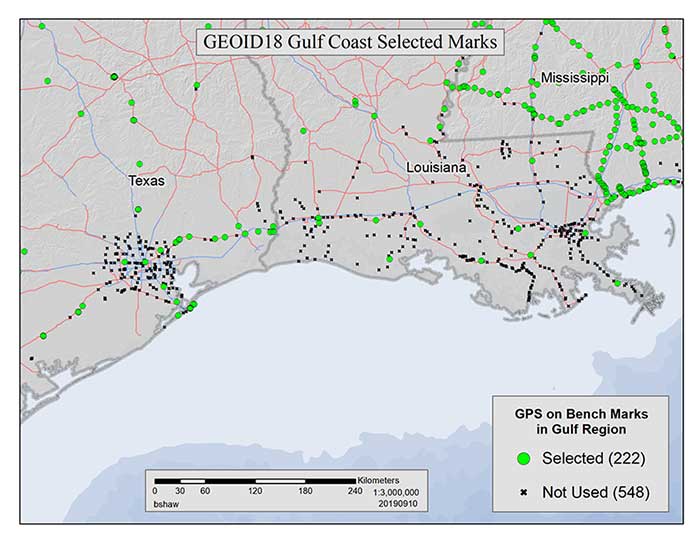
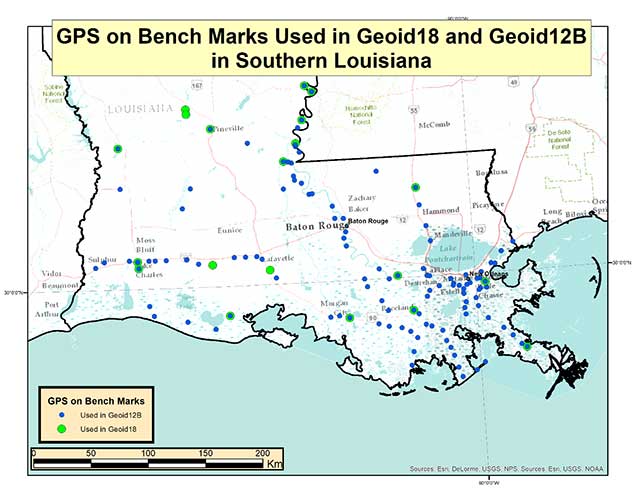
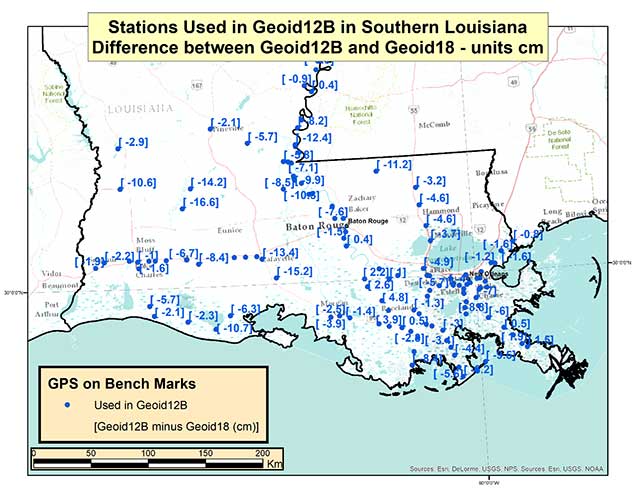
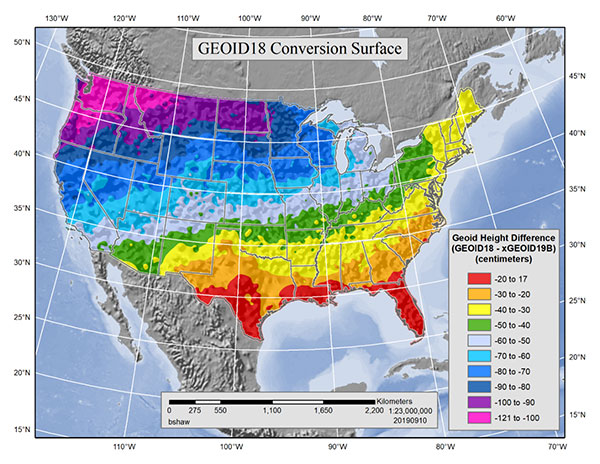
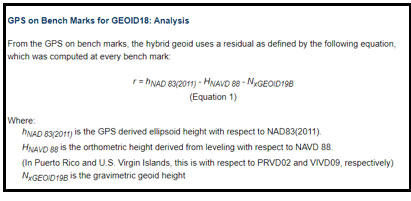
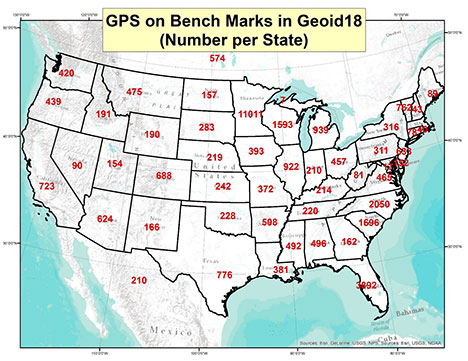
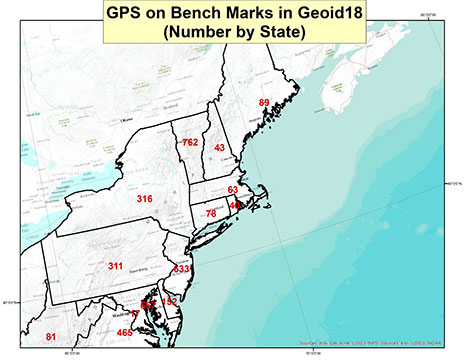
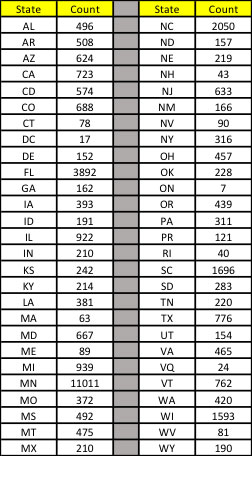
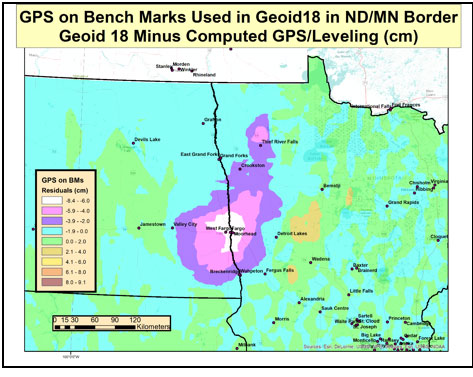
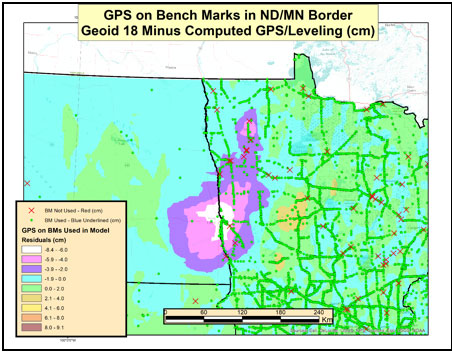
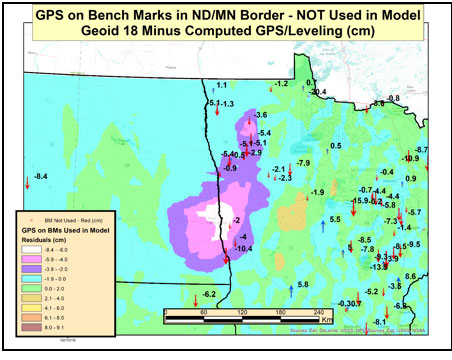
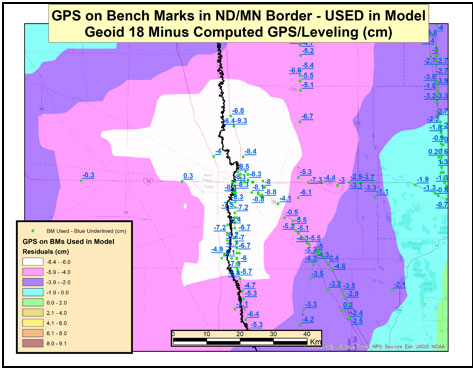
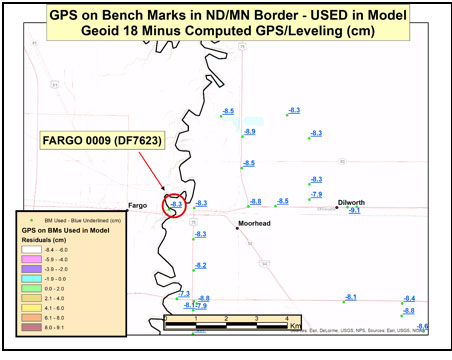
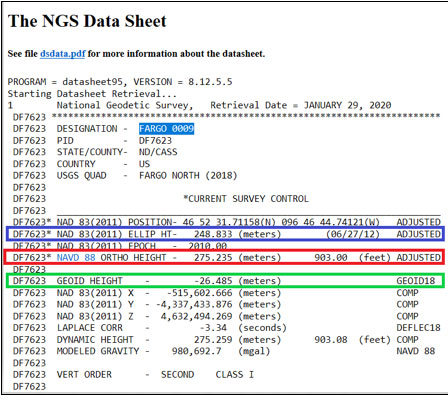
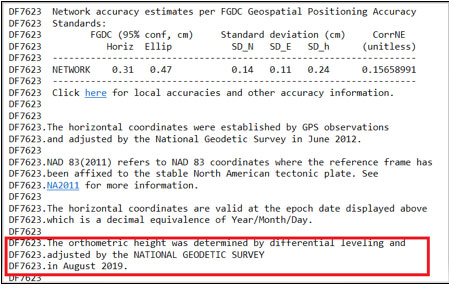
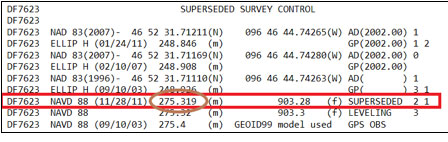
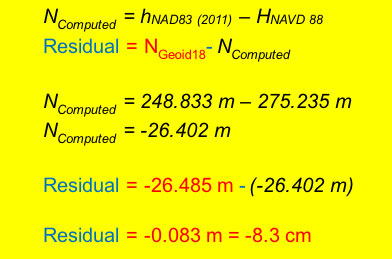
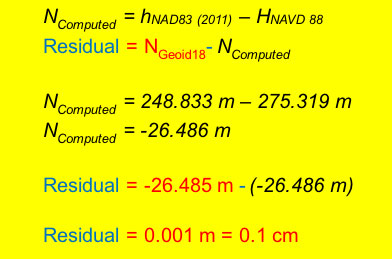
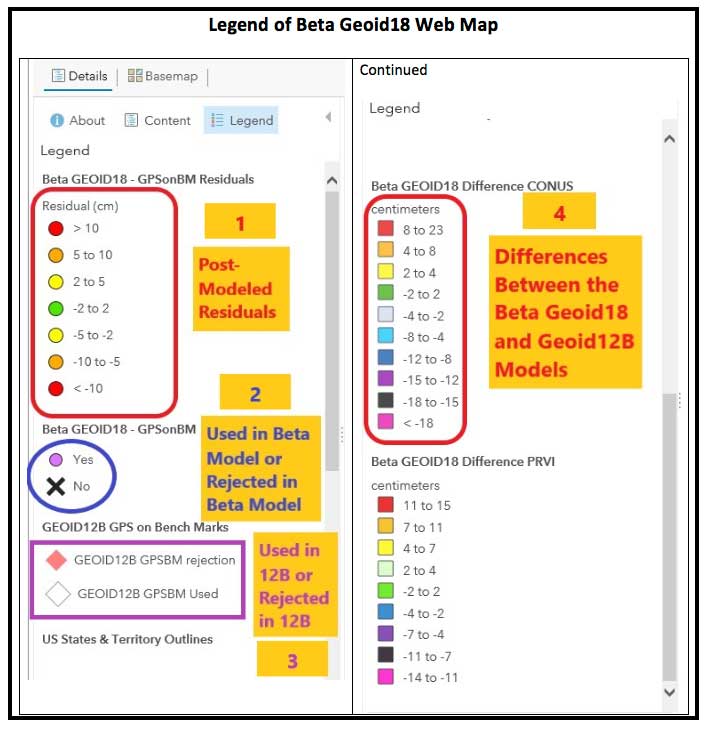
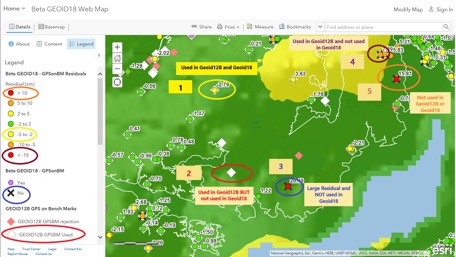
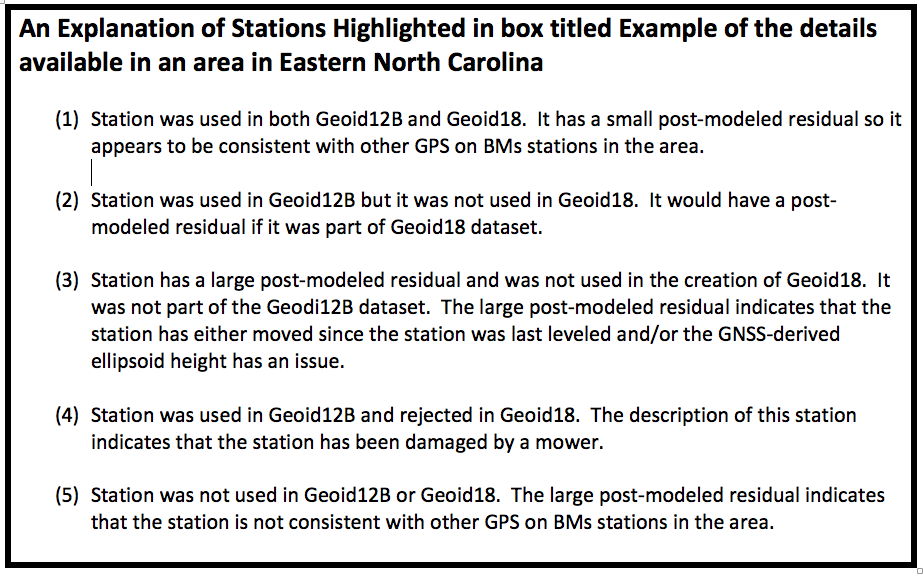
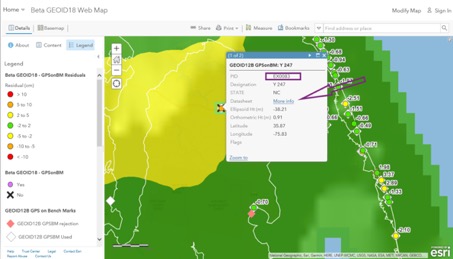
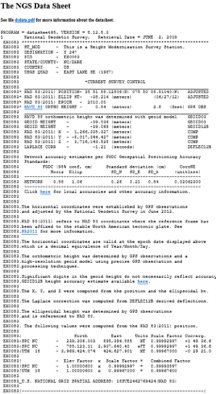
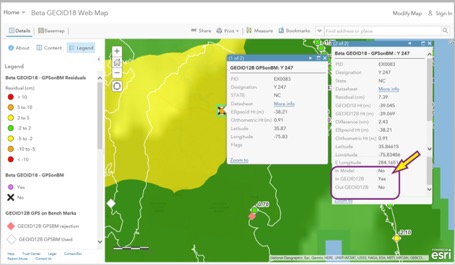
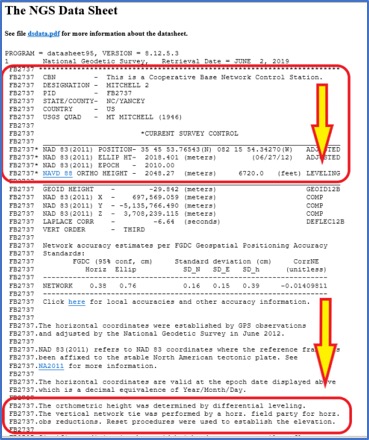
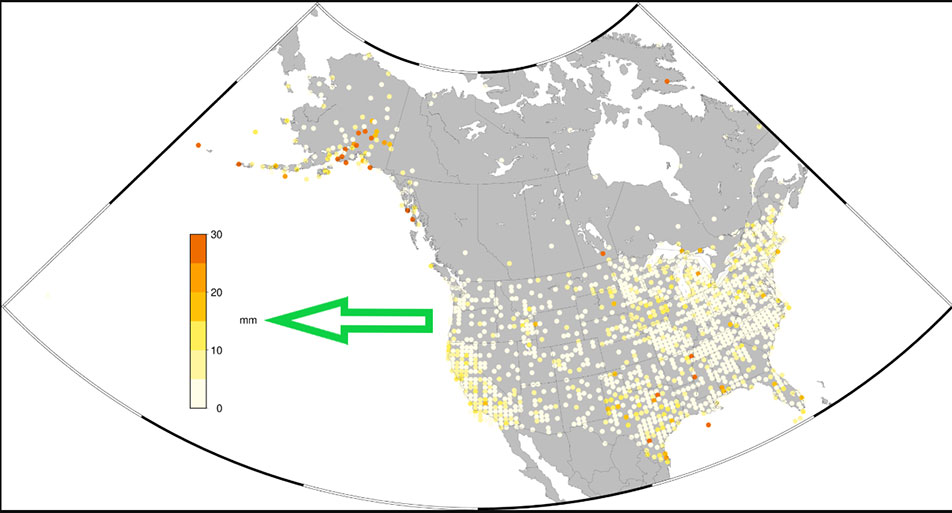
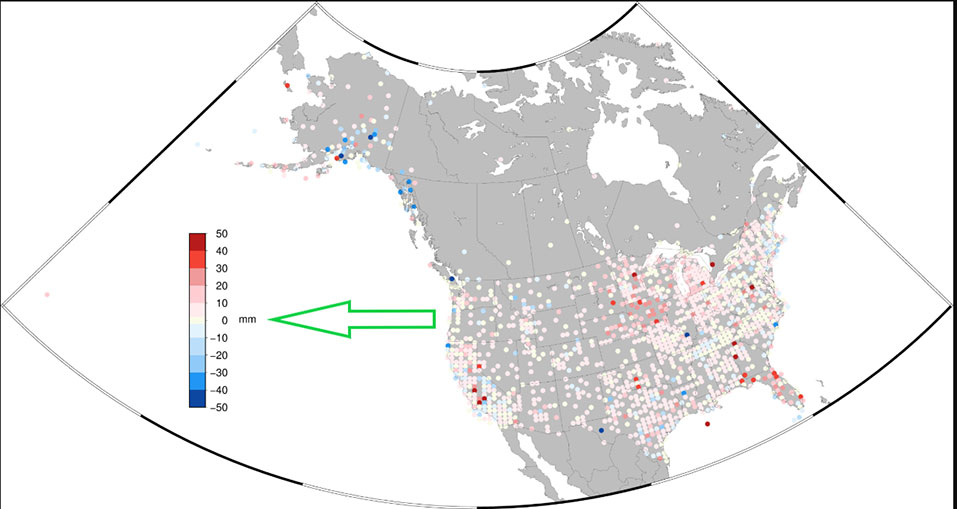
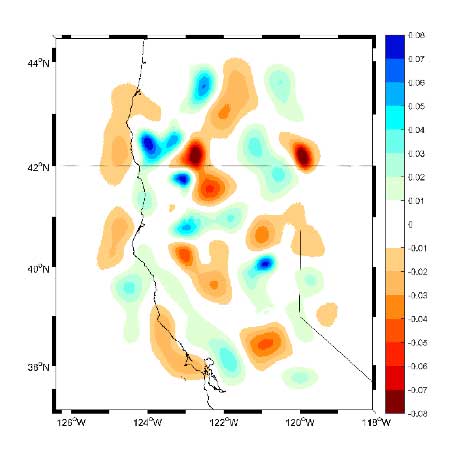
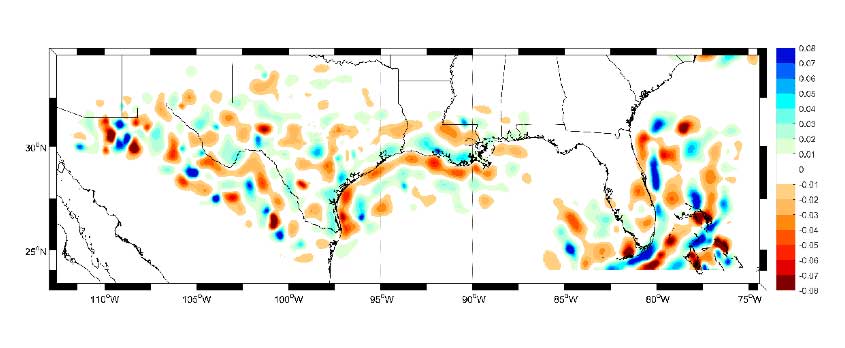
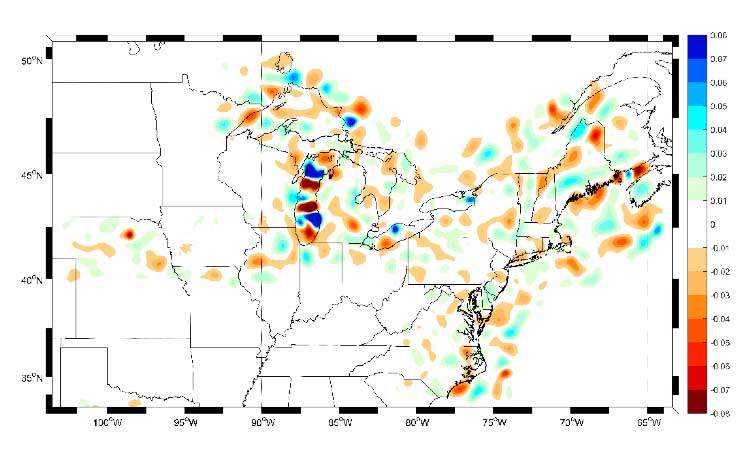
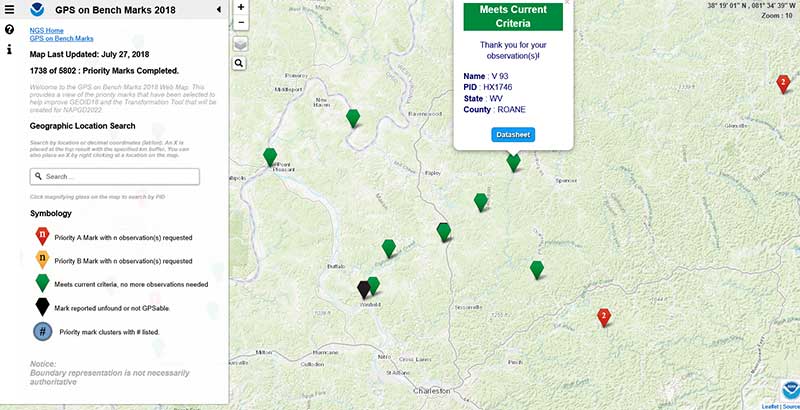
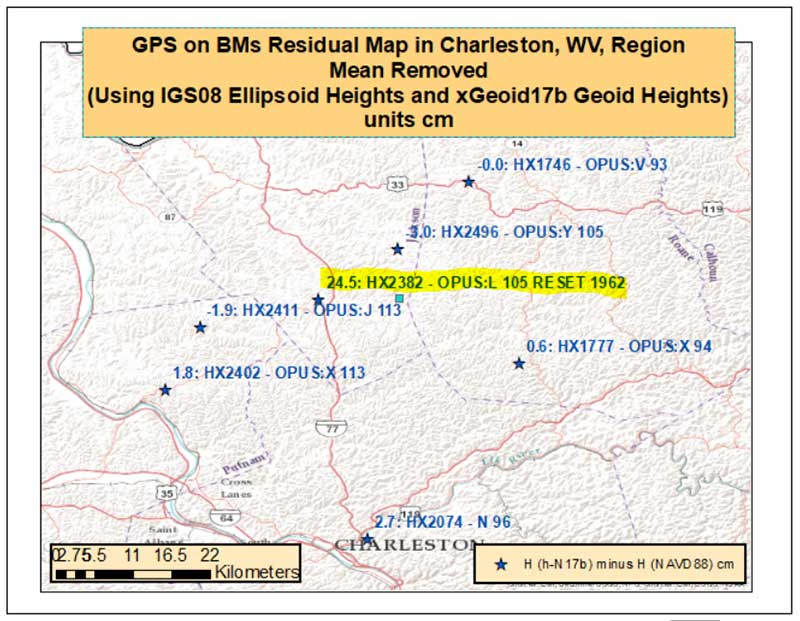
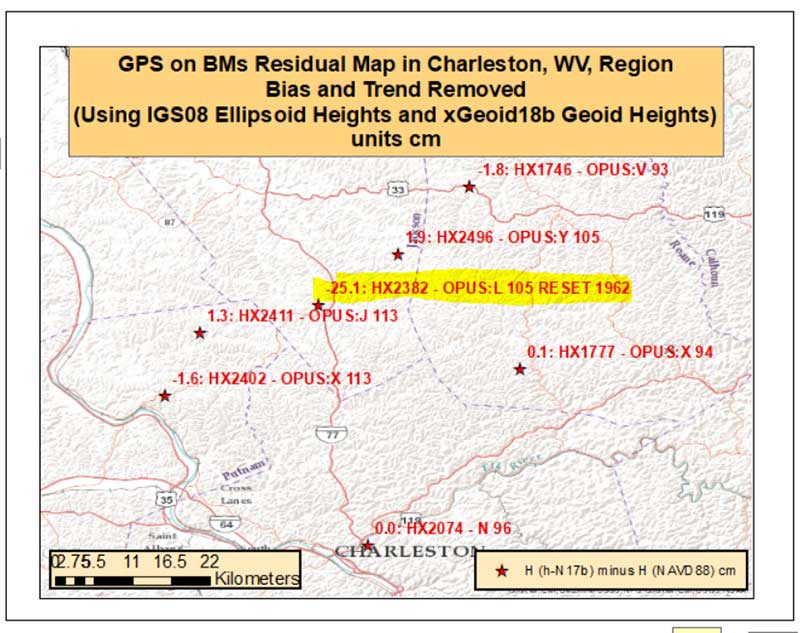
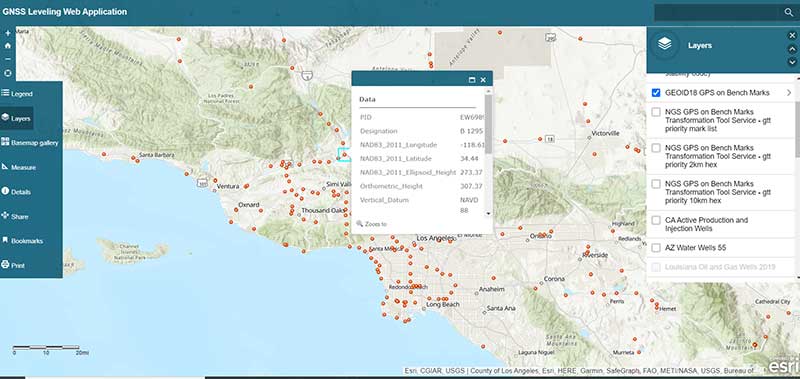
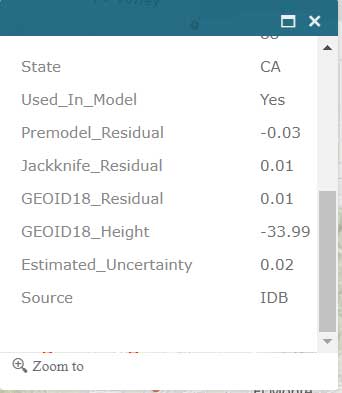
    The application also has a feature that lists the marks that were involved in the development of NGS’ hybrid geoid model GEOID18. (see the box titled “GNSS Leveling Web Application GEOID18 GPS on Bench Mark Layer”). Clicking on a mark’s icon provides information and statistics about the mark (see boxes titled “GEOID18 GPS on Bench Mark Layer — PID EW6989” and “Information for GPS on Bench Mark for PID EW6989”). This is one of the layers that provides information for the entire CONUS region. All this information is available from NGS’ website but this application incorporates all of NGS’s data as well as the local information in one application. This web application is very useful to a surveyor planning a survey project and/or providing information to a field reconnaissance team.

    GNSS Leveling Web Application GEOID18 GPS on Bench Mark Layer

    Source: Esri ArcGIS GNSS Leveling Web Application
    Source: Esri ArcGIS GNSS Leveling Web Application

    GEOID18 GPS on Bench Mark Layer — PID EW6989

    Source: Esri ArcGIS GNSS Leveling Web Application
    Source: Esri ArcGIS GNSS Leveling Web Application

    Information for GPS on Bench Mark for PID EW6989

    Source: Esri ArcGIS GNSS Leveling Web Application
    Source: Esri ArcGIS GNSS Leveling Web Application

    Source: Esri ArcGIS GNSS Leveling Web Application
    Source: Esri ArcGIS GNSS Leveling Web Application

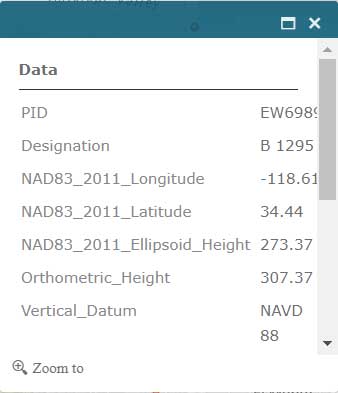
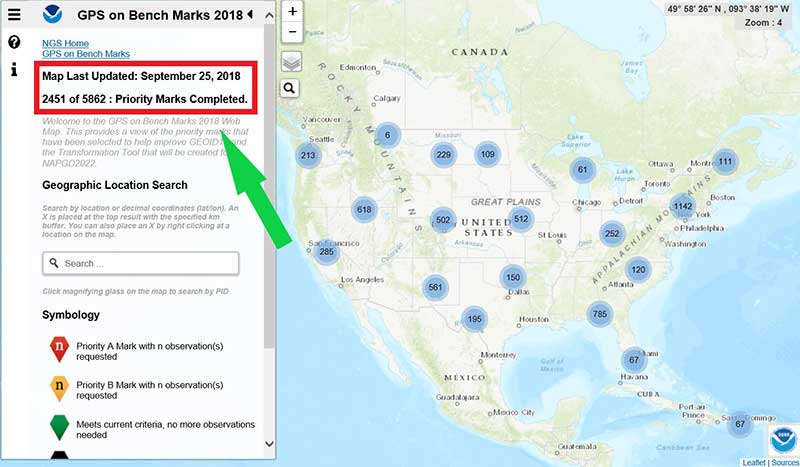
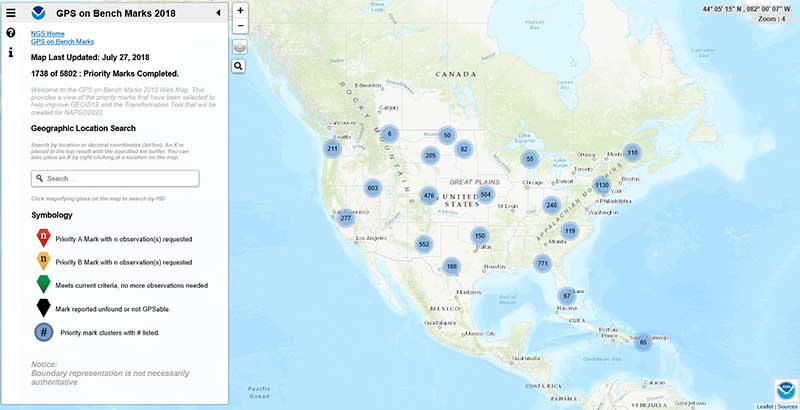
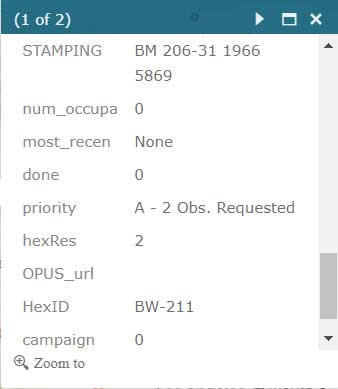
    Users that are participating in NGS’ GPS on Bench Mark program can click on the layer for “NGS GPS on Bench Marks Transformation Service Tool, priority 10 km hex” to determine marks that need to be occupied by GNSS to improve a transformation tool being developed by NGS. See boxes titled “NGS GPS on Bench Marks Transformation Service Tool, priority 10 km hex” and “Information for GPS on Bench Mark Priority List for PID EW6989.” There’s also layers that depict the priority mark list for the GPS on Bench Marks program (“NGS GPS on Bench Marks Transformation Tool Service — priority mark list”) and the 2 km hexagon priority grid (“NGS GPS on Bench Marks Transformation Tool Service — priority 2km hex”).

    NGS GPS on Bench Marks Transformation Service Tool, priority 10 km hex

    Source: Esri ArcGIS GNSS Leveling Web Application
    Source: Esri ArcGIS GNSS Leveling Web Application

    Information for GPS on Bench Mark Priority List for PID EW6989

    Source: Esri ArcGIS GNSS Leveling Web Application
    Source: Esri ArcGIS GNSS Leveling Web Application
    Source: Esri ArcGIS GNSS Leveling Web Application
    Source: Esri ArcGIS GNSS Leveling Web Application
    Source: Esri ArcGIS GNSS Leveling Web Application
    Source: Esri ArcGIS GNSS Leveling Web Application

    Source: Esri ArcGIS GNSS Leveling Web Application
    Source: Esri ArcGIS GNSS Leveling Web Application

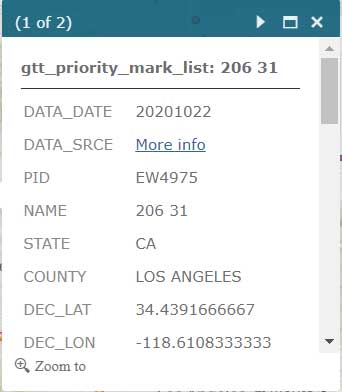
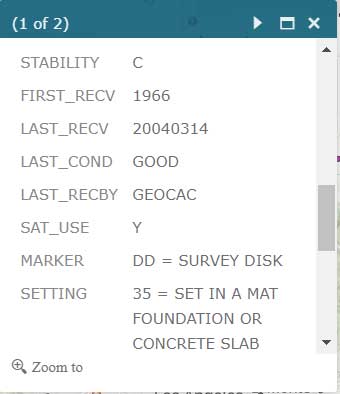
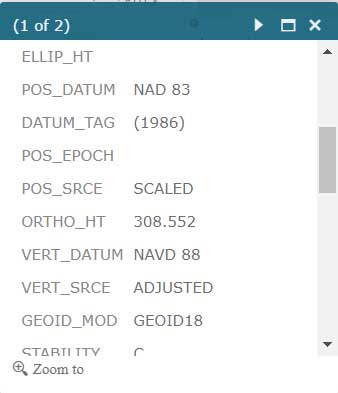
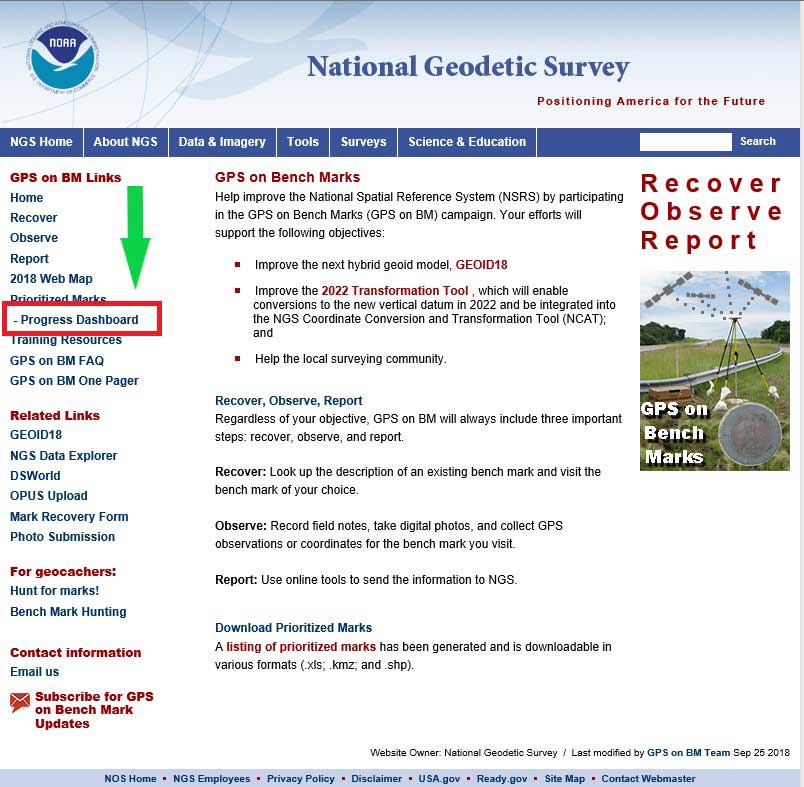
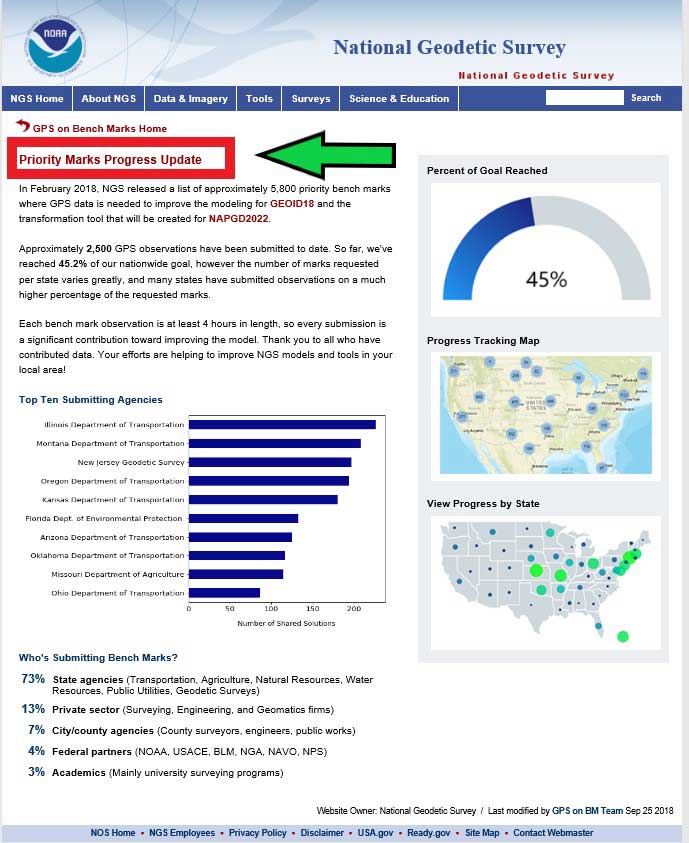
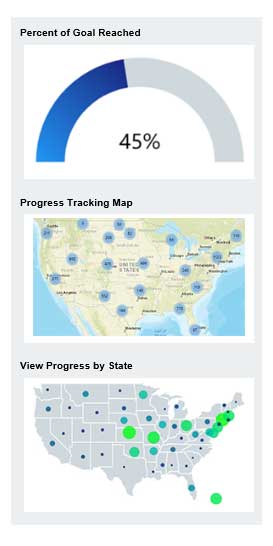
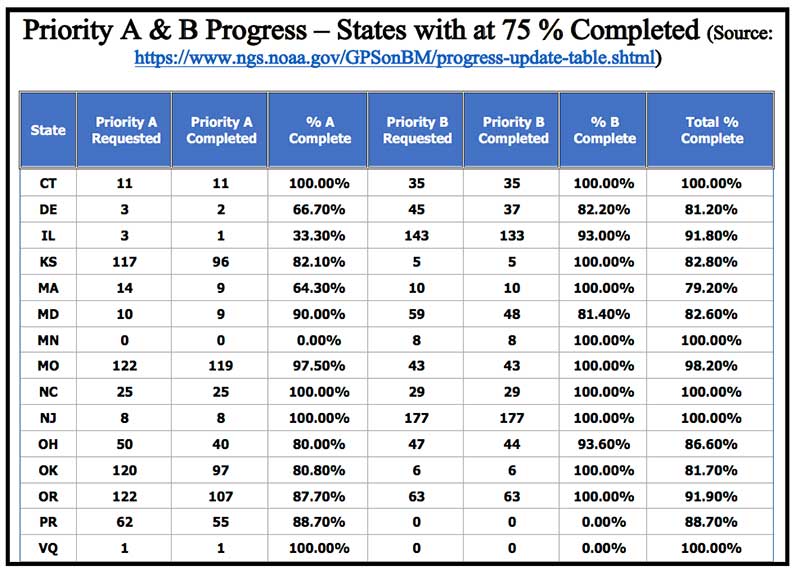
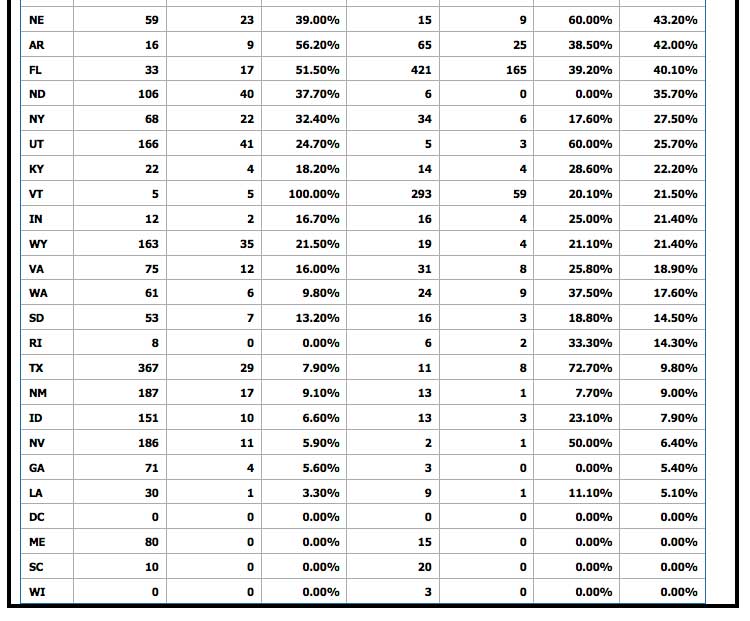
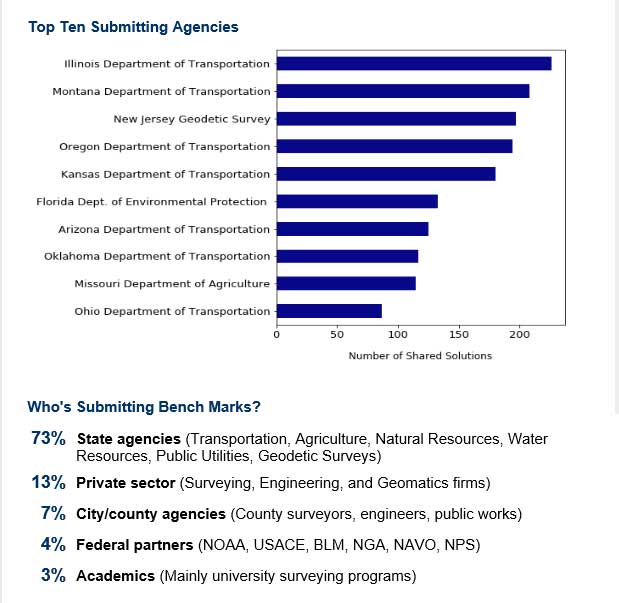
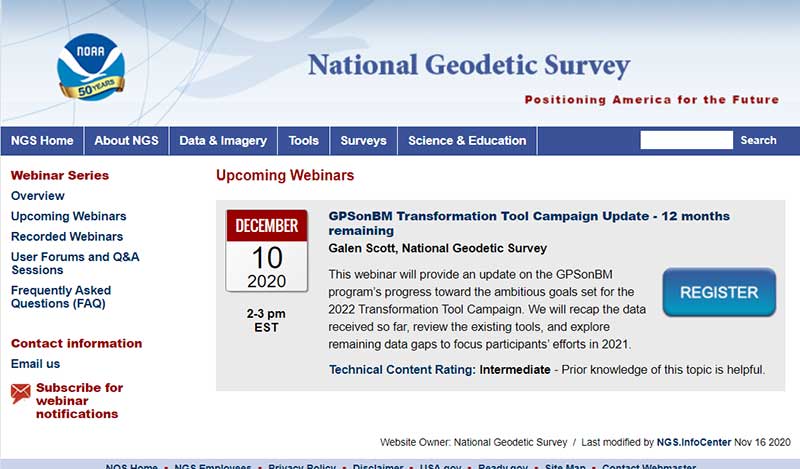
    Individuals interested in participating in NGS’ GPS on Bench Mark program should register for NGS’ Dec. 10 webinar, which will discuss the status of the program. See the box titled “GPSonBM Transformation Tool Campaign Update — 12 months remaining” for the information on the webinar. Users can register for the webinar here. I would encourage all users to access the web application tool developed by Jay and/or NGS’ website before participating in the next NGS GPS on Bench Mark webinar.

    GPSonBM Transformation Tool Campaign Update — 12 months remaining

    (NGS webinar series)

    Screenshot: National Geodetic Survey
    Screenshot: National Geodetic Survey

    Almost all of my columns have focused on establishing accurate GNSS heights. Most of my 45 years of working in the field of geodesy has been focused on heights; that is, leveling-derived orthometric heights, GNSS-derived orthometric heights, and geoid heights. Gravity is very important to estimating all of these types of heights. Recently, a colleague sent me a video proving Galileo’s famous gravity experiment. It’s an older video (November 2014), but it’s really fascinating. You can see the entire video here. Another individual pointed me toward the same experiment performed on the Moon during the Apollo 15 mission. What’s amazing to me is that over 400 years ago an individual spent time studying the effects of gravity and developing the concept of acceleration due to gravity. I wonder what the world would look like today if Galileo would have just accepted Aristotle’s theory of gravity (which states that objects fall at speed proportional to their mass) and decided to focus on other tasks. Saying that, I am amazed that most geospatial users do not realize the importance of gravity (and physical geodesy) in the development of the geospatial products and services that they use daily; and, how critical it is that more research is required to meet future geospatial needs. The advancements in satellites and computers have enabled geodesy to expand into many different disciplines. Geodetic science and technology now underpin many sciences, large areas of engineering (such as driverless vehicles and drones), navigation, precision agriculture, smart cities, cellular telephones, and location-based services. (See the GPS World First Fix column about the shortage of American geodesists).

    When I end one of my presentations, I always emphasize that Geodesy Provides the Foundation for all Geospatial Products and Services, and Integrated and Collaborative Organizations Create Geospatial Solutions. Geodesy is just as important today as it was 400 years ago.

    I hope everyone stays safe during this COVID-19 pandemic and enjoys the holidays.

  • NGS releases beta tool for obtaining geodetic information

    NGS releases beta tool for obtaining geodetic information

    NGS has developed a new beta tool for obtaining geodetic information about a passive mark in their database. This column will highlight some features (available as of Oct. 5, 2020) that may be of interest to GNSS users. It provides all of the information about a station in a more user-friendly format. The box titled “Passive Mark Lookup Tool” is an example of the webtool. The tool provides a lot of information so I have separated the output of the tool into several boxes titled “Passive Mark Lookup Tool — A through D.”

    I will highlight several attributes that I believe will be very useful to users, especially users of leveling-derived and GNSS-derived orthometric heights. I’ve highlighted several attributes in the box titled “Passive Mark Lookup Tool — A” that are important to users such as published coordinates, their datum and source, Geoid18 value, GNSS Useable, and the date of last recovery. All of these values are available on a NGS datasheet but, in my opinion, this provides the information in a more user-friendly format.

    Passive Mark Lookup Tool — A

    (https://beta.ngs.noaa.gov/datasheets/passive-marks/index.html)

    Image: National Geodetic Survey
    Image: National Geodetic Survey

    One calculation that the user can easily compute for marks that have been leveled to and occupied by GNSS equipment, is the difference between the published leveling-derived orthometric height and the computed GNSS-derived orthometric height. This may indicate that the mark has moved since the last time it was leveled to or that its height coordinate has been readjusted since the creation of the published geoid model.

    The table below provides the calculation using the data from the box titled “Passive Mark Lookup Tool — A.” The calculation [HGNSS = hGNSS — NGeoid18; Difference = HGNSS — HNAVD 88] has been described in several of my previous columns (this one, for example).

    Data: National Geodetic Survey
    Data: National Geodetic Survey

    In this example, the difference between the GNSS-derived orthometric height and the Published NAVD 88 height is 6.1 cm. NGS is looking for comments on this beta webtool so if users would like this computation added to the tool, they should send a comment to NGS using the link provided on the site (This is a beta product. NGS is interested in your feedback concerning its function and usability as well as how users would like to interact with NGS datasheet information in the future. Email us at [email protected].) So, the user should ask the question, did the station move since the last time it was leveled?

    Another attribute that would be nice to be part of this tool is which station was used to create the hybrid geoid model. As of Oct. 5, 2020, users have to go to the Geoid18 webpage to get the information. The Excel file and shapefiles provide whether the station was used to create the Geoid18 model. In the case of this example, KK1531, CHAMBERS, the mark was not used in the creation of Geoid18 so NGS felt that the station may have moved and/or the GPS on Bench Mark residual was large relative to its neighbors. See NGS’s technical report on Geoid18 for more information on the creation of Geoid18. The GPS on Bench Mark residual analysis was described in several of my previous columns (see “The differences between Geoid18 values and NAD 83, NAVD 88 values” and “NGS 2018 GPS on BMs program in support of NAPGD2022 — Part 6” for examples).

    The webtool provides a map depicting the location of the station, photos (if available), and previously published, superceded values of the mark. See the box titled “Passive Mark Lookup Tool — B.”

    Passive Mark Lookup Tool — B

    Image: National Geodetic Survey
    Image: National Geodetic Survey

    In the example of Chambers, KK1531, no photos were available. It would be helpful if a user would provide photos to NGS when visiting this station. (Note: NGS has a webtool for users to submit recovery information about a mark as well as to provide current photos of the station.) The new Passive Mark webtool also provides information about the survey projects that the mark has been involved in such as leveling and GNSS projects.

    In this example, mark CHAMBERS was leveled to in a 1984 first-order, class 2 leveling project (Leveling Line number L24838/6) and, in 1995, the mark was part of a GNSS project (GNSS Project GPS1010). It also provides all the descriptive text and recovery information (See boxes titled “Passive Mark Lookup Tool – C” and “Passive Mark Lookup Tool – D”).

    Passive Mark Lookup Tool — C

    Data: National Geodetic Survey
    Data: National Geodetic Survey

    Passive Mark Lookup Tool — D

    Image: National Geodetic Survey
    Image: National Geodetic Survey

    I want to highlight a few other attributes of this webtool. The station, PID AA3862, has an interesting attribute that users should take note of; that is, the NAD 83 (2011) position source is NO CHECK. See box titled “Passive Mark Page for PID AA3862.”

    This means that the mark’s NAD 83 (2011) coordinates were determined without redundant observations. This is not a good survey practice but there are times that a project may contain check observations for some purpose or, more likely, the mark did contain other GNSS vector but they were rejected in the final adjustment. Either way, a good survey practice would be for users to verify the coordinates of these marks before using them.

    Passive Mark Page for PID AA3862

    Data: National Geodetic Survey
    Data: National Geodetic Survey

    As previously mentioned, the tool provides the location of the station on a map and photos if they are available. This is a really nice feature for anyone searching for the mark. The map can be enlarged as well reduced by clicking on the box. See boxes titled “Passive Mark Page for PID AA3862” and “Photos of Mark PID AA3862.” The box titled “Photos of Mark PID AA3862” provides all three photos of mark PID AA3862.

    Photos of Mark PID AA3862

    Photo: National Geodetic Survey
    Photo: National Geodetic Survey
    Photo: National Geodetic Survey
    Photo: National Geodetic Survey

    Photo: National Geodetic Survey
    Photo: National Geodetic Survey

    It should be noted, according to the Geoid18 GPS on BMs dataset that users can download, this station, AA3862, was not used in the creation of Geoid18. The table below provides the difference between the GNSS-derived orthometric height and the published NAVD 88 height.

    In this example, the difference between the GNSS-derived orthometric height and the published NAVD 88 height is 9.9 cm. Also, the webtool provides the network accuracy values for the station. In this example, the horizontal network accuracy is 20.65 cm and the vertical network accuracy value is 14.50 cm (see highlighted values in box titled “Passive Mark Page for PID AA3862”). These are very large network accuracy values. This should be a flag to anyone that is using this station as control.

    Data: National Geodetic Survey
    Data: National Geodetic Survey

    As I previously mentioned, as a beta site, users should verify all information from the site. NGS is requesting feedback on this tool so they can improve it and make it an operational webtool. I encourage everyone to access the tool and check out a few of their favorite marks, and then send an email to NGS informing them of what you like, what you would like to change, and what you would like to see added to the tool.

    NGS is releasing this tool as a beta product to get feedback from users. As NGS states in the heading of the tool, they are interested in your feedback concerning its function and usability as well as how users would like to interact with NGS datasheet information in the future. Email NGS at [email protected].

    One last item that may be of interest to GNSS users is that NGS, working with the University Corporation for Atmospheric Research (UCAR), developed another online GNSS lesson (see box titled “New GNSS Lesson by NGS and UCAR”). These lessons are free but users must sign up to access the website and lesson.

    New GNSS Lesson by NGS and UCAR

    Image: National Geodetic Survey
    Image: National Geodetic Survey
  • The differences between published Geoid18 and Geoid12B values in Southern Louisiana

    The differences between published Geoid18 and Geoid12B values in Southern Louisiana

    My February 2020 column provided an analysis of the differences between the latest published hybrid Geoid18 values provided on NGS’ Datasheet and the computed geoid height value using the published NAD 83 (2011) ellipsoid height and NAVD 88 orthometric height. The column highlighted issues on differences due to published heights that have changed since the database pull for Geoid18. It mentioned that future columns will address differences in other portions of CONUS. This column will focus on differences between published Geoid18 values and Geoid12B values in Southern Louisiana. Why are users seeing large differences between the two models?

    My last column mentioned that the technical report on Geoid18 provided a good explanation on the stations used in the United States Gulf Coast region. See box titled “GPS on Bench Marks for GEOID18 in the Gulf Coast Region.”

    GPS on Bench Marks for GEOID18 in the Gulf Coast Region

    (https://www.ngs.noaa.gov/GEOID/GEOID18/geoid18_tech_details.shtml)

    There are areas of complex vertical crustal motion in the Texas/Louisiana Gulf Coast region of the United States which render many control station elevations in the region invalid. The selection of GPS on Bench Marks in this region was limited to the small number of marks where the leveling and GPS data agreed to minimize the influence of crustal motion in the hybrid geoid model. Figure 1 depicts the selection of stations used in the hybrid geoid model along the Texas/Louisiana Gulf Coast. (Image: National Geodetic Survey)
    Figure 1: GEOID18 Gulf Coast selected marks: There are areas of complex vertical crustal motion in the Texas/Louisiana Gulf Coast region of the United States which render many control station elevations in the region invalid. The selection of GPS on Bench Marks in this region was limited to the small number of marks where the leveling and GPS data agreed to minimize the influence of crustal motion in the hybrid geoid model. Figure 1 depicts the selection of stations used in the hybrid geoid model along the Texas/Louisiana Gulf Coast. (Image: National Geodetic Survey)

    As highlighted in the last column, very few stations in Southern Louisiana were used in the creation of the Geoid18 hybrid geoid model. As provided in my last column the box titled “Differences on GPS on Bench Marks in the Gulf Coast Region” depicts the differences between the published Geoid18 value and the computed geoid value using the latest NAD 83 (2011) ellipsoid and NAVD 88 orthometric height.

    Differences on GPS on Bench Marks in the Gulf Coast Region

    Image: National Geodetic Survey
    Image: National Geodetic Survey

    The plot indicates that there are many large differences. Many of these differences are to be expected because the Southern Louisiana is an area of known crustal movement. NGS recognizes this and includes the statement below on datasheets for stations published in Southern Louisiana (see box titled “Statement on NGS Datasheet for Stations in Southern Louisiana”).

    Statement on NGS Datasheet for Stations in Southern Louisiana

    This station is in an area of known vertical motion. Due to the variability of land subsidence, uplift, and crustal motion, NGS has, determined the orthometric heights for marks in these suspect subsidence areas should be considered valid only at the epoch date associated with the orthometric height. These heights must always be validated when used as control. All previously superseded orthometric heights are now considered suspect and are available in the superseded section. NGS does not recommend using suspect or superseded heights as control.

    As stated above, Southern Louisiana is an area of crustal movement. There have been many reports that have described the crustal movement in this region. A few examples include “Vulnerability of Louisiana’s coastal wetlands to present-day rates of relative sea-level rise,” “A New Subsidence Map for Coastal Louisiana,” “Spatio-temporal Modeling of Louisiana Land Subsidence Using High-resolution Geo-spatial Data,” “Anthropogenic and geologic influences on subsidence in the vicinity of New Orleans, Louisiana” and “Rates of Vertical Displacement at Bench Marks in the Lower Mississippi Valley and the Northern Gulf Coast.” The figure in the box title “Figure 1 from A New Subsidence Map for Coastal Louisiana,” from a 2017 report, provides an estimate of the subsidence in coastal Louisiana.

    Looking at the figure indicates that there is a significant variation of subsidence occurring in coastal Louisiana. The legend indicates that the subsidence rates range between 0.6 to 1.2 cm/year.

    Figure 1 from A New Subsidence Map for Coastal Louisiana

    (https://www.geosociety.org/gsatoday/groundwork/G337GW/GSATG337GW.pdf)

    Image: National Geodetic Survey
    Image: National Geodetic Survey

    The box titled “Excerpt from Anthropogenic and Geologic Influences on Subsidence in the Vicinity of New Orleans, Louisiana” depicts estimates of crustal movement between 2009 and 2012 in the vicinity of New Orleans. Several of the areas in the plot indicate subsidence rates exceeding -1 cm/year. Once again, the figure shows the local variability of subsidence rates.

    Excerpt from Anthropogenic and Geologic Influences on Subsidence in the Vicinity of New Orleans, Louisiana

    Check out page 5 of this PDF.

    Last year, NGS performed the Multi-Year CORS Solution 2 (MYCS2). This was described in previous columns, which can be viewed here and here. The MYCS2 process generated computed and modeled velocities for CORSs. The box titled “CORS NAD83 (2011) Vu Velocities” is a plot that depicts the velocities in the “upward” component in cm/year for NOAA CORS that are operational and have a computed velocity in Southern Louisiana. So, what does this mean to estimating a hybrid geoid model in Southern Louisiana?

    CORS NAD83 (2011) Vu Velocities

    Image: National Geodetic Survey
    Image: National Geodetic Survey

    The plot indicates that the rates vary from -0.1 cm to -0.8 cm. It should be noted that these stations are CORS and they are typically installed on structures that may not capture the entire amount of subsidence at the land surface. The box titled “CORS Position and Velocity for Station GRIS” provides an example of a CORS sheet from NGS CORS website.

    CORS Position and Velocity for Station GRIS

    (https://www.ngs.noaa.gov/cgi-cors/CorsSidebarSelect.prl?site=gris&option=Coordinates14)

    Data: National Geodetic Survey
    Data: National Geodetic Survey

    Now, let’s look at differences between Geoid12B and Geoid18 in Southern Louisiana. The box titled “GPS on Bench Marks Used in Geoid18 and Geoid12B” depicts the stations used in Geoid12 and those used in Geoid 18. As indicated in the plots, there were a lot more stations used in the generation of the Geoid12B model than those used to create the Geoid18 model.

    GPS on Bench Marks Used in Geoid18 and Geoid12B

    Photo: National Geodetic Survey
    Photo: National Geodetic Survey

    The box titled “Differences between Geoid12B and Geoid18 in Southern Louisiana” provides the values of Geoid12B minus Geoid18 in centimeters on the GPS in Bench Mark stations used in Geoid12B.

    Differences between Geoid12B and Geoid18 in Southern Louisiana

    Photo: National Geodetic Survey
    Photo: National Geodetic Survey

    As indicated in the plot, there are some large differences between Geoid12B and Geoid18 values; a few differences exceed 15 centimeters. Based on the previous discussion of crustal movement in Southern Louisiana, this probably shouldn’t come as a surprise. The box titled “Differences between Geoid12B and Geoid18 with Vu Velocity Values” depicts the differences in the hybrid geoid models and the NAD83 (2011) CORS Vu rate.

    Differences between Geoid12B and Geoid18 with Vu Velocity Values

    Photo: National Geodetic Survey
    Photo: National Geodetic Survey

    The box titled “Differences between Geoid12B and Geoid18 in Lafayette, Louisiana” depicts the differences in the two hybrid geoid models and the NAD83 (2011) CORS Vu rate values in the Lafayette, Louisiana, region. This region has some of the largest differences between Geoid12B and Geoid18 values in Southern Louisiana. As indicated in the plot, CORS station TONY has a Vu rate of -0.8 cm/year which is fairly large, and the differences between Geoid12B and Geoid18 values are fairly large at the -10 to -15 cm level. Once again, users should expect differences between the two hybrid geoid models because there has been movement in the area and because different GPS on Bench Mark stations were used in the generation of the hybrid geoid models. In the Lafayette region the two stations used in the generation of Geoid18 were not used in Geoid12B (see stations highlighted in a box).

    Differences between Geoid12B and Geoid18 in Lafayette, Louisiana

    Photo: National Geodetic Survey
    Photo: National Geodetic Survey

    The box titled “Differences between Geoid12B and Geoid18 in New Orleans, Louisiana” depicts the differences in the hybrid geoid models and the NAD83 (2011) CORS Vu rate values in the New Orleans, Louisiana, region. Two of the same stations that were used in the development of Geoid12B and Geoid18 are highlighted with a box. The difference between the two geoid model values are much less in this region compared with the Lafayette region. The CORS Vu velocities are also less than the CORS station (TONY) value in Lafayette. Saying that, the differences on stations not used in Geoid18 have differences ranging from -4 to -8 cm going southward toward the Gulf of Mexico. Once again, Southern Louisiana is subsiding so these differences are not surprising.

    Differences between Geoid12B and Geoid18 in New Orleans, Louisiana

    Photo: National Geodetic Survey
    Photo: National Geodetic Survey

    This means if someone uses NGS’ OPUS web tool to compute a GNSS-derived orthometric height, the NAVD 88 GNSS-derived orthometric height could be significantly different than the published stations in this region. Some of the difference could be due to the difference between the Geoid12B and Geoid18 published values, and some could be due to crustal movement in Southern Louisiana. Saying that, I mentioned in my last column that NGS performed a large GNSS network project in Southern Louisiana in 2016. The GNSS-derived ellipsoid heights were loaded in NGS’ database in March 2019, but the GNSS-derived orthometric height from the 2016 project are not yet finalized so they have not been loaded into NGS’ database. Once finalized and loaded into the database, the 2016 GNSS-derived orthometric heights should be more consistent with GNSS-derived orthometric heights estimated using the NGS’ OPUS web tool. This column focused on differences between published Geoid18 values and Geoid12B values in Southern Louisiana. It provided reasons why users may see large differences between the two models.

  • The differences between Geoid18 values and NAD 83, NAVD 88 values

    The differences between Geoid18 values and NAD 83, NAVD 88 values

    My last column, December 2019, highlighted the National Geodetic Survey’s (NGS) new Geoid Monitoring Service (GeMS); and, that NGS’ will be publishing a gridded geoid model GEOID2022 that will contain two components: (1) Static Geoid model of 2022 (SGEOID2022) and (2) Dynamic Geoid model of 2022 (DGEOID2022). That’s what going to happen in 2022, but what about today? Since GEOID18 has been officially released for public use, it’s time to look at differences between the Geoid18 published value and estimated geoid values computed using information from NGS’ datasheet. This column will provide an analysis of the differences between the latest published hybrid Geoid18 values provided on NGS’ Datasheet and the computed geoid height value using the published NAD 83 (2011) ellipsoid height and NAVD 88 orthometric height. This is what a user will see if they computed differences using NGS’ datasheets published values. The question will always be asked, why is there a difference between the published Geoid18 value and the computed geoid value. This column will explain some reasons for the differences.

    It’s mostly good news but there are some issues that should be highlighted. This column will highlight issues on differences due to published heights that have changed since the database pull for Geoid18.

    First, it should be noted that NGS’ hybrid geoid models are different than NGS’ experimental gravimetric geoid models. My December 2018 column explains these differences.

    I would like to emphasize that, in my opinion, hybrid geoid models should be denoted as transformation models. Saying that, hybrid geoid models are related to “real” geoid models. Hybrid geoid model GEOID18 was computed based on NGS’ gravimetric geoid model xGeoid19b; therefore, GEOID18 is related to a gravimetric geoid model but its function is to estimate GNSS-derived orthometric heights consistent with NAVD 88 heights. As described in my previous columns, the GPS on Bench Marks (GPSBMs) data provide an estimate of the geoid height ‘N’ by differencing the ellipsoidal height ‘h’ from the orthometric height ‘H’: (N = h – H). These differences are then compared to the gravimetrically-derived geoid model. The box titled “Excerpt from Geoid18 Website Technical Details” provides a summary of the process from NGS Geoid18 web page technical details document.

    The figure in the box titled “GEOID18 Conversion Surface in cm” is the surface that represents the difference between NAVD 88 as a datum and the geopotential (geoid) surface used in the gravimetric geoid. This is the difference between the hybrid geoid and the gravimetric geoid with respect to NAD83 (GEOID18 – xGEOID19B). This surface has three essential components: a bias, a continental tilt, and local warping from the bench marks.

    Excerpt from Geoid18 Website Technical Details

    (https://www.ngs.noaa.gov/GEOID/GEOID18/geoid18_tech_details.shtml)

    Data: National Geodetic Survey
    Data: National Geodetic Survey

    Hybrid Geoid Model Construction
    The residuals obtained in equation 1 are contaminated with a continential tilt and bias that is estimated and removed with a simple two-dimensional planar surface. The bias-free and tilt-free residuals are ultimately used to determine a mathematical model using least squares collocation (LSC) and multiple Gaussian functions to describe the behavior seen at the bench marks. Once the relationship between the points is modeled, the model is used to generate a 1 arcminute regular grid for interpolation purposes. Figure 2 shows the final conversion surface. This surface represents the difference between NAVD 88 as a datum and the geopotential (geoid) surface used in the gravimetric geoid. This is the difference between the hybrid geoid and the gravimetric geoid with respect to NAD83 (GEOID18 – xGEOID19B). This surface has three essential components: a bias, a continental tilt, and local warping from the bench marks.

    GEOID18 Conversion Surface in cm

    Image: National Geodetic Survey
    Image: National Geodetic Survey

    Looking at the figure in the box, the bias and tilt between the hybrid geoid model (Geoid18) and the experimental gravimetric geoid model (xGeoid19b) are fairly obvious. It’s the local warping from the bench mark data that may cause some issues to surveyors or, at least at a minimum, raise some concerned by surveyors. The box titled “Plot of the GPS on Bench Marks Involved in Geoid18” provides a plot of the GPS on Bench Marks (GPSBMs) used in the generation of Geoid18. Users can download the list of GPSBMs stations from the NGS Geoid18 website. There were 32,357 stations used to generate the model. This was an increase of approximately 6,800 stations (26%) over the hybrid geoid model Geoid12B.

    Plot of the GPS on Bench Marks Involved in Geoid18

    Image: National Geodetic Survey
    Image: National Geodetic Survey

    The boxes titled “Number of GPS on Bench Mark Stations by State” and “Number of GPS on Bench Mark Stations by State in Northeast U.S.” provide the number of data points per state.

    Number of GPS on Bench Mark Stations by State

    Image: National Geodetic Survey
    Image: National Geodetic Survey

    Number of GPS on Bench Mark Stations by State in Northeast U.S.

    Image: National Geodetic Survey
    Image: National Geodetic Survey

    The box titled “Table of Number of Data Points per State” provides the number of stations per State in tabular form.

    Table of Number of Data Points per State

    Data: National Geodetic Survey
    Data: National Geodetic Survey

    The box titled “Summary of Overall fit of Geoid18” provides a summary of the fit of residuals of Geoid18 from the NGS GEOID18 technical details document. Looking at the CONUS overall values, the standard deviation is very low 1.27 cm which is a little better than Geoid12B (1.7 cm). It should be noted that there are some large outliers (minimum value of -10.12 cm and maximum value of 8.17 cm).

    Summary of Overall fit of Geoid18

    (https://geodesy.noaa.gov/GEOID/GEOID18/geoid18_tech_details.shtml)

    Data: National Geodetic Survey
    Data: National Geodetic Survey

    For this column, the file of bench marks provided on the NGS Geoid18 web page were combined with the published ellipsoid, orthometric, and Geoid18 heights from NGS’ datasheet. The difference between the published geoid height (Geoid18) and the estimated geoid height [published NAD 83 (2011) ellipsoid height minus NAVD 88 orthometric height] was computed using the following formula:

    Data: National Geodetic Survey
    Data: National Geodetic Survey

    The box titled “Plot of Differences Based on GPS on Bench Marks Used in Geoid18” depicts these differences based on the stations used to generate Geoid18.

    Plot of Differences Based on GPS on Bench Marks Used in Geoid18

    Image: National Geodetic Survey
    Image: National Geodetic Survey

    Most of the values depicted on the plot are within the +/- 2 cm which is what you’d expect because the standard deviation of the overall fit is 1.4 cm. One to two centimeters is a very reasonable difference between the modeled and computed values. The question someone may ask is, I thought the model should be good to 1.4 cm so why are there large residual values on the map? There are several reasons why some of these differences are large but each case needs to be investigated to determine why they are large. This column will address one region as an example and provide a method for others to investigate differences in their area of interest.

    The box titled “Plot of GPS on Bench Mark Differences at the ND/MN Border” depicts a very large difference between the modeled geoid model and the estimated geoid height along the ND/MN border. As indicated in the box, the difference exceeds 6 cm.

    Plot of GPS on Bench Mark Differences at the ND/MN Border

    Image: National Geodetic Survey
    Image: National Geodetic Survey

    The box titled “Plot of GPS on Bench Mark Stations in the ND/MN Border Region” depict the bench marks involved in the development of Geoid18. The green circles represent the GPSBMs stations used in the creation of Geoid18 and the red “x” denote the stations that were not used in the creation of the model. As indicated in the plot, there were a lot of GPSBMs stations in the State of Minnesota (11,011).

    Plot of GPS on Bench Mark Stations in the ND/MN Border Region

    Image: National Geodetic Survey
    Image: National Geodetic Survey

    The box titled “Differences on GPS on Bench Marks in ND/MN Border — NOT Used in Model” depict the values of the rejected GPS on BMs stations. These stations were not used to create the hybrid geoid model Geoid18. As the plot indicates there are several large differences. This is not really surprising since these stations were not used in the model.

    Differences on GPS on Bench Marks in ND/MN Border — NOT Used in Model

    Image: National Geodetic Survey
    Image: National Geodetic Survey

    The box titled “Differences on GPS on Bench Marks in ND/MN Border — USED in Model” depict the values of the GPS on BMs stations used to create the Geoid18 model. Some of these differences exceed 8 cm. You would expect these differences to be small since these stations were used to create the model. So, why are there large post-modeled residuals in the Fargo, ND, region of the United States?

    Differences on GPS on Bench Marks in ND/MN Border – USED in Model

    Image: National Geodetic Survey
    Image: National Geodetic Survey

    In August 2019, NGS performed a large leveling network adjustment in the Minnesota. The adjustment was performed after the Geoid18 database pull. The adjustment resulted in a 7- to 9-cm bias between the published height values and the superseded values. The August 2019 Minnesota leveling network adjustment heights were not used in the creation of Geoid18. The post-modeled differences presented in this column were generated using the published NAD 83 (2011) ellipsoid heights and current NAVD 88 orthometric heights from the NGSIDB. It was determined by NGS that the differences in the Fargo region were mostly due to crustal movement. Therefore, since the differences were due to movement, secondary adjustments will need to be performed to feather the 7- to 9-cm differences to maintain consistency between published NAVD 88 heights in the region. The secondary adjustments have not been completed as of the publication of this column so the residuals west of Fargo in North Dakota are small. These values will change after the secondary adjustment is completed and loaded into NGS’ database.

    As an example, I’ve highlighted the station Fargo 0009 (PID DF7623) in the area of Fargo, North Dakota (see box titled “Differences on GPS on Bench Marks Near Fargo, ND”). The difference (-8.3 cm) is between the published Geoid18 value and the computed geoid value using the published ellipsoid height and orthometric height from the NGS’ datasheet. The box titled “Excerpt from Datasheet for Station Fargo 0009 (DF7623)” provides the information from NGS datasheet for station Fargo 0009; the information used in the computations are highlighted in the box. The box titled “Computation of the Difference between the Modeled Geoid Value (Geoid18) and the Computed Geoid Value for Fargo 0009” provides the process used to compute all differences for this column.

    Differences on GPS on Bench Marks Near Fargo, North Dakota

    Image: National Geodetic Survey
    Image: National Geodetic Survey

    Excerpt from Datasheet for Station Fargo 0009 (DF7623)

    Data: National Geodetic Survey
    Data: National Geodetic Survey
    Data: National Geodetic Survey
    Data: National Geodetic Survey
    Data: National Geodetic Survey
    Data: National Geodetic Survey

    Computation of the Difference between the Modeled Geoid Value (Geoid18) and the Computed Geoid Value for Fargo 0009
    (Information from NGS Published Datasheet)

    Data: National Geodetic Survey
    Data: National Geodetic Survey

    So, why is this difference so large in this region? A stated above, NGS performed a readjustment in this region and superseded the heights that were used in the creation of the Geoid18 hybrid model. The Geoid18 hybrid model used the previously published orthometric heights, now provided in the superseded section of the NGS datasheet, because that was the current published height at the time of the data pull for the Geoid18 process. Therefore, if we substitute the superseded height from the datasheet into the equation the difference is reduced to 0.1 cm (1 mm). [See the box titled “Computation of the Difference between the modeled geoid value (Geoid18) and the computed geoid value for Fargo 0009 Using the Superseded NAVD 88 Value.”]

    Computation of the Difference between the modeled geoid value (Geoid18) and the computed geoid value for Fargo 0009 Using the Superseded NAVD 88 Value
    (Information from NGS Published Datasheet)

    Data: National Geodetic Survey
    Data: National Geodetic Survey

    This means if someone uses NGS’ OPUS web tool to compute a GNSS-derived orthometric height, the NAVD 88 GNSS-derived orthometric height will be about 8 cm different than the published stations in this region. This should not be an issue if the users follow published NGS Guidelines to estimate the NAVD 88 GNSS-derived orthometric height, and/or uses NGS Beta OPUS-Projects and NGS procedures to estimate the NAVD 88 GNSS-derived orthometric height. These processes will ensure that the height will be consistent with the current published NAVD 88 orthometric heights in the NGS database.

    The technical report on Geoid18 provides a good explanation on the stations used in the United States Gulf Coast region. See box titled “GPS on Bench Marks for GEOID18 in the Gulf Coast Region.”

    GPS on Bench Marks for GEOID18 in the Gulf Coast Region

    (https://www.ngs.noaa.gov/GEOID/GEOID18/geoid18_tech_details.shtml)

    There are areas of complex vertical crustal motion in the Texas/Louisiana Gulf Coast region of the United States which render many control station elevations in the region invalid. The selection of GPS on Bench Marks in this region was limited to the small number of marks where the leveling and GPS data agreed to minimize the influence of crustal motion in the hybrid geoid model. Figure 1 depicts the selection of stations used in the hybrid geoid model along the Texas/Louisiana Gulf Coast.

    Image: National Geodetic Survey
    Figure 1: GEOID18 Gulf Coast selected marks. (Image: National Geodetic Survey)

    As indicated in the box titled “GPS on Bench Marks for GEOID18 in the Gulf Coast Region” very few stations in Southern Louisiana were used in the creation of the hybrid geoid model. The box titled “Differences on GPS on Bench Marks in the Gulf Coast Region” depict the differences between the published Geoid18 value and the computed geoid value using the latest NAD 83 (2011) ellipsoid and NAVD 88 orthometric height. The plot indicates that there are many large differences. This is to be expected because the orthometric heights used in the creation of the hybrid geoid model are all superseded heights. This is because the only published heights in Southern Louisiana are GNSS-derived orthometric heights and leveling-derived orthometric heights were used in the creation of GEOID18.

    Differences on GPS on Bench Marks
    in the Gulf Coast Region

    Image: National Geodetic Survey
    Image: National Geodetic Survey

    Saying that, NGS performed a large GNSS network project in Southern Louisiana in 2016. At the time of the writing of this column, the GNSS-derived orthometric height from the 2016 project were not yet finalized.

    This column provided an analysis of the differences between the latest published hybrid Geoid18 values provided on NGS’ Datasheet and the computed geoid height value using the published NAD 83 (2011) ellipsoid height and NAVD 88 orthometric height. The column highlighted issues on differences due to published heights that have changed since the database pull for Geoid18. Future columns will address differences in other portions of CONUS.

  • How to use the NGS Beta GEOID18 web map

    How to use the NGS Beta GEOID18 web map

    This column discusses the results of the National Geodetic Survey (NGS) beta hybrid Geoid18 model and the differences between the beta model and the official hybrid geoid model, Geoid12B. It provides examples to explain the symbology of the Beta Geoid18 Web Map. GEOID18 will be the last hybrid geoid model that NGS will create before NAVD 88 is replaced by the North American-Pacific Geopotential Datum of 2022 (NAPGD2022). I encourage users to access, investigate and become familiar with the web map.

    My last column included links to the NGS website that provides the beta coordinates and information about the latest Multi-Year CORS solution (MYCS 2). The column also noted that in late February 2019, NGS released a beta version of the latest hybrid geoid model. See Figure 1,National Geodetic Survey’s Home Web Page.” This column discusses the Beta Geoid18 Web Map, the results of the hybrid Geoid18 model, and the differences between the beta model and the official hybrid model, Geoid12B.

    Figure 1. National Geodetic Survey’s Home Web Page. (Screenshot: National Geodetic Survey)
    Figure 1. National Geodetic Survey’s Home Web Page. (Screenshot: National Geodetic Survey)

    The Geoid18 hybrid geoid model can be accessed here. See Figure 2, Excerpt from Beta Geoid18 Website. The site provides an opportunity for users to compute a Beta Geoid18 value for a particular station. I would encourage all users to obtain an understanding of the new hybrid model. Once again, it should be noted that this model is a beta model for users to test their workflows and should never be used for official or production work. This allows users to identifies potential issues and differences between Geoid12B and Geoid18, and then contact NGS if they have a question. NGS has done a tremendous job of explaining the Geoid18 process and results, and would appreciate users helping to evaluate the new hybrid model. Several of my previous columns have highlighted the NGS GPS on Bench Marks (GPS on BMs) program and how users have supported the development of the hybrid Geoid18 model: Part 5, Part 6, Part 7, Part 8 and Part 9.

    The NGS Beta Geoid18 website provides access to GIS tools that allow users to identify changes between Geoid12B and Geoid18 in their area of interest. The site also states that the hybrid geoid model, Geoid18, will be the last hybrid geoid model that will be created before the new geopotential datum, NAPGD2022, is adopted as the official datum. This is the opportunity for users to be involved in the analysis of the Beta hybrid geoid model. NGS will consider changes to the Beta model until it becomes an official published product. This hybrid geoid model is slightly different from the previous hybrid geoid model, Geoid12B. Similar to Geoid12B, the majority of the design of the hybrid model comes from the relationship between the NGS’ GNSS-derived ellipsoid-derived heights and the leveling- derived orthometric NAVD 88 heights. In other words, the hybrid model is designed to fit to the NAVD 88 orthometric heights.

    That said, since the creation of hybrid Geoid12b, there have been improvements in the underlying gravimetric geoid model used in Geoid18. These improvements include:

    • Better elevation data and improved digital elevation modelling techniques,
    • New gravity data from satellite gravity missions,
    • New airborne gravity data from the NGS GRAV-D program, and
    • Improved geoid modeling techniques.

    My previous columns have focused on procedures and routines for establishing GNSS-derived orthometric heights. As I’ve mentioned in these columns, there are many ways to analyze and investigate GNSS data and adjustment results. I have provided basic concepts that I believe are important for users to understand. My October 2016 column focused on the NGS “GPS on BMS (GPSBM)” dataset that was used to create the last hybrid geoid model, Geoid12B.

    As mentioned in my October 2015 column, the hybrid geoid model is designed to fit the published NAVD 88 leveling-derived orthometric heights. I highlighted that the GPS on BMs dataset can be used to identify potential issues in the NAVD 88 published orthometric heights. The October 2016 column provided tools and routines that can be used to identify potential issues in NAVD 88 heights and/or NAD83 (2011) published ellipsoid heights. In support of the Beta Geoid18, NGS performed a detailed analysis of the GPS on BMs stations that were used in the creation of Geoid18.

    Excerpt from Beta Geoid18 Website (Image: National Geodetic Survey)
    Figure 2. Excerpt from Beta Geoid18 Website. (Image: National Geodetic Survey)

    If you click on the “Web Map button” on the Geoid18 web page (see arrow in Figure 2), you may see the statement highlighted in Figure 3. Clicking on the link will redirect you to the correct web site (see Figure 4.).

    Result of Clicking on Web Map Button
    Figure 3. Result of Clicking on Web Map Button (Screenshot: National Geodetic Survey)

    Web Map Option
    Figure 4. Web Map Option – Results after clicking https://arcg.is/vSn8K (Top Level of Beta Geoid18 Map) [Screenshot: National Geographic, Esri, Garmin, HERE, UNEP-WCMC, USGS, NASA, ESA, METI, NRCAN, GEBCO, NOAA, increment P Corp. | National Oceanic and Atmospheric Administration (NOAA), National Ocean Service (NOS), National Geodetic Survey (NGS)]
    This data layer provides the value of the post-modeled residuals for all of the GPS on Bench Marks that were part of the evaluation of the Beta GEOID18 model. This Feature Layer is used to populate several layers in the Beta GEOID18 Web Map including the layers called Residuals and GPSonBM. The data for this web map can be found here.The top level of the Beta Geoid18 Map depicts a high-level picture of the residuals. The residuals are in centimeters and represented by different colors. The larger green and yellow circles represent the number of features in the region. The individual GPS on BMs station information appear as the user zooms down. There is a lot of information provided on the Web Map site. The legend changes to provide more detailed information as the user zooms down on the map. I have highlighted four sections on the legend in Figure 5 and provided an explanation of the layers below:

    1. This data layer provides the value of the post-modeled residuals for all of the GPS on Bench Marks that were part of the evaluation of the Beta GEOID18 model. This Feature Layer is used to populate several layers in the Beta GEOID18 Web Map including the layers called Residuals and GPSonBM. The data for this web map can be found here.
    2. This data layer denotes whether the GPS on Bench Mark was used or rejected in the development of the Beta hybrid geoid GEOID18. The data for this web map can be found here.
    3. This data layer denotes whether the GPS on Bench Mark was used or rejected in the development of the hybrid geoid GEOID12B. This has all of the same attributes as the spreadsheet provided on the NGS GEOID12B web page. More information can be found here.
    4. This is a tile package that displays the difference between GEOID18 and GEOID12B in CONUS. It contains two overlayed raster files, one of which is the estimated error and the other is its hill shade. The data for this web map can be found here.
    Figure 5. Legend of Beta Geoid18 Web Map (Screenshot: National Geodetic Survey)
    Figure 5. Legend of Beta Geoid18 Web Map (Screenshot: National Geodetic Survey)

    Clicking on the “Content” link provides the data layers (see Figure 6). The user can turn these layers on and off depending on what they’re interested in analyzing.

    Contents of Beta Geoid18 Web Map
    Figure 6. Contents of Beta Geoid18 Web Map (Screenshot: National Geodetic Survey)

    As previously stated, additional details are available as the user zooms into an area of interest (see Figure 7). Five stations have been highlighted in this figure to explain the symbology used on the Web Map site. See Figure 8 for these explanations.

    Example of the details available in an area in Eastern North Carolina
    Figure 7. Example of the details available in an area in Eastern North Carolina (Screenshot: National Geodetic Survey)

    An Explanation of Stations Highlighted in box titled Example of the details available in an area in Eastern North Carolina

    Figure 8. An Explanation of Stations Highlighted in box titled Example of the details available in an area in Eastern North Carolina (Screenshot: National Geodetic Survey)

    When the user clicks on a station’s icon, another window appears that provides specific information about that station. See Figure 9. If the user clicks on the “More Info” button, the routine retrieves the NGS datasheet from the NGSIDB (see Figure 10). As the NGS datasheet states at the end of the description for station Y 247, the station has been obliterated by a mower, which is why it probably was not used in Geoid18.

    Example of Information Available for Individual Stations
    Figure 9. Example of Information Available for Individual Stations (Screenshot: National Geodetic Survey)


    NGS Datasheet for Station Y 247 (PID EX0083)
    Figure 10. NGS Datasheet for Station Y 247 (PID EX0083) (Screenshot: National Geodetic Survey)


    Figure 11
    provides all the information available for station Y 247. It should be noted that the station was used in Geoid12B and not used in Geoid18. This means that there will be differences between Geoid12B and Geoid18 in areas where a station was used in Geoid12B but not used in Geoid18. The amount of the difference will depend on the size of the post-modeled residual. In this example, the post-model residual is 7.39 cm.

    Example of Geoid18 Information Available for Station Y 247
    Figure 11. Example of Geoid18 Information Available for Station Y 247 (Screenshot: National Geodetic Survey)

    GPS on BMs data are usually based on different epochs of data; that is, the leveling data is usually observed at a different epoch than the GNSS data. This means, if the station has moved since the last time it was leveled, then the GNSS-derived ellipsoid height minus the leveling-derived orthometric height will not be equal to the geoid height. The procedure for computing GPS on BMs residuals was described in my February 2018 column. To determine if a bench mark had moved since it was last leveled, the analyst needs several nearby bench marks occupied by GNSS.Users have been very important to the development of Geoid18 by participating in NGS’ GPS on BMs program. These data have been used to improve the reliability of the hybrid geoid model. Users can now help by evaluating areas that have large changes between Geoid12B and Geoid18 (see box titled Figure 12). To help ensure that the appropriate stations were used to create the hybrid geoid model Geoid18, users could occupy nearby stations in the area to evaluate the reliability of the model. This will help NGS improve the reliability of the model in that region.

    Example of a Large Difference Between Geoid12B and Geoid18 in Western North Carolina
    Figure 12. Example of a Large Difference Between Geoid12B and Geoid18 in Western North Carolina (Screenshot: National Geodetic Survey)

    I described the NGS’ published height codes in my October 2016 column. In the case of Mitchell 2, there’s no leveling data in NGS’ database in the area surrounding Mitchell 2. There may be leveling projects that have been performed by other agencies such as the USGS but the leveling data have not been processed and loaded into NGS’ database. Users could help by performing GNSS observations on bench marks in the region that are in NGS’ database and/or by performing leveling observations between the GPS on BMs station and the nearest bench mark that has leveling data in NGS’ database.In the example of a large difference between Geoid12B and Geoid18 in Western North Carolina, station Mitchell 2 (PID FB2737) was used in Geoid12B but not used in Geoid18. It wasn’t used in Geoid18 because the NAVD 88 height was not based on an adjustment. According to the description, the leveling tie was performed by a field party that was performing a horizontal survey project (see Figure 13). The field party performed the appropriate leveling procedures but, in this case, the leveling data have not been placed in computer-readable form, so the orthometric height cannot be verified.

    NGS Data Sheet for Station Michell 2 (PID FB2737)
    Figure 13. NGS Data Sheet for Station Michell 2 (PID FB2737) (Screenshot: National Geodetic Survey)

    I encourage users to access the web map and investigate stations that have large post-modeled residuals and/or stations that were used in Geoid12B but were not used in Geoid18. The NGS analyst rejected stations based on pre- and post-modeled residuals but many times there wasn’t enough redundant information available to ensure the station should be rejected or used in the creation of the hybrid geoid model. Users should be commended for their participation in the GPS on BMs program. Hopefully, users will continue their support by evaluating the beta hybrid geoid model.

  • NGS releases beta coordinates and multi-year CORS solution

    NGS releases beta coordinates and multi-year CORS solution

    My last column discussed the preliminary results of NGS’ second Multi-Year CORS Beta Solution of the National CORS. Since my last column, NGS announced the release of the beta version of the hybrid geoid model GEOID18 and, on Feb. 15, NGS officially released the Beta CORS ITRF2014 coordinates and velocities.

    This column provides the official links to NGS website that provide the beta coordinates and information about the latest multi-year CORS solution. Below is the NGS announcement of the beta release of the updated coordinates.

    Excerpt from Feb. 15, 2019, "NOTICE: New BETA Coordinates Available for CORS and OPUS". (Screenshot: NGS)
    Excerpt from Feb. 15, 2019, “NOTICE: New BETA Coordinates Available for CORS and OPUS”. (Screenshot: NGS)

    NGS also provides a notice of the new beta coordinates on the National Geodetic Survey homepage, with a link to the Beta CORS ITRF14 coordinates (see the highlighted section below).

    National Geodetic Survey homepage. (Screenshot: NGS)
    National Geodetic Survey homepage. (Screenshot: NGS)

    Clicking on the hyperlink labeled BETA CORS ITRF14 Coordinates directs you to the Multi-Years CORS Solution informational homepage.

    Information on Multi-Year CORS Solution 2. (Screenshot: NGS)
    Information on Multi-Year CORS Solution 2. (Screenshot: NGS)

    By clicking on the CORS Home button, the user is directed to the Beta CORS page.

    Beta CORS release page. (Screenshot: NGS)
    Beta CORS release page. (Screenshot: NGS)

    This page clearly states that the ITRF2014 reference frame for CORS is available as a beta product. It also implies that these coordinates are being used in other beta products such as OPUS. I’ll address this later in this column.

    Users can obtain information about the MYCS and other related products and services such as Beta OPUS by clicking on links provided on the Beta CORS homepage.

    Accessing information about ITRF2014 frame in NGS beta products. (Screenshot: NGA)
    Accessing information about ITRF2014 frame in NGS beta products. (Screenshot: NGA)

    It should be noted that these values are considered “beta” and are available to users for testing and feedback. NGS provides a statement about its beta release products. Basically, it states that users should only use beta products to test their workflows and never for official or production work.

    The NGS beta release statement. (Screenshot: NGS)
    The NGS beta release statement. (Screenshot: NGS)

    To facilitate testing of the beta CORS coordinates and velocities, NGS provides links to other beta products that will use the MYCS 2 coordinates and velocities.

    By clicking on the link labeled BETA OPUS on the beta CORS homepage, the user is directed to the BETA OPUS webpage. This page clearly states that the beta OPUS routine uses the new ITRF2014 reference frame for CORS.

    The NGS beta OPUS webpage. (Screenshot: NGS)
    The NGS beta OPUS webpage. (Screenshot: NGS)

    NGS also provides a link to Beta OPUS Projects that use the MCYS2 coordinates and velocities.

    Beta OPUS Projects webpage. (Screenshot: NGS)
    Beta OPUS Projects webpage. (Screenshot: NGS)

    Once again, the Beta OPUS Projects website clearly states that the beta version is using the CORS coordinates and velocities from the MYCS2. It also states that, at this time, NGS will not accept ITRF2014 submissions for publication. As previously stated, NGS’ beta products are for users to test their workflows and should never be used for official or production work.

    The Beta CORS webpage provides a lot of valuable information on the processing and establishment of the multi-years CORS solution. I’ve highlighted several of the sections below.

    First, by clicking on the link MYCS2 Processing, the user is directed to the section that describes the data used and the processing strategy.

    Excerpt from Beta CORS Webpage – MYCS2 Processing. (Screenshot: NGS)
    Excerpt from Beta CORS Webpage – MYCS2 Processing. (Screenshot: NGS)

    The following are highlights from the section:

    • The processing included data spanning 1996 to 2016 and involved around 3050 CORS, IGS and other (e.g., NGA) stations.
    • The corresponding input and output data occupied about 25 TB on the NGS computers.
    • The residual time series in the early 1990s showed exceptionally noisy behavior at times, which were deleted in the alignment/velocity computation stage.
    • The processing was performed in 3 steps:

    1. The global processing step solves for orbits, Earth Orientation Parameters (EOPs), hourly tropospheric delay parameters and weekly global (IGS) station positions in an IGS-NNR frame.

    2. The CORS processing step ties the remaining CORS to global, backbone, sites holding fixed estimated orbits, troposphere, EOPs and IGS station coordinates. This leads to estimated CORS coordinates in a no net rotation (NNR) frame.

    3. The last step is the alignment of the estimated coordinates with ITRF2014 and velocity estimation. This process was done in 15 iterations to achieve rigorous quality control and discontinuity detection.

    Linear velocities for all stations are estimated in the NGS realization of ITRF2014. NGS explains how this was implemented in the section titled “The velocity field relative to ITRF2014” (see box titled “Section Describing the Velocity Field Relative to ITRF2014”). The website provides figures that depict the horizontal and vertical velocities used in the processing.

    The following are a few highlights from the section:

    • Unless an earthquake or a post seismic adjustment occurred, the velocities of a station in between discontinuities are constrained to have the same value.
    • Stations that experience earthquakes, post seismic adjustment and in a few cases, non-uniform vertical motion, are allowed to have different velocities in between events as dictated by the data.
    • The webpage provides figures that depict the estimated horizontal and vertical CORS velocities.
    Section describing the velocity field relative to ITRF2014. (Screenshot: NGS)
    Section describing the velocity field relative to ITRF2014. (Screenshot: NGS)

    What users usually want to know is how much the coordinates have changed and what it means to their surveying activities. The section titled “Main Changes Compared to Previous Reference Frames” provides information and plots that depict the changes of coordinates.

    Section on changes in coordinates. (Screenshot: NGS)
    Section on changes in coordinates. (Screenshot: NGS)

    This section provides NAD83 (MYCS2) coordinate values minus NAD83 (MYCS1) coordinate values.

    The following are a few highlights from the section:

    • The ITRF2014 coordinates of all computed CORS coordinates from MYCS2 processing are converted to NAD83 (2011) using HTDP.
    • The resulting NAD83 (2011) coordinates are then compared to those obtained from MYCS1 at all common sites.
    • The coordinate differences are compared at epoch 2010.0 (MYCS2 – MYCS1).
    • The differences are less than 5 mm in most areas with some exceptions.
    • The largest differences are seen in southern Alaska.
    • Other visible changes are seen in areas of significant and real subsidence and in places where the time series are too short, such as in Iowa where almost all time series are three years long.
    • Vertical coordinates (ellipsoidal heights) are compared using the same criteria.
    • The stations with the HTDP estimated velocities from MYCS1 (no vertical velocities) show the largest differences. In addition, non-secular subsidence areas also show larger differences.

    By clicking on the plots, the user is directed to a larger figure that is easier to interpret. (See boxes titled “NAD83 (MYCS2) – NAD83 (MYCS1) Horizontal Position Differences” and “NAD83 (MYCS2) – NAD83 (MYCS1) Vertical Position Differences.”)

    NAD83 (MYCS2) - NAD83 (MYCS1) Horizontal Position Differences. (Screenshot: NGS)
    NAD83 (MYCS2) – NAD83 (MYCS1) Horizontal Position Differences. (Screenshot: NGS)
    NAD83 (MYCS2) - NAD83 (MYCS1) Vertical Position Differences. (Screenshot: NGS)
    NAD83 (MYCS2) – NAD83 (MYCS1) Vertical Position Differences. (Screenshot: NGS)

    NGS has done a tremendous job of explaining the MYCS2 process and results. As the results indicate, most differences between the MYCS1 and MYCS2 are small. Saying that, I would encourage all users to look at the NGS Beta webpages and obtain an understanding of the MYCS2 process and results. Users should also use the beta products and compare their results to the current production products to evaluate the CORS beta coordinates and velocities in their region of interest.

    Notice announcing beta version of Geoid18 on NGS homepage. (Screenshot: NGS)
    Notice announcing beta version of Geoid18 on NGS homepage. (Screenshot: NGS)

    It should also be noted that in late February, NGS released a beta version of the latest hybrid geoid model, Geoid18. This model can be accessed here; the site provides an opportunity for users to compute a beta Geoid18 value for a particular station.

    Excerpt from beta Geoid18 website. (Screenshot: NGS)
    Excerpt from beta Geoid18 website. (Screenshot: NGS)

    I would encourage all users to obtain an understanding of the new hybrid model. Once again, it should be noted that this model is a beta model for users to test their workflows and should never be used for official or production work.

    My next column will discuss the beta hybrid Geoid18 model, and the differences between the beta model and the official hybrid geoid model, Geoid12B.

  • A look at NGS’ experimental and hybrid geoid models

    A look at NGS’ experimental and hybrid geoid models

    On Aug. 10, the National Geodetic Survey (NGS) released its latest experimental geoid model, xGeoid18. In early 2019, NGS is scheduled to release its next hybrid geoid model, Geoid18.

    NGS’ 2018 experimental geoid model, xGeoid18, and the next hybrid geoid model, Geoid18, are not the same. This column will address the latest experimental geoid model, xGeoid18, and the future hybrid geoid model, Geoid18, and why it’s important to understand that they are very different and cannot be interchanged.

    In my October 2015 column, I described the differences between NGS’ hybrid geoid models and their experimental geoid models. It has been three years since I wrote the newsletter that addressed the differences between the experimental geoid model and hybrid geoid models. NAPGD2022 is now only about three years away. There will be significant differences between NAVD 88 and NAPGD2022 height.

    My June 2017 column provided an estimate of the differences based on the 2016 experimental geoid model, xGeoid16b. These differences between NAVD 88 and NAPGD2022 will vary from state to state, as well as within an individual State. Products referenced to NAVD 88 will be different from products referenced to NAPGD2022. Users will need to prepare for the NAPGD2022 and develop implementation plans. Users should obtain an understanding of the differences between NAPGD2022 and NAVD 88.

    NGS has a webpage that provides information on all of their experimental geoid models. It page provides information on the development of the program and information on each of the experimental geoid models.

    NGS’ Experimental Geoid Website

    Photo: National Geodetic Survey Photo: National Geodetic Survey. Click to enlarge.

    If the user clicks on the xGeoid18 button (see orange arrow in the box titled “NGS’ Experimental Geoid Web Site”), the experimental geoid model xGeoid18 web page appears (see box titled “NGS’ Experimental Geoid Models 2018 Web Site”).

    NGS’ Experimental Geoid Models 2018 Website

    Photo: National Geodetic Survey

    Once users get to the xGeoid18 web site, they can obtain estimates of xGeoid18 values for any latitude and longitude by clicking on the button titled “Interactive Geoid Computation.” See red arrow in box titled “NGS’ Experimental Geoid Models 2018 Web Site.”

    Input Page of xGeoid18 Interactive Web Page Using the Sample Dataset

    Photo: National Geodetic Survey

    Users should note that the output of the xGeoid18 interactive web service provides the results in IGS08 epoch 2022.00. The output provides an estimate of the NAVD 88 orthometric height based on GEOID12B, an estimate of the NAPGD2022 orthometric height based on xGeoid18b, and the difference between NAPGD2022 and NAVD 88. The box titled “Output from xGeoid18 Interactive Web Page Using the Sample Dataset” shows the output from the interactive web service using the sample dataset provided by the web service.

    The sample dataset has four stations — a station in California, Louisiana, Michigan and Maine. The results indicate that the differences will vary from state to state — the difference between NAPGD2022 and NAVD 88 in California using xGeoid18b is -0.722 meters, in Louisiana the difference is -0.274 meters, in Michigan the difference is -0.646 meters, and in Maine the difference is -0.307 meters (see box titled “Output from xGeoid18 Interactive Website Using the Sample Dataset”). More detailed estimates of differences between NAPGD2022 and NAVD 88 based on xGeoid16b can be found in my June 2017 column.

    Output from xGeoid18 Interactive Website Using the Sample Dataset

    Note: The GRS80 ellipsoid is used for both NAD83 and IGS08.

    Data: National Geodetic Survey

    Data: National Geodetic Survey

    Users can find technical information on xGeoid18 by clicking on the link labeled as Technical Details on the xGeoid18 website (see blue arrow in box titled “NGS’ Experimental Geoid Models 2018 Web Site”). The box titled “Excerpt from Technical Details for xGEOID18 Models” provides an excerpt of the technical details of xGeoid18.

    Excerpt from Technical Details for xGEOID18 Models

    Summary
    xGEOID18 is identical to xGEOID17 in the area bordered by 5˚ ≤ φ ≤ 85˚, 170˚ ≤ λ ≤ 350˚, which includes CONUS, Alaska, Hawaii, and Puerto Rico. Therefore, for information on xGEOID18 in those areas, the user should refer to the Technical Details of xGEOID17.

    For extended areas down to the equator and above latitude 85˚ north, the geoid is computed from the NGA’s Preliminary Geopotential Model 2017 (PGM17).

    The geoid models for Guam/central Northern Marianas Islands and American Samoa are computed in the closest way as xGEOID17 using the shipborne gravity, altimetric gravity and the reference gravity model PGM17.

    The deflections of the vertical are computed from all the geoid grids and the plumb curvature correction is applied by using the classical Bouguer reduction.


    As the technical detail webpage states, xGEOID18 is identical to xGEOID17 in the area bordered by 5˚ ≤ φ ≤ 85˚, 170˚ ≤ λ ≤ 350˚, which includes CONUS, Alaska, Hawaii and Puerto Rico. Therefore, for information on xGEOID18 in those areas, the user should refer to the Technical Details of xGEOID17. The box titled “Excerpt from Technical Details for xGEOID17 Models” provides an excerpt of the technical details of xGeoid17. This link provides figures that show the contribution of the airborne gravity data to the geoid models. See boxes titled “Excerpt from Technical Details for xGEOID17 Models” and “Figure (2,3,4,5) from Technical Details for xGEOID17 Models.” As stated in the technical details, users can examine each of the regional plots to see where the incorporation of GRAV-D data has changed the values of the xGeoid17B model.

    Excerpt from Technical Details for xGEOID17 Models

    GRAV-D Airborne Gravity Contribution

    The xGEOID17A and xGEOID17B models are identical except that xGEOID17B includes the available GRAV-D airborne gravity data. The difference between the two models shows the contribution of the airborne gravity data to the geoid models. Since the differences are only in areas where the GRAV-D airborne gravity data has been used, examining the regional plots given below will illustrate the varying levels of improvement due to GRAV-D, seen in different parts of the country.

    Photo: National Geodetic Survey

    Figure 1. CONUS – Contribution of GRAV-D airborne gravity [units in cm]

    Figure 2 from Technical Details for xGEOID17 Models

    Photo: National Geodetic Survey

    Figure 2. Alaska – Contribution of GRAV-D airborne gravity [units in cm]

    Figure 3 from Technical Details for xGEOID17 Models

    Photo: National Geodetic Survey

    Figure 3. Gulf Coast – Contribution of GRAV-D airborne gravity [units in cm]

    Figure 4 from Technical Details for xGEOID17 Models

    Photo: National Geodetic Survey

    Figure 4. Northeast – Contribution of GRAV-D airborne gravity [units in cm]

    Figure 5 from Technical Details for xGEOID17 Models

    Photo: National Geodetic Survey

    Figure 5. Pacific Coast – Contribution of GRAV-D airborne gravity [units in cm]

    What does mean to a user today? A station can now have a published ellipsoid height, modeled GEOID12B value, a published NAVD 88 orthometric height, and several xGeoid modeled values. This can lead to confusion if the user is not careful about providing the correct metadata associated with their data and results.

    The box titled “Excerpt from The NGS Data Sheet for Station E 116 (PID GA0589)” provides the output from NGS data sheet retrieval program. The first item to note is that if you compute the GNSS-derived orthometric height (HGNSS) using the formula:

    Equation: National Geodetic Survey Equation: National Geodetic Survey

    the computed value does not equal the published NAVD 88 leveling-derived orthometric height. In this example, the two heights differ by 2.3 cm. As explained in a previous column, GEOID12B is a hybrid geoid model that is distorted to be consistent with NAVD 88 published heights. It is a model and the documentation states that “The relative accuracy of GEOID12B to NAVD88 is characterized by a misfit of +/-1.7 centimeters nationwide.” The box titled “Excerpt from The NGS Data Sheet for Station E 116 (PID GA0589)” provides the computations and the results.

    Excerpt from The NGS Data Sheet for Station E 116 (PID GA0589)

    Data: National Geodetic Survey

    Users can also obtain a xGeoid18B value for the station. The box titled “xGeoid18 Output for Station E 116 (PID GA0589)” provides the output of the xGeoid18 using NGS’ xGeoid18 interactive web service. It should be noted that the xGeoid18 output only provides the NAVD 88 orthometric height using GEOID12B; it does not include the published NAVD 88 orthometric height from the NGS Datasheet.

    xGeoid18 Output for Station E 116 (PID GA0589)

    Note: The GRS80 ellipsoid is used for both NAD83 and IGS08.
    Data: National Geodetic Survey

    The box titled “Different Height Values for Station E 116 (PID GA0589)” provides three different height values that are currently available from NGS web services. These different heights could lead to confusion if users are not careful. Most users won’t be using the experimental geoid interactive web service to compute an estimate of an orthometric height but all users should provide the appropriate metadata to avoid any confusion.

    Different Height Values for Station E 116 (PID GA0589)

    Chart: National Geodetic Survey Chart: National Geodetic Survey

    The hybrid geoid model GEOID18 is currently being developed and is not ready to be published, but there is a web page that highlights that it will replace GEOID12B in early 2019 [see box titled “Hybrid GEOID18 Website“] GEOID18 values will be similar to GEOID12B because both hybrid geoid models are made to be consistent with published NAVD 88 values. Saying that, there will be differences especially in areas where the GPS on BMs program identified stations that have moved since the last time they were leveled and, therefore, they were not used in GEOID18.

    Hybrid GEOID18 Website

    Photo: National Geodetic Survey Photo: National Geodetic Survey

    My last column provided an update and status report on stations observed in support of the 2018 GPS on BMs program. Many stations with potential invalid published orthometric heights have been identified by the GPS on BM program. This information will be very useful to the surveying and mapping community as well as to NGS. Once NGS publishes the next hybrid geoid model, GEOID18, OPUS results will probably provide an estimate of the NAVD 88 orthometric height computed using GEOID18 similar to what it does now using GEOID12B. In my opinion, the results of GEOID18 will be better than GEOID12B in most areas of the United States and will be helpful in identifying stations that have moved since they were last leveled.

    NGS’ official date for accepted data for inclusion in the next hybrid geoid model, GEOID18, ended September 21, 2018. Continuing to submit your results to OPUS Shared will provide a way for others to analyze the results to determine whether a station has an issue that requires attention. New OPUS shared results will be very useful for evaluating the reliability of the model. After the hybrid geoid model, GEOID18, is published, NGS’ GPS-on-Bench-Mark Program will expand to include other regions and will focus on data to improve NGS datum transformation tools. Further columns will address differences between GEOID12B and GEOID18 after GEOID18 officially replaces GEOID12B.

  • NGS 2018 GPS on BMs program in support of NAPGD2022 — Part 9

    NGS 2018 GPS on BMs program in support of NAPGD2022 — Part 9

    The number of GPS on Bench Mark (BM) stations highlighted as complete on the National Geodetic Survey (NGS) GPS tracking page as of Sept. 25 represents 43 percent of the total number of stations that need to be observed (2451 of 5862 Priority Marks Completed).

    These new GPS on BMs observations will be helpful in identifying invalid GPS on BM stations that may have been used in the next hybrid geoid model.

    Now that the 2018 GPS on BM program has officially ended for data included in the hybrid model GEOID18, NGS’ GPS on Bench Mark Program will soon be expanded to include other regions and will focus on data to improve NGS datum transformation tools.

    NGS has aided users that are submitting data using OPUS through their GPS on BM website service. Previous columns have highlighted the website. This column will highlight a new feature on the NGS GPS on BMs webpage that displays the progress of priority marks and its associated statistics. This webpage can be accessed through a link on the GPS on BMs Program main webpage — (see highlighted section in box tilted “GPS on BM Project Webpage”). The new webpage provides statistics by state as well as which agencies are submitting the most GPS on BMs data (see the box titled “NGS Webpage of Priority Marks Progress Update”).

    GPS on BM Project Webpage

    (Source: NGS website)

    Image: National Oceanic and Atmospheric Administration Image: National Oceanic and Atmospheric Administration


    NGS Webpage of Priority Marks Progress Update

    (Source: NGS website)

    Image: National Oceanic and Atmospheric Administration

    The right side of the webpage provides the percent of the goal reached, a link to the progress tracking map, and a link to progress by state (see box below). The first thing to notice that it provides a current percent of goal reached to date. In this example, the GPS on BM program is at 45 percent complete.

    Right Side of Priority Marks Progress Update Webpage

    (Source: NGS website)

    Image: National Oceanic and Atmospheric Administration

    Clicking on the “Progress Tracking Map” picture will bring up the latest map update (see box below). As depicted in the box, as of Sept.25, 2,451 of 5,862 priority marks have been completed. The “Progress Tracking Map” provides information based on the last time the map was updated, and the “Percent of Goal Reached” is based on the most current OPUS Shared solutions submitted. NGS is working toward generating the map and solutions in near real time.

    2018 Progress Tracking Web Map

    (Source: NGS website)

    Image: National Oceanic and Atmospheric Administration

    Clicking on the “View Progress by State” picture will bring up a table of progress of priority marks by state (see box titled “View by State Webpage”). As depicted in the box, the following statistics are provided for every state:

    Source: National Oceanic and Atmospheric Administration Source: National Oceanic and Atmospheric Administration


    View by State Webpage

    (Source: NGS website)

    Source: National Oceanic and Atmospheric Administration Source: National Oceanic and Atmospheric Administration

    The following states have officially completed 100 percent of their priority A and B stations: Connecticut, Minnesota, North Carolina, New Jersey and U.S. Virgin Islands. Congratulations to these states (see the box titled “Priority A & B Progress – states with 100 percent complete”).

    Priority A & B Progress — States with 100 percent complete

    (Source: NGS website)

    Source: National Oceanic and Atmospheric Administration

    It should also be noted that there are 15 states that have completed at least 75 percent of their priority A and B stations (see box below). This is a tremendous amount of work, and everyone should be commended for participating in the GPS on BM program.

    Priority A & B Progress – States with at 75 percent Completed

    (Source: NGS website)

    Source: National Oceanic and Atmospheric Administration

    For completeness, the box below provides a list of the States sorted by percent complete.

    Priority A & B Progress – Sorted by Total % Complete

    (Source: NGS website)

    Source: National Oceanic and Atmospheric Administration

    Source: National Oceanic and Atmospheric Administration Source: National Oceanic and Atmospheric Administration

    The left side of the webpage provides information on the top submitting agencies. As indicated in the box below, the Illinois Department of Transportation (DOT) and Montana DOT are the two top leaders in submitting GPS on BMs data. They have submitted well over 200 OPUS Shared solutions. The New Jersey and Oregon DOTs are close behind, providing about 200 OPUS Shared solutions.

    Left Side of Priority Marks Progress Update Webpage

    (Source: NGS website)

    Source: National Oceanic and Atmospheric Administration Source: National Oceanic and Atmospheric Administration

    It’s not surprising to see that state agencies have provided the most submissions to the GPS on BM project (73 percent). It’s very encouraging to see that the private sector has provided 13 percent. Having an accurate and reliable hybrid geoid model will assist surveyors in performing their jobs as well as improve their efficiency in performing geodetic surveys requiring heights.

    This column provided an update and status report on stations observed in support of the 2018 GPS on BMs program, and highlighting a new NGS GPS on BMs webpage that displays the progress of priority marks and its associated statistics. The number of GPS on Bench Mark stations completed as of Oct. 1 represents 45 percent of the total number of stations that need to be observed.

    As I have explained in previous columns, there were many stations with invalid heights that could be used in the next hybrid geoid model unless more bench marks with valid NAVD 88 heights were observed with GNSS.

    Many stations with potential invalid published orthometric heights have been identified by the GPS on BM program. This information will be very useful to the surveying and mapping community as well as to NGS.

    NGS’ official date for accepted data for inclusion in the next hybrid geoid model, GEOID18, was Sept. 21. However, any OPUS Shared observations submitted before the final version of GEOID18 has a possibility of being included in the model. Even if it’s not included in the hybrid model, it will be very useful for evaluating the reliability of the model.

    After the hybrid geoid model, GEOID18, is published, NGS’ GPS on Bench Mark Program will expand to include other regions and will focus on data to improve NGS datum transformation tools. I encourage everyone to continue supporting the GPS on BMs program — not only for improving the development of the 2022 transformation tool, but to assist in identifying bench marks in your local area that have invalid published orthometric heights due to movement.

    Once NGS publishes the next hybrid geoid model, GEOID18, OPUS results will probably provide an estimate of the NAVD 88 orthometric height computed using GEOID18 similar to what it does now using GEOID12B.

    In my opinion, the results of GEOID18 will be better than GEOID12B in most areas of the United States and should be helpful in identifying stations that have moved since they were last leveled. Submitting your results to OPUS Shared will provide a way for others to analyze the results to determine whether a station has an issue that requires attention.

  • NGS 2018 GPS on BMs program in support of NAPGD2022 — Part 8

    NGS 2018 GPS on BMs program in support of NAPGD2022 — Part 8

    My last two columns (NGS 2018 GPS on BMs program in support of NAPGD2022 — Part 6 and NGS 2018 GPS on BMs program in support of NAPGD2022 — Part 7) described the National Geodetic Survey’s (NGS) GPS on BMs 2018 interactive web map, and provided an update and status report on stations observed in support of the 2018 GPS on BMs Program. This column will provide another update and status report on stations observed in support of the 2018 GPS on BMs program and provide an example of how the OPUS-shared results filled in a void area in West Virginia that will benefit the development of the hybrid geoid model GEOID18. The column will also provide an example of how OPUS Shared results identified a reset station that has an invalid NAVD 88 height, and the importance of having a least two OPUS Shared results to ensure the reliability of the OPUS solutions.

    As mentioned in the last column, the GPS on BMs 2018 web page contains a link to a web map where users can determine which bench marks NGS would like users to occupy before the August 31, 2018, deadline. The box titled “2018 Web Map” depicts the map update as of July 27, 2018 (1738 priority marks completed). My last column reported that as of May 29, 2018, there were 1067 priority marks considered completed. During the past two months, 671 more priority stations have been reported completed. This is progress but this still only represents about 30 percent of the priority marks. Hopefully, this will increase dramatically during the month of August. Remember, the cut-off date for data to be included in the creation of the hybrid geoid model GEOID18 is August 31, 2018.

    2018 Web Map

    (Source: NGS website)

    Image: National Geodetic Survey Image: National Geodetic Survey

    NGS periodically provides an update on the GPS on Bench Marks Program. On July 3, 2018, NGS sent an email to everyone that shared GPS data on NGS bench marks via OPUS or registered for NGS’ February 2018 webinar about GPS on Bench Marks. The email provided an update on the GPS on Bench Marks Program (see box titled “July 3, 2018, NGS Email on GPS on BMs Update”). The map provided in the update indicated that some of the new observations may generate changes between +/- 8 cm.

    July 3, 2018, NGS Email on GPS on BMs Update

    (Source: Email from National Ocean Service, NOAA; [email protected] to Dave Zilkoski)

    Update: GPS on Bench Marks

    Over 1,420 marks completed, and two months left to improve GEOID18 accuracy in your area!

    Image: National Geodetic Survey Image: National Geodetic SurveyYour observations are making a difference! The color ramp in the map above reflects accuracy improvements in a hybrid geoid model from your recently submitted GPS observations. The improvements will be realized when NGS releases GEOID18.


    In case you missed it

    In early 2018, NGS released a list of priority bench marks where GPS data is needed to improve GEOID18, NGS’ last planned hybrid geoid model before The North American Vertical Datum of 1988 (NAVD 88) is replaced by the North American-Pacific Datum of 2022 (NAPGD2022). Data to support GEOID18 will be accepted until the end of August 2018. After that, GPS on Bench Marks (GPS on BM) efforts will expand to include other regions and will focus on data to improve future transformation tools.

    How can I help?

    Following the guidance provided on the NGS GPS on BM website, you can help by collecting static GPS data on adjusted NAVD 88 bench marks and submitting the data to NGS via OPUS Share. To improve efficiency and reduce unnecessary redundancy, we have created a GPS on Bench Marks 2018 web map to help contributors know where we have the data we need and where we still need GPS observations.

    Thank you to our contributors

    Over 1,700 observations have been submitted to date, completing the required observations for over 1,420 marks from our prioritized list. Each observation requires at least 4 hours of data collection with a survey grade GPS receiver, plus additional time for planning, travel, and data submission, so each one is a significant contribution. Visit the GPS on BM website for updates on our biggest data contributors and each state’s progress toward the goals.


    Why are you receiving this email?

    • You shared GPS data on NGS bench marks via OPUS, or
    • You registered for our February 2018 webinar about GPS on Bench Marks.

    We anticipate sending quarterly updates about these and related efforts. If you’d like to opt-out, click the “Manage Subscriptions” at the bottom of this email.

    NOAA’s National Geodetic Survey
    geodesy.noaa.gov

    NGS is tentatively planning another webinar on the GPS on Bench Marks program for August 9, 2018 (2 pm to 3 pm eastern time). NGS will provide an update on the GPS on Bench Mark program and probably will highlight potential improvements between the current hybrid geoid model GEOID12B and the latest prototype version of the future hybrid geoid model GEOID18. I would encourage everyone to sign up for the NGS webinar series.

    Source: Plot Generated Using ArcGIS

    Users can subscribe to any or all of NGS four public subscription lists — news, webinar, training, and GPS on Bench Marks — by visiting the NGS subscription services web page and submitting their email address for the type(s) of notices they want to receive. (https://www.ngs.noaa.gov/INFO/subscribe.shtml)

    As indicated in the figure provided in NGS’ July 3rd update on the GPS on Bench Marks program email, there are many areas of the country that have already benefitted from users participating in NGS’ GPS on BMs program. This column will highlight an area near Charleston, West Virginia, were users have been very active in providing OPUS Shared results. The box titled “GPS on Bench Marks near Charleston, West Virginia” depicts the marks that meet NGS’ criteria and will be involved in the development of the hybrid geoid model GEOID18. As you can see from the plot, there are several new stations that will be used in the development of the model which will help to improve the reliability of the product.

    GPS on Bench Marks near Charleston, West Virginia

    (Source: NGS Website)

    Image: National Geodetic Survey Image: National Geodetic Survey

    The box titled “An Example of OPUS Shared Stations in Charleston, West Virginia, Region” provides the stations’ PID and OPUS designation. The six OPUS Shared stations cover approximately a 50 km square area. Most of the stations are only 10 km apart. These stations will definitely help to improve the reliability of the hybrid GEOID18 model.

    An Example of OPUS Shared Stations in Charleston, West Virginia, region

    (Source: Plot Generated Using ArcGIS)

    Image: National Geodetic Survey Source: Plot Generated Using ArcGIS

    When using OPUS Shared results, users should always check to see if a station has been observed more than once. The box tilted “Differences in OPUS Shared Ellipsoid Heights in Charleston, WV, Region” lists the pairs of OPUS observations for the stations depicted in the previous plot. The column labeled “Difference in Ellipsoid Heights” provides the differences in ellipsoid heights based on the two different OPUS Shared results. All differences are less than 1.5 cm and most are less than 1.0 cm. This is indicating good repeatability to the cm level but this may not be indicating accuracy. These stations were observed one day apart but observed at about the same time of the day. They could have the same systematic errors effecting the results such as multipathing and satellite geometry. When performing the second OPUS Shared observation, users should select a different time of day to improve the chances of detecting, reducing, and/or eliminating the effects of remaining systematic errors.

    Differences in OPUS Shared Ellipsoid Heights in Charleston, West Virginia, region

    Source: National Geodetic Survey Source: National Geodetic Survey

    The box titled “Differences in OPUS-Shared GNSS-Derived Orthometric Heights Using GEOID12B and Published NAVD 88 Heights” provides the differences between the GNSS-derived orthometric heights using GEOID12B and the published NAVD 88 values. This table indicates that there is a large difference (23.4 cm) for station HX2382 (L105 Reset 1962). Since the two ellipsoid heights only differ by 1.0 cm, this is an indication that the station probably moved since it was Reset or the reset observations were performed incorrectly. Either way, this station should not be used in the development of the hybrid model or used by anyone for geodetic control.

    Differences in OPUS-Shared GNSS-Derived Orthometric Heights using GEOID12B and Published NAVD 88 Heights

    Source: National Geodetic Survey Source: National Geodetic Survey

    Since GEOID12B is a hybrid geoid model that was designed to be consistent with NAVD 88 values, I always compute differences between GNSS-derived orthometric heights using the experimental geoid model and published NAVD 88 height values. I described this process in my October 2015 column (http://stage.globalpositioningnews.com/establishing-orthometric-heights-using-gnss-part-3/). The box titled “Differences in OPUS-Shared GNSS-Derived Orthometric Heights Using xGeoid17b and Published NAVD 88 Heights” provides the differences between the GNSS-derived orthometric heights estimated using IGS08 (2005) ellipsoid heights with the xGeoid17b geoid model and published NAVD 88 heights. The values in the column labeled “GNSS-Derived Orthometric Height minus Published NAVD 88” represent an approximate difference between NAPGD2022 and NAVD 88. The box titled “OPUS-Shared GNSS-Derived Orthometric Heights Using xGeoid17b minus Published NAVD 88 Heights” provides a plot that depicts these differences.

    Differences in OPUS-Shared GNSS-Derived Orthometric Heights Using xGeoid17b and Published NAVD 88 Heights

    Source: National Geodetic Survey Source: National Geodetic Survey


    OPUS-Shared GNSS-Derived Orthometric Heights Using xGeoid17b minus Published NAVD 88 Heights

    (Source: Plot Generated Using ArcGIS)

    Image: National Geodetic Survey Source: Plot Generated Using ArcGIS

    Once again, it should be noted that PID HX2382 value is much different from the other values. To look for outliers, a mean difference was removed from the results. The box titled “OPUS-Shared GNSS-Derived Orthometric Heights Using xGeoid17b minus Published NAVD 88 Heights with a Mean Value Removed” makes it easier to see that station HX2382 is an outlier. The station is approximately 25 cm different from its neighboring stations that are only 10 km away. As previously mentioned, this station apparently moved since being Reset in 1962 or the reset observations were performed incorrectly. Identifying stations that have moved since the last time they have been leveled is one of the benefits of participating in the GPS on BMS program.

    OPUS-Shared GNSS-Derived Orthometric Heights Using xGeoid17b minus Published NAVD 88 Heights with a Mean Value Removed

    (Source: Plot Generated Using ArcGIS)

    Image: National Geodetic Survey Source: Plot Generated Using ArcGIS

    For completeness, both a bias and trend were removed from the differences since IGS08 (2005) GNSS-derived orthometric heights and NAVD 88 heights indicate that there’s an apparent long-wavelength trend between the two sets of values. The box titled “OPUS-Shared GNSS-Derived Orthometric Heights Using xGeoid17b minus Published NAVD 88 Heights with Bias and Trend Removed” depict the differences with a bias and trend removed. As in the other figures, PID HX2382 clearly indicates that it is an outlier relative to its neighbors. This station would be rejected by the geoid team when creating the next hybrid geoid model.

    It should be noted that except for the Reset station, all of the differences are less than 2 cm. Although, some relative differences between closely-spaced stations approach 4 cm. For example, the differences between stations HX1746 and HX2496 is -3.7 cm (-1.8 cm – 1.9 cm). The differences in ellipsoid heights from the OPUS Shared solutions are all less than 1.5 cm, even the differences between ellipsoid heights for station HX2382 is only 1 cm. This is an indication that the reset station, HX2382, does not have a valid NAVD 88 published height and should not be used as control. Surveyors that adhere to the FGCS specifications and procedures would realize that this station did not have a valid NAVD 88 height and would not use the published NAVD 88 as control in their project. For example, surveyors performing a leveling project would perform a 2- or 3- mark leveling tie and the results would indicate that the station had moved since it was last leveled.

    OPUS-Shared GNSS-Derived Orthometric Heights Using xGeoid17b minus Published NAVD 88 Heights with Bias and Trend Removed

    (Source: Plot Generated Using ArcGIS)

    Image: National Geodetic Survey Source: Plot Generated Using ArcGIS

    This type of validation procedure should also apply for OPUS users. If a user obtains one OPUS solution and proceeds to perform a survey from that station, the user does not know whether the OPUS height value is reliable or accurate. One solution does not provide any indication of reliability.


    (Source: Merriam-Webster dictionary)

    The OPUS Shared station PID SV0942 (A 25) is an example of two OPUS Shared results generating ellipsoid height values that differ by 10 cm. (See yellow highlighted section in the box titled “Differences in OPUS Shared Ellipsoid Heights for PID SV0942.”) This large difference is significant when you performing a survey where you need heights to better than 3 cm (0.1 foot). This is one reason that NGS requires two OPUS Shared solution for every mark used in the development of the hybrid geoid model.

    Differences in OPUS Shared Ellipsoid Heights for PID SV0942

    Source: National Geodetic Survey Source: National Geodetic Survey

    In the OPUS Shared solutions of PID SV0942, the latest OPUS Shared GNSS-derived orthometric heights (2018-07-14) agrees to about a cm with the published NAVD 88 height, while the 2014 Opus Shared GNSS-derived orthometric height is -11.4 cm different from the published NAVD 88 value. (See yellow highlighted section in box titled “Differences in OPUS-Shared GNSS-Derived Orthometric Heights Using GEOID12B and Published NAVD 88 Heights for PID SV0942.”)

    Differences in OPUS-Shared GNSS-Derived Orthometric Heights Using GEOID12B and Published NAVD 88 Heights for PID SV0942

    Source: National Geodetic Survey Source: National Geodetic Survey

    It should be noted that the error estimates provided in the Opus Shared output indicate the ellipsoid heights are good to about +/- 1 cm. (See highlighted section in box titled “Two OPUS Shared Solution for PID SV0942.”) Saying that, the two NAD 83 (2011) ellipsoid heights disagree with each other by 10.2 cm. I like a quote that is attributed to Mark Twain – “It ain’t what you don’t know that gets you into trouble. It’s what you know for sure that just ain’t so.” (Obtained from http://lukefostvedt.com/famous-quotes-about-statistics/). I’m not suggesting that Opus Shared solutions results are incorrect. I’m attempting to provide an example of why users need to repeat all observations and to demonstrate how error estimates can be misleading.

    “It ain’t what you don’t know that gets you into trouble.It’s what you know for sure that just ain’t so.”

    Mark Twain

    (Source: http://lukefostvedt.com/famous-quotes-about-statistics/).


    Two OPUS Shared Solution for PID SV0942

    (Source: NGS website)

    07/14/2018 OPUS Solution

    Image: National Geodetic Survey

    12/09/2014 OPUS Solution

    Image: National Geodetic Survey

    The number of GPS on Bench Mark stations completed as of July 27, 2018, represents about 30 percent of the total number of stations that need to be observed. As I have explained in previous columns, there are many invalid GPS on BMs stations that may be used in the next hybrid geoid model unless more bench marks with valid NAVD 88 heights are observed with GNSS. NGS will accept data for inclusion in the next hybrid geoid model, GEOID18, until the end of August 2018. After that, NGS’ GPS-on-Bench-Mark Program will expand to include other regions and will focus on data to improve NGS datum transformation tools. This column provided an update and status report on stations observed in support of the 2018 GPS on BMs program, provided an example of how the OPUS Shared results can be used to identify a station that may have moved since it was last leveled, and the importance of repeating OPUS observations. I would encourage users to register for NGS’ next webinar on the GPS on Bench Mark Program scheduled for Thursday, Aug. 9th to hear the latest status of the program.