1Spatial has released 1Data Gateway, an intuitive self-service web-portal for handling data validation, data processing and data enhancement.
1Data Gateway forms part of 1Spatial’s Location Master Data Management (LMDM) suite of products which ensures spatial data quality and consistency across the enterprise.
Available in the cloud or on-premise, 1Data Gateway offers internal and external users a secure, fully scalable and customisable product to handle both spatial and non-spatial data files. Transportation and infrastructure companies, government agencies, and utility companies are among the types of organisation that can utilise 1Data Gateway to help improve productivity, lower costs and guarantee control, compliance and data governance, for their data supply chains.
1Data Gateway applies 1Spatial’s renowned rules-based approach to help users manage their data. For organisations dealing with complex and varied supply chains, 1Data Gateway ensures data is checked at source. Using the centralised management of suppliers, partners and rules to create a collaborative approach, it promotes efficiency in data capture and submission across the supply chain.
Users simply upload their data files by dropping them onto the interface and 1Data Gateway applies the high-performance rules that have been pre-configured by an administrator in order to perform validation, correction or enhancement. This process means that users do not require training and can get results within minutes.
Once processed, results can be previewed on a map or downloaded into a local system. 1Data Gateway empowers administrators by providing analytics and dashboard capabilities to track and analyse the quality of the data that groups or organisations are submitting.
“We believe 1Data Gateway has the power to transform the manipulation of spatial data. We’re always driven by the needs of our customers, and in identifying the requirement for an easy to use, yet powerful portal for data quality and integration, we’ve developed 1Data Gateway,” Seb Lessware, CTO, 1Spatial said.
“Our customers need to unlock information contained within spatial data from multiple suppliers, in multiple formats, often submitted via different means. 1Data Gateway provides a single place for data submission, allowing the data to be validated, harmonised, cleaned and enhanced, making it fit for purpose and allowing the insight it can provide to be unlocked. It’s an exciting update to our product range, and should help revolutionise the way organisations manage their data flow.”
Blazegraph, creator of a high-performance database for large graphs, is now offering version 2.1.0. Updates of the graphics processing unit (GPU) accelerated program give users faster, easier access to key data sets, such as new support for processing geospatial coordinates and optimizing queries against the National Center for Biotechnology Information’s (NCBI) PubChem database.
In addition, Blazegraph 2.1.0 provides new tools that enable semantic search on the largest data published in the Linked Open Data structure, which is heavily used in global publishing, cultural and open government projects.
To deliver the speed and performance needed to work with these massive data sets, version 2.1.0 includes significant improvements to its bulk load and query performance capabilities.
Another Blazegraph user, Seven Bridges, is a biomedical data analysis company selected by the National Cancer Institute to develop the Cancer Genomic Cloud program. This first complete ecosystem gives cancer researchers immediate access to one of the world’s largest genomic data sets — The Cancer Genome Atlas (TCGA) — and the computational resources to analyze it.
“We chose Blazegraph to manage the metadata on the Cancer Genomics Cloud because it helps researchers to easily build complex queries based on how they think, not on how the data is stored,” said Igor Bogicevic, CTO at Seven Bridges. “In addition to helping scientists find the data they need, Blazegraph and its new 2.1.0 version is just plain fast. It helps us deliver the scale and performance needed to meet some of the biggest cancer genomics data analysis challenges.”
CartoDB, a world leading company for location intelligence, data analysis, and visualization, has launched Deep Insights, a technology layer that enables the visualization, dynamic filtering, and exploration of large location datasets at unprecedented scale and scope.
With CartoDB’s Deep Insights technology, datasets can be enriched or augmented by existing geospatial data from various sources with a diverse number of fields, such as census information or administrative boundaries. Once data is processed by Deep Insights, users can further filter, pan, zoom and granularly narrow in on data to view trends and patterns that, in traditional reports, would otherwise go unnoticed.
Deep Insights is also equipped with a suite of interactive widgets and command controls so users can tailor the interface for the best experience. It can be implemented to stand-alone or configured and integrated with users’ own application workflow.
“The launch of Deep Insights involves a redefinition of the role of geospatial data visualization and analysis in maps, empowering the way people analyze and interact with massive amounts of existing data. For CartoDB it was the next logical step to follow,” said Sergio Álvarez Leiva, CPO, CartoDB. “The creation of a new visualization technology capable of identifying trends and patterns with big data, literally making the invisible visible.”
CartoDB is launching Deep Insights at Mobile World Congress, being held Feb. 22-25 in Barcelona, Spain. The company is demonstrating the technology in partnership with Mobile World Capital, an organization dedicated to bringing mobile transformation to the city of Barcelona. Deep Insights will be used to analyze the influx of tourism in Barcelona and identify opportunities for increased revenue through tourism per location. The collaborative project will leverage three sets of data, including data on key touristic spots, social media activity, and payments from BBVA bank.
Deep Insights is made available through a single, user-friendly interface that allows users to explore location-related insights visually on a map. It has a fixed pricing structure to allow for unlimited scale with no cap on usage, starting at $100 for 1GB in memory data.
Trimble introduced several new products at InterGeo 2014, being held this week in Berlin, with a focus on incorporating data from photographs and imagery into geospatial databases.
Trimble also offered an expanded GNSS portfolio for surveyors that includes the Trimble NetR9 Geospatial receiver; the Trimble Geo7X with Trimble Access field software onboard; and enhanced Trimble xFill functionality that provides continuous RTK level accuracy when paired with a Trimble CenterPoint RTX subscription. The new additions offer surveyors more flexibility in the field to meet a variety of work requirements. Learn more here.
Photo: Trimble
Inpho version 6.0. Trimble announced a new version of its photogrammetric software suite, which provides highly automated workflows for photogrammetry and remote sensing professionals so they can process thousands of airborne images with high precision. Inpho version 6.0 increases efficiency by reducing project turnaround times and improves the quality of deliverables via new automated and interactive tools and satellite triangulation functionality.
A new satellite triangulation function in Inpho version 6.0 allows professionals to quickly generate deliverables from satellite imagery data and expand their capabilities, addressing the needs of industries such as environmental, forestry, agriculture and land management. Automatic tie point extraction and bundle block adjustment provides improved orientation of satellite images. The highly automated process results in a significant reduction in office processing time so projects can be delivered with quality precision in a shorter turnaround time.
Photo: Trimble
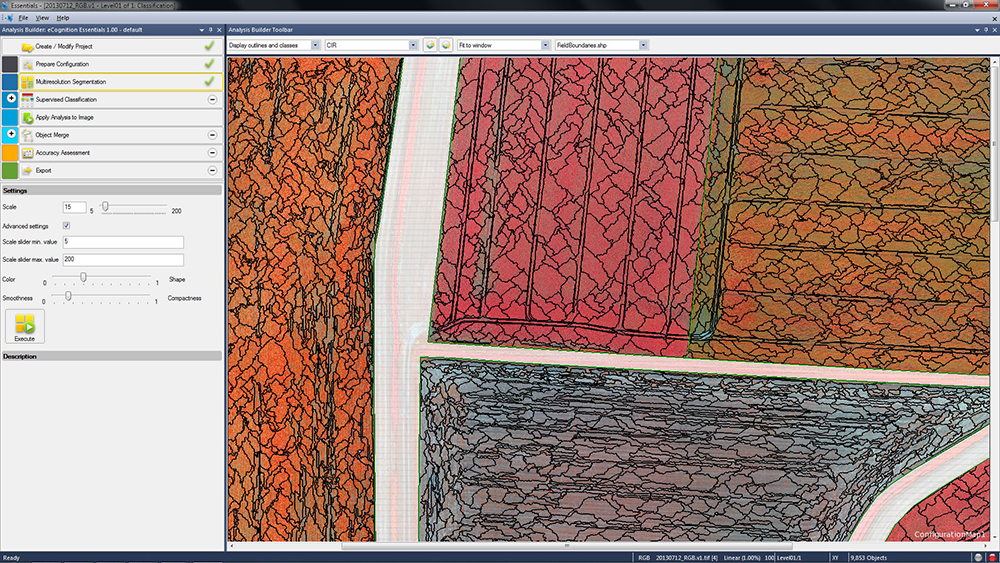
eCognition Essentials. eCognition Essentials is a new software solution for geospatial and remote sensing professionals performing land-cover mapping tasks using satellite imagery. eCognition Essentials offers an intuitive image analysis solution that allows users of all levels to quickly produce high-quality, Geographic Information System (GIS)-ready deliverables.
Leveraging core eCognition software technology, eCognition Essentials is easy to use with its simplified and intuitive interface. eCognition Essentials reduces analysis error as it applies predefined and structured rules to analyze and transform imagery data into relevant geospatial information. The new automated image analysis functions — such as image segmentation or sample-based classification — combined with a set of interactive tools for quality control offer users a streamlined workflow for quicker project turnaround times.
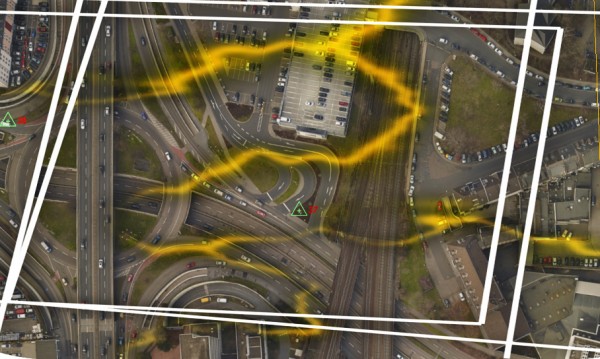
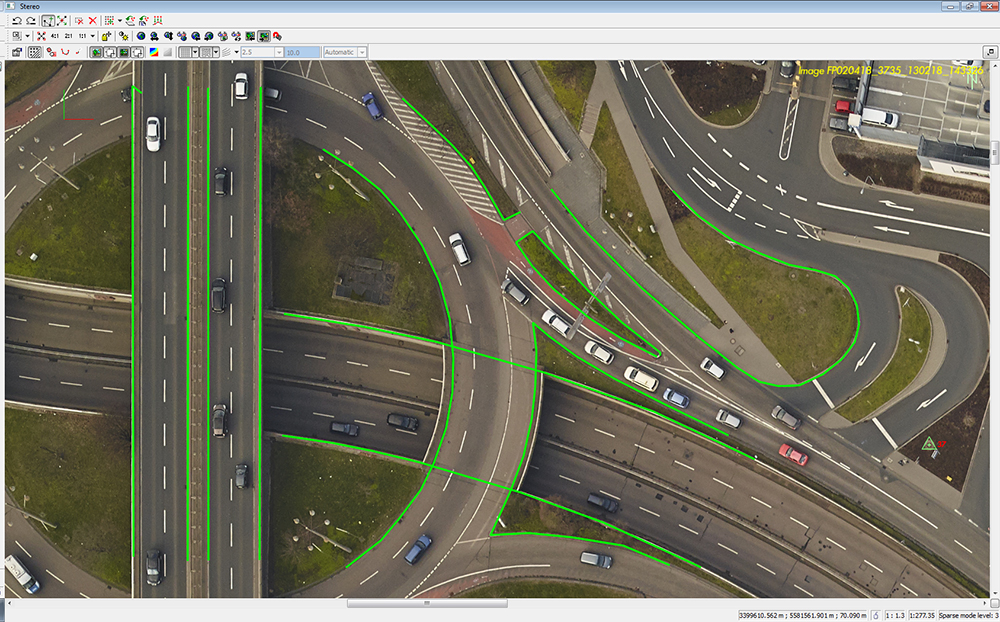
Trident version 7.0 is a new version of the mobile data analysis software designed to efficiently manage, interpret and extract features from digital images and point cloud data collected via land mobile systems. Enhancements in the new version significantly reduce the time required for geospatial professionals to transform land mobile sensor data into relevant geospatial information used in civil engineering, transportation and GIS mapping. In these applications, Trimble Trident can be used for surface modeling, roadway sign and pole detection, lane marking detection, edge and breakline detection, road geometry and clearance measurements.
Trident version 7.0 offers increased automation functionality to deliver results more quickly. Updated feature extraction tools within the software provide greater reliability and minimize manual editing and verification. Trident version 7.0 breakline detection routines now include a cross-sectional workflow for rapid and progressive development of supervised roadway breakline models.
Photo: Trimble
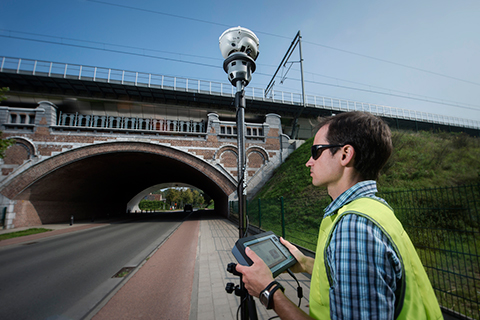
Trimble V10 Imaging Rover. The Trimble V10 is an integrated camera system that precisely captures 360-degree digital panoramic images for visual documentation and measurement of the surrounding environment. Enhancements include additional integration options and high-dynamic range (HDR) imagery. The Trimble V10 offers an accessible and efficient means of visually documenting site conditions to perform measurements in the office, produce more powerful deliverables and speed up decision making for managers on or off the site.
In addition to the R10 GNSS receiver, the Trimble V10 Imaging Rover now seamlessly integrates with Trimble’s R-Series GNSS receivers — the Trimble R8, R6 and R4 — and TSC3 controller. Through this seamless integration, geospatial professionals can easily capture high-quality, geo-referenced panoramic images to document the surroundings. Now more Trimble customers can take advantage of the Trimble V10’s powerful capabilities. In addition, a new two-piece power rod option enables easy transportation of the Trimble V10.
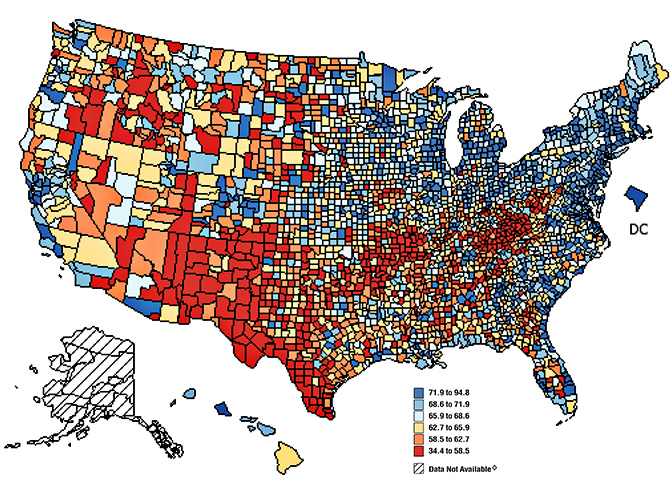
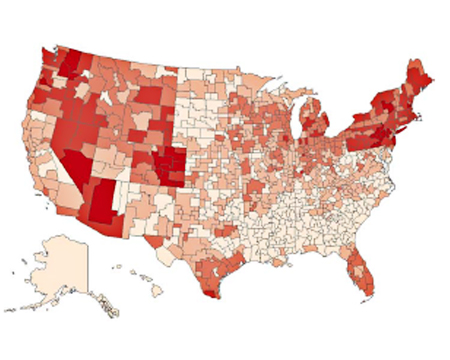
Figure 1. Mammograms in last two years; percent of respondents, by counties.
Trends Discerned in the National Cancer Institute’s Geospatial Databases Carry the Fight Forward
Location matters in cancer, as in many other things. The National Cancer Institute (NCI) recognized this fact more than 40 years ago, and its researchers have been investigating striking geographic differences in many cancers ever since. Most studies have found that these differences were due to lifestyle differences, such as levels of smoking and diet, although research into possible environmental causes are hampered by a lack of exposure data during the relevant period, 20–30 years prior to diagnosis.
Geospatial tools serve NCI in a variety of applications, including:
the identification and display of the geographic patterns of cancer incidence and mortality rates in the U.S. and their change over time,
the creation of complex databases for the study of cancer screening, diagnosis, and survival at the community level,
environmental exposure assessment through satellite imagery,
spatial statistical models to estimate cancer incidence, prevalence, and survival for every U.S. state,
communication of local cancer information to the public and public health professionals through interactive web-based tools,
the identification of health disparities at the local level through the comparison of cancer outcomes across demographic subgroups, and
development of new methods of displaying geospatial data for clear communication to the public and for examination of complex multivariate data by researchers.
Division of Cancer Control and Population Sciences
The Epidemiology and Genomics Research Program (EGRP) and the Surveillance Research Program (SRP) support grant research to use GIS in cancer research and the development of methodologies to accomplish this research. EGRP also funded the development and maintenance of a geographic information system for breast-cancer studies on Long Island (LI GIS). The LI GIS is available to researchers and can be used to study other types of cancer and conditions as well.
Surveillance Research Program
The Statistical Methodology and Applications Branch (SMAB) contributes to GIS research by developing statistical methods for the analysis, display, and web-based communication of geo-referenced cancer data.
The Surveillance Systems Branch (SSB) oversees the Surveillance, Epidemiology, and End Results (SEER) program, an integrated, comprehensive, multiple population-based reporting system of cancer registries covering 26% of the U.S. population. Cancer incidence information is provided at the state, county, and census-tract level. Investigators in SEER’s Rapid Response Surveillance Studies (RRSS) are exploring and applying GIS technology in several areas.
Division of Cancer Epidemiology and Genetics
The Epidemiology and Biostatistics Program (EBP) has a long history of publishing the NCI cancer atlases.
The Occupational and Environmental Epidemiology Branch (OEEB) has an active research program in using satellite imagery to estimate the potential exposure to cancer-causing environmental agents by individuals living in agricultural areas.
As to the finer granularity customarily seen in GIS databases by professionals using them in mapping, natural resource and asset management, utilities, and other sectors, researcher Linda Pickle of Pennsyslvania State University and StatNet Consulting comments:
“The SEER program at NCI does get the census-tract identification from the registries, but you have to get permission to use it. Mortality is only reported to NCHS at the county level. Therefore, all nationwide maps of cancer rates (incidence or mortality) must be at the geographic level available for all states, that is, county. Each state has the option to present its own data at smaller levels.
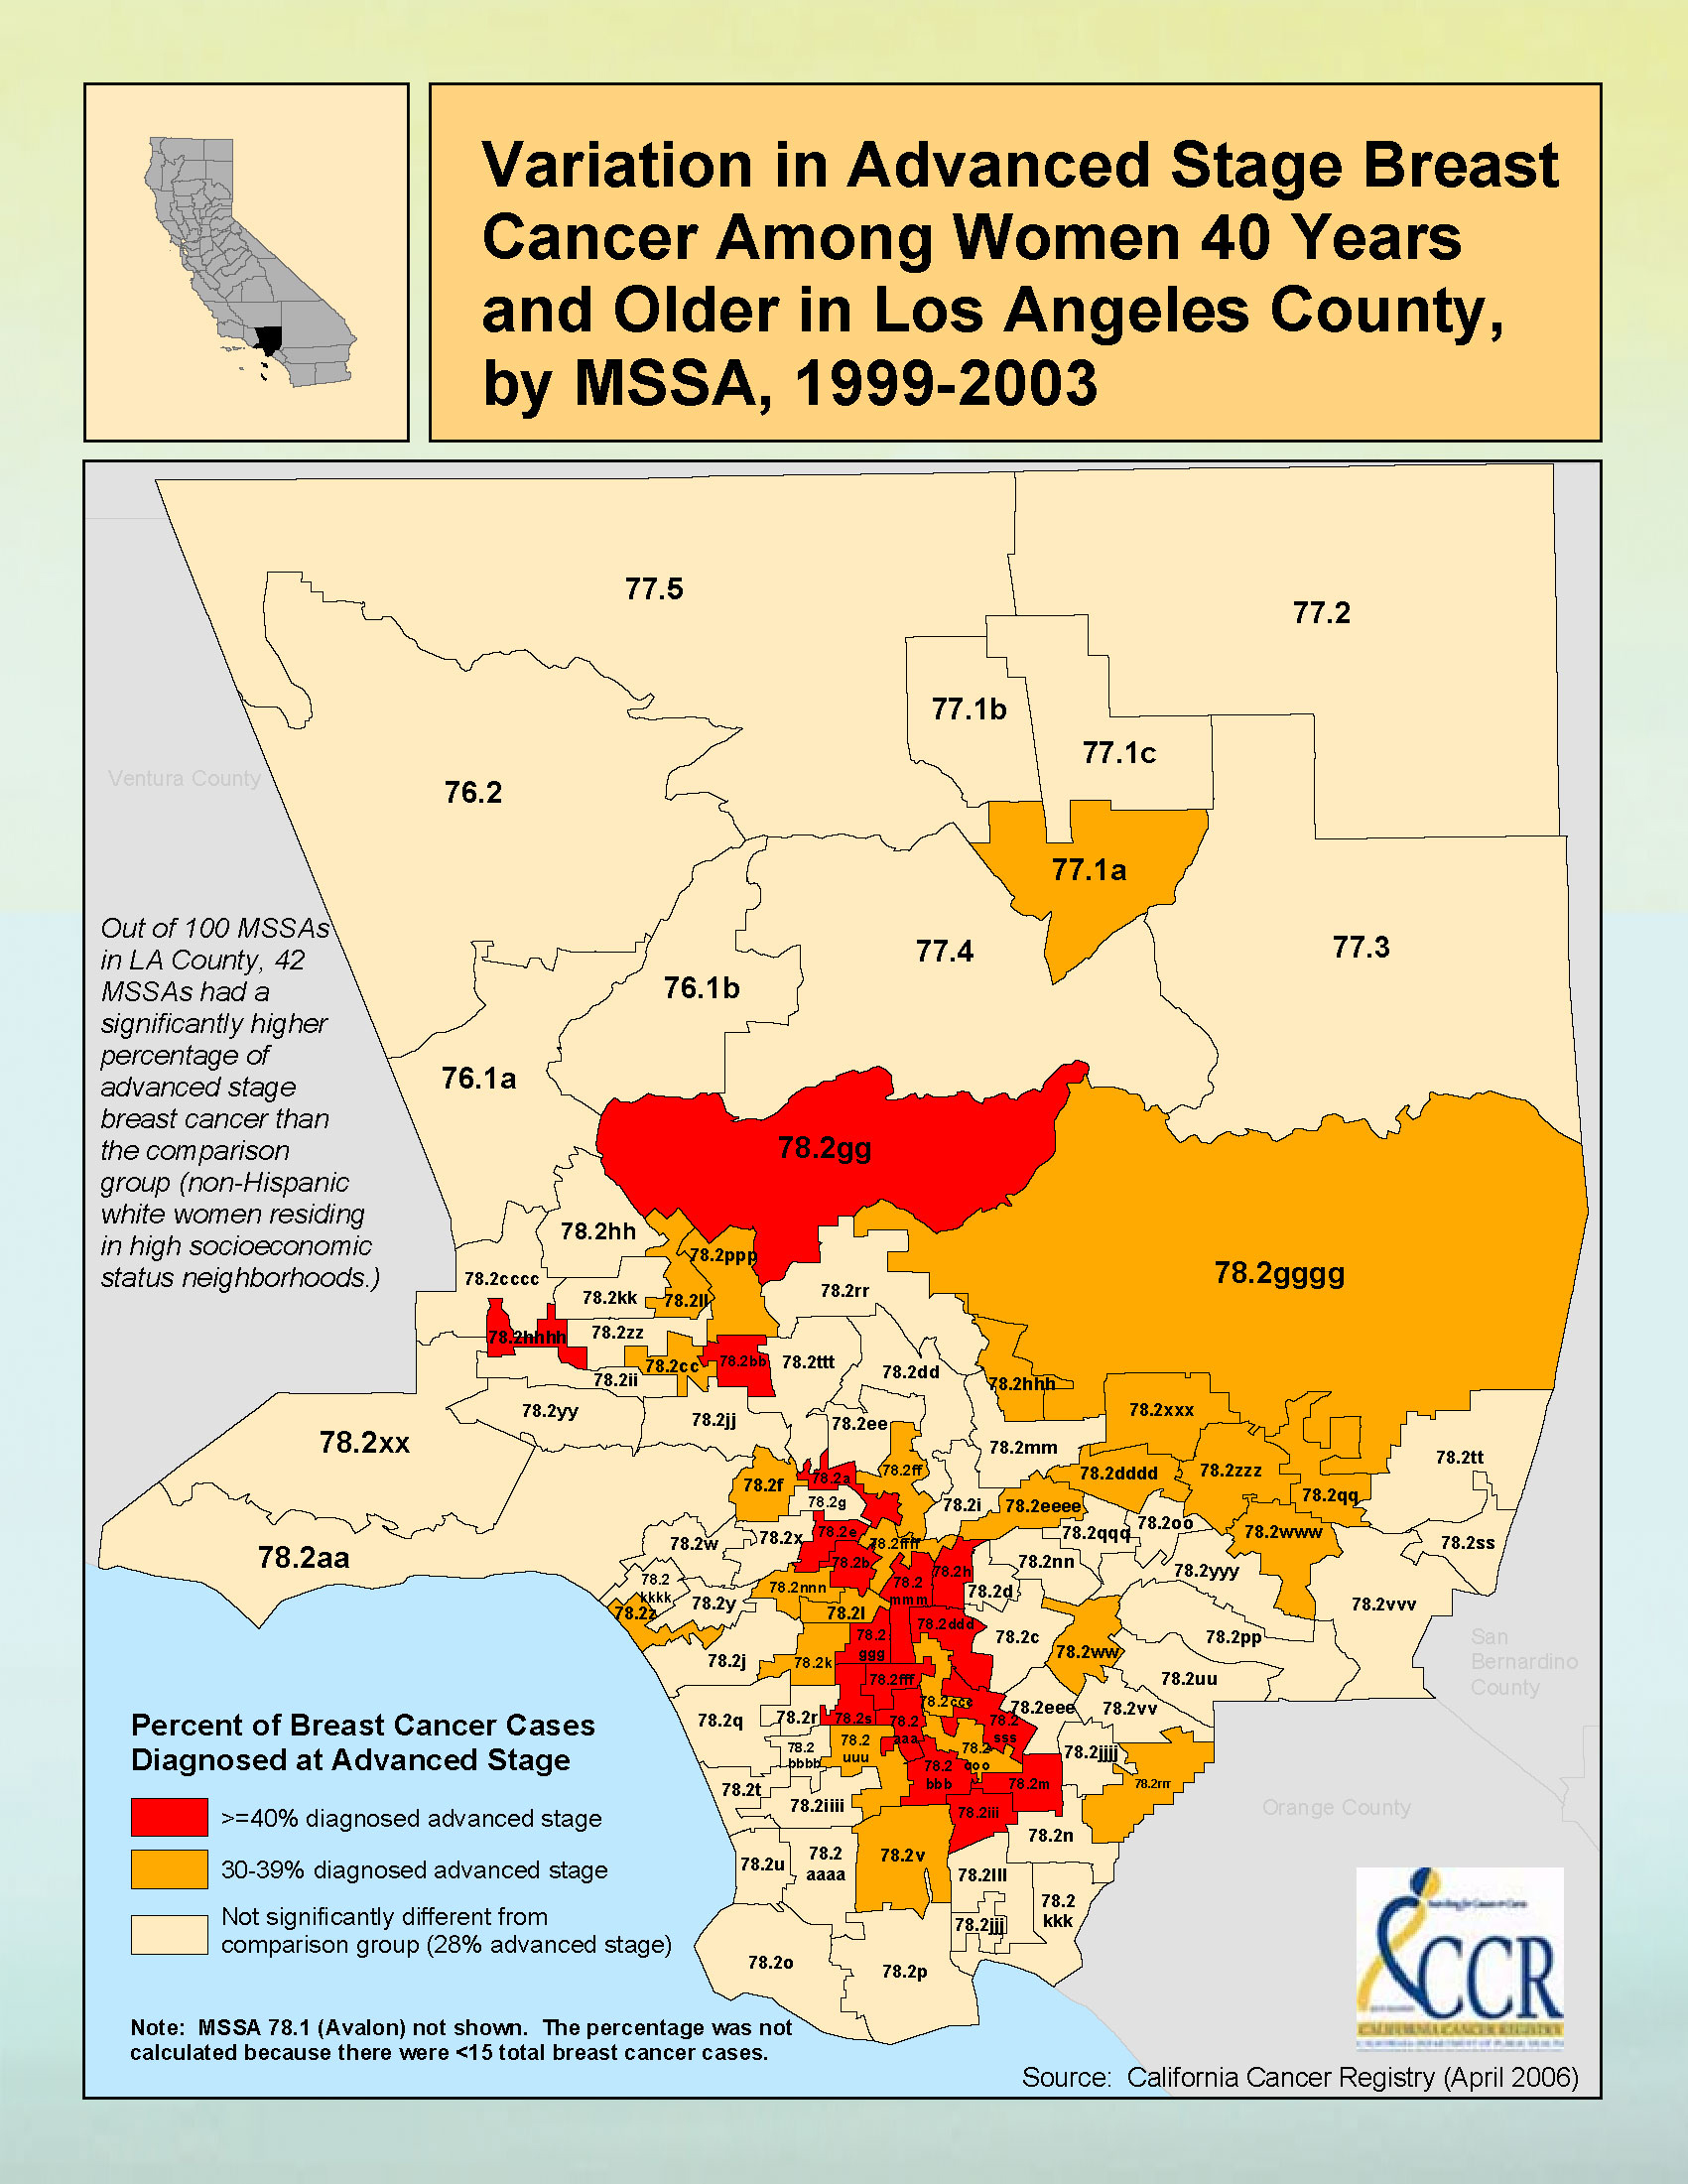
“Figure 2 gives an example of sub-county maps published by California Cancer registries. California is densely populated in many counties, and so the state has defined aggregations of census tracts for their maps. Some of California is in the SEER program; other parts have registries funded by the Centers for Disease Control (CDC).”
Figure 2. Breast cancer data for Los Angeles County.
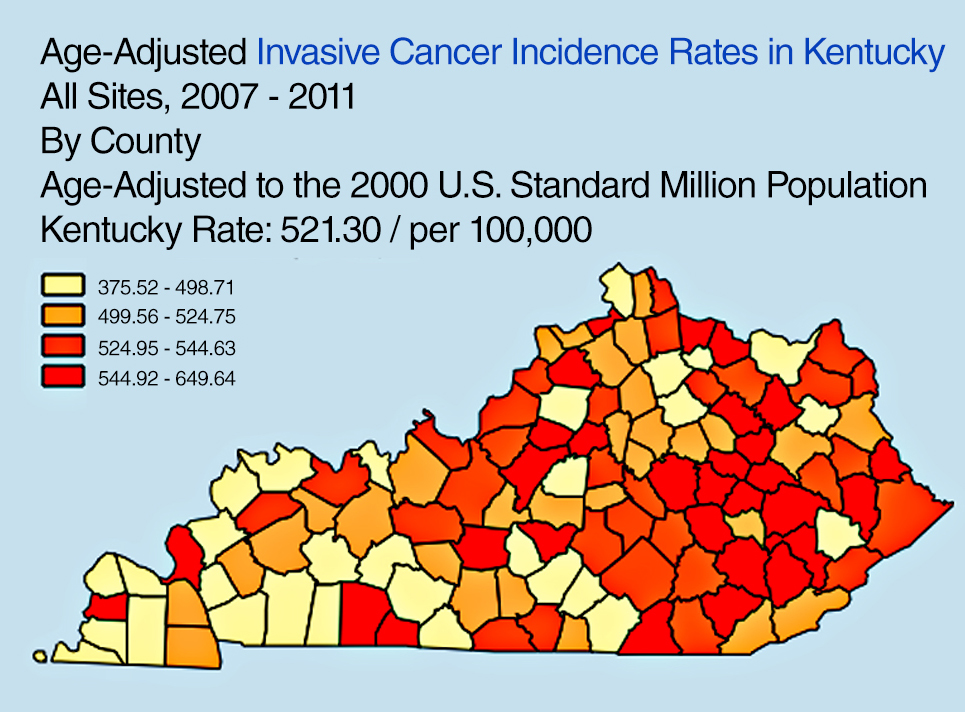
“Another state example: the Kentucky SEER registry has developed a useful online tool to explore Kentucky cancer patterns,” Pickle said. “See Figure 3. This design has been used by CDC for an online U.S. cancer atlas and by other states.”
Figure 3. Cancer incidence rates in Kentucky.
FURTHER READING
Visualizing Data Patterns with Micromaps By Daniel B. Carr and Lindia Williams Pickle
Cancer surveillance — an assessment of the number and type of cancer cases that occur in an area and in a specified population — provides critically important information needed for determining geographic variations in cancer rates and for planning cancer control intervention programs.
By Li Zhu, Linda W. Pickle, Zhaohui Zou, and James Cucinelli
This article is about projecting from the data that were available from surveillance/data-collection efforts to get estimates of the number of new cancer cases that would occur in the upcoming calendar year. That is, we used data from up to four years previous (because of the time it takes to find cases, process data, and so on) to get a current estimate of the number of cases.
We developed the statistical model to do this in 2006, then validated it, modifying the temporal projection method a few years ago. This method was then adopted by the American Cancer Society to produce the numbers of new cases published in their annual Cancer Facts & Figures reports, the most cited cancer reference in the world.
Since the models did not break out childhood cancers, we repeated the modeling process to do that, resulting in the paper cited here.
The method requires first a spatiotemporal prediction across the extensive years of data, since not all cancer registries have data for every year, and secondly a four-year temporal projection from the most current data point to the current calendar year. Here we use this same process applied only to childhood cancer data.
The generalized linear mixed effects model is applied to observed childhood cancer case counts reported to the North American Association of Central Cancer Registries over 1995– 2006 to predict case counts and incidence rates for every U.S. state and the U.S. total (for patients aged 0 to 19 and for major cancers among childhood). Covariates included in the model are measures of income, education, housing, urban/rural status, health insurance coverage, smoking, obesity, and cancer screening. Temporal trends and spatial distribution patterns are compared among childhood cancers for males and females.
Results. A total of 15,168 new cancer cases was projected for the 0–19 age group, with 10,032 childhood cancer cases younger than age 15, and 5,136 cases in the 15–19 age group, in the United States for 2010. There are more male cancer cases than female cases in all three age groups for most cancer sites. The order for the most common malignancies diagnosed in children differs by age group and sex. The study also identifies differences in the geograhic patterns at a small geographic area level by gender, and temporal trends by gender and subsites of childhood cancer incidence.
Conclusions. The resulting set of predictions provides annual estimates for states that did not provide data at all, and projections ahead in time to the current calendar year for every U.S. state and the United States in total. These projections fill in the data gaps for recent years of diagnosis and state registries to provide complete count and rate estimates for childhood cancers for all states, regions, and the U.S. in total for the current calendar year.
(The full article, “Trends and patterns of childhood cancer incidence in the United States, 1995–2010,” appears in Statistics and Its Interface, Volume 7 (2014), pp. 121-134.)
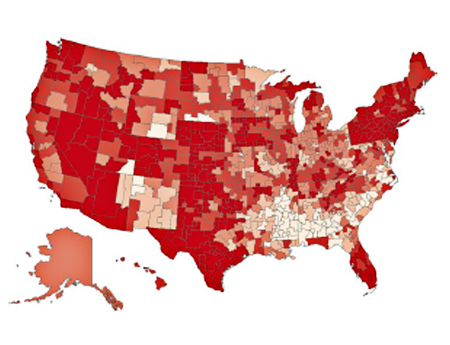
Figure 1. Rates, Ages 0–19 of All Childhood Cancers at HSA Level, 1995–2006, Female. From lightest to darkest: 10.0–14.5,14.6–15.5,15.6–16.5,16.6–17.5,17.6–22.2 per 100,00.Figure 2. Rates, Ages 0–19 of All Childhood Cancers at HSA Level, 1995–2006, Male;
Urban Sprawl, Obesity, and Cancer Mortality
Cross-Sectional Analysis and Methodological Challenges
By David Berrigan, Zaria Tatalovich, Linda W. Pickle, Reid Ewing, and Rachel Ballard-Barbash
Urban sprawl has the potential to influence cancer mortality via direct and indirect effects on obesity, access to health services, physical activity, transportation choices, and other correlates of sprawl and urbanization.
Methods. This paper presents a cross-sectional analysis of associations between urban sprawl and cancer mortality in urban and suburban counties of the United States.
A major focus of our analyses was to adequately account for spatial heterogeneity in mortality. Therefore, we fit a series of regression models, stratified by gender, successively testing for the presence of spatial heterogeneity. Our resulting models included county-level variables related to race, smoking, obesity, access to health services, insurance status, socioeconomic position, and broad geographic region, as well as a measure of urban sprawl and several interactions.
Results. Total cancer mortality rates were higher in less sprawling areas and contrary to our initial hypothesis; this was also true of obesity-related cancers in six of seven U.S. regions (census divisions) where there were statistically significant associations between the sprawl index and mortality. We also found significant interactions between region and urban sprawl for total and obesity-related cancer mortality in both sexes.
Conclusions. Despite higher levels of obesity in more sprawling counties in the U.S., mortality from obesity-related cancer was not greater in such counties. Identification of disparities in cancer mortality within and between geographic regions is an ongoing public health challenge and an opportunity for further analytical work identifying potential causes of these disparities. Future analyses of urban sprawl and health outcomes should consider exploring regional and international variation in associations between sprawl and health.
“Urban sprawl, obesity, and cancer mortality in the U.S.: cross-sectional analysis and methodological challenges,” in International Journal of Health Geographics, January 2014.)
GPS-Measured Physical Activity in Non-Small-Cell Lung Cancer
By C.L. Granger, L. Denehy, C.F. McDonald, L. Irving, R.A. Clark
Physical activity (PA) is increasingly recognized as an important outcome in non-small-cell lung cancer (NSCLC). We investigated PA using GPS, tracking individuals with NSCLC and similar-aged healthy individuals.
Methods. Fifty individuals with NSCLC and 35 similar-aged healthy individuals without cancer were included. Primary measures were triaxial accelerometery (steps/day) and GPS tracking (outdoor PA behavior). Secondary measures were questionnaires assessing depression, motivation to exercise, and environmental barriers to PA.
Results. Individuals with NSCLC engaged in significantly less PA than similar-aged healthy individuals and had higher levels of depression and lower motivation to exercise. Daily outdoor walking time and distance traveled away from home were not different between groups. Individuals with NSCLC spent less time outdoors in their local neighborhood area. A greater number of steps per day was seen in patients who were less depressed or had better access to nonresidential destinations such as shopping centers.
(The full article, “Physical Activity Measured Using Global Positioning System Tracking in Non-Small Cell Lung Cancer: An Observational Study,” appears in Integrative Cancer Therapies, July 2014.)