Beginning in September, GPS stations in Kilauea’s upper East Rift Zone observed increased rates of uplift, higher than they have been since the end of the eruption in 2018. According to the U.S. Geological Survey’s Hawaiian Volcano Observatory, earthquake rates increased in late November.
On Dec. 2, GPS stations and tiltmeters recorded a ground deformation quake at Kilauea’s summit accompanied by earthquake swarms.
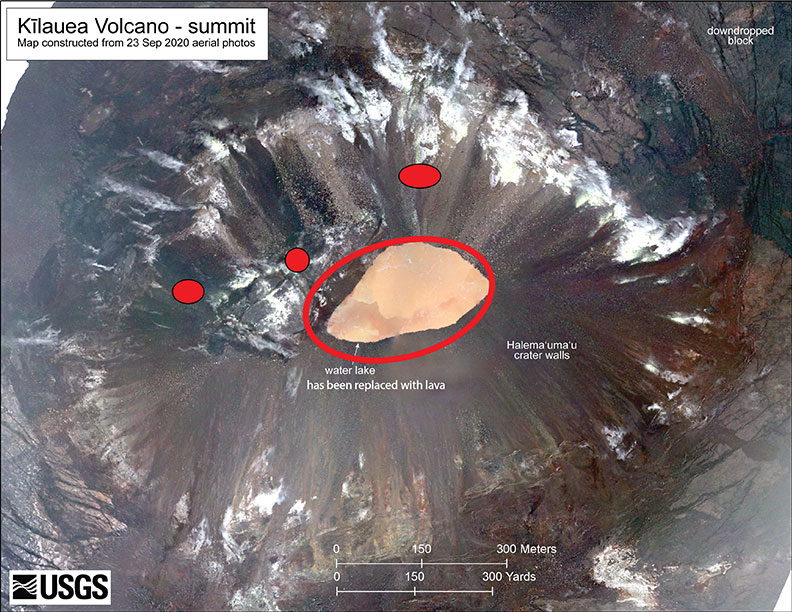
Then on Sunday, Dec. 20, a magnitude 4.4 earthquake struck on Kilauea’s south flank and three fissure vents broke open inside the caldera. Fountaining lava at these vents is estimated to be up to 82 feet high. The vents are feeding lava flows into the base of Halema‘uma‘u crater, which is being filled with lava. The lava lake has been rising several yards an hour since the eruption began at 9:36 p.m. Sunday. The eruption is currently confined to the crater.
According to the observatory, “The water lake at the summit of KIlauea has boiled away and an effusive eruption has commenced, with three vents in the wall of Halema‘uma‘u crater generating lava flows that are contributing to a growing lava lake at the base of the crater.”
As of Dec. 29, the summit eruption continued with the western vent active (the other vents have been covered by the lava lake). At 3:45 a.m. HST, field crews measured the lava lake as 179 meters (587 feet) deep, about 650 feet below the rim.
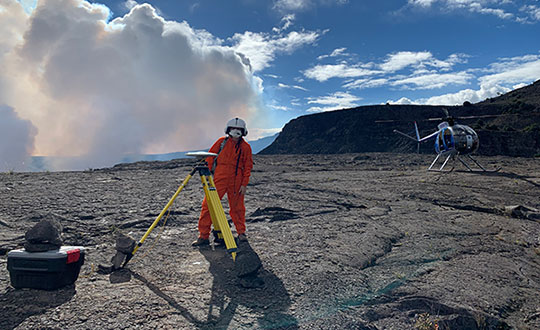
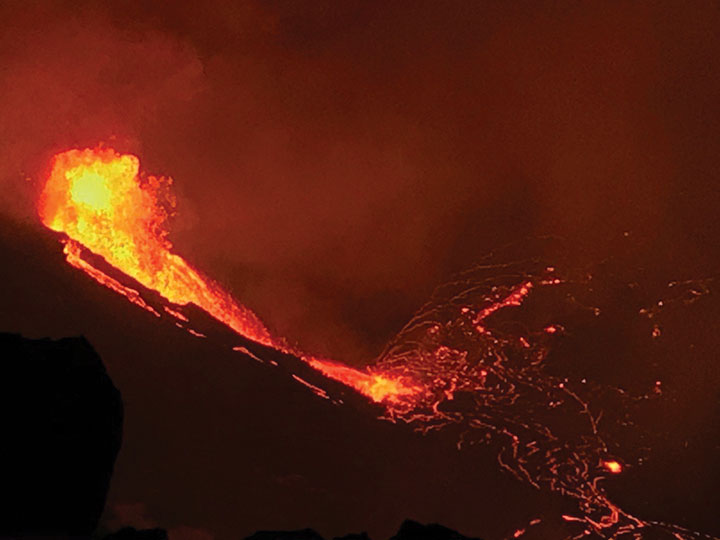
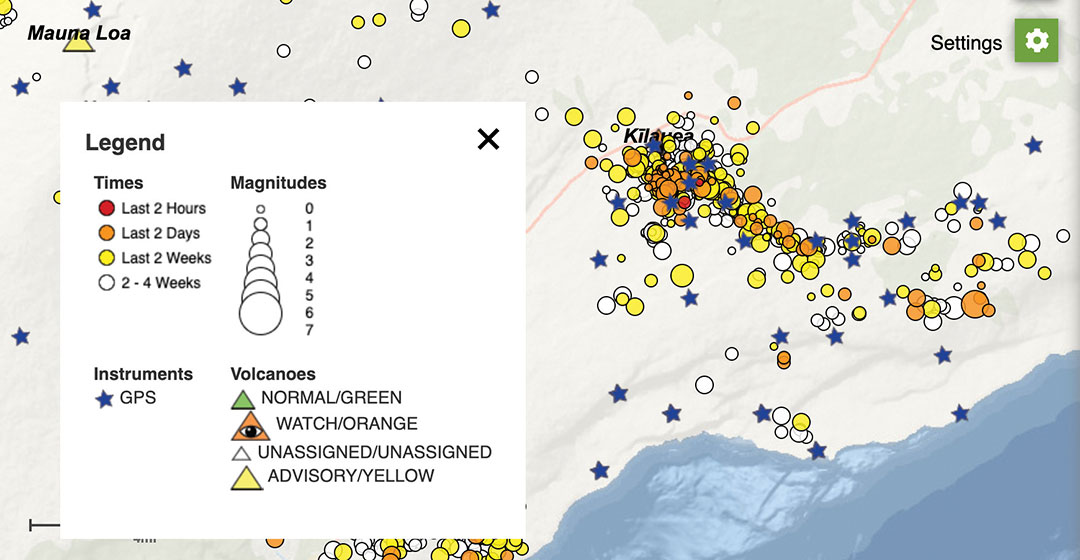
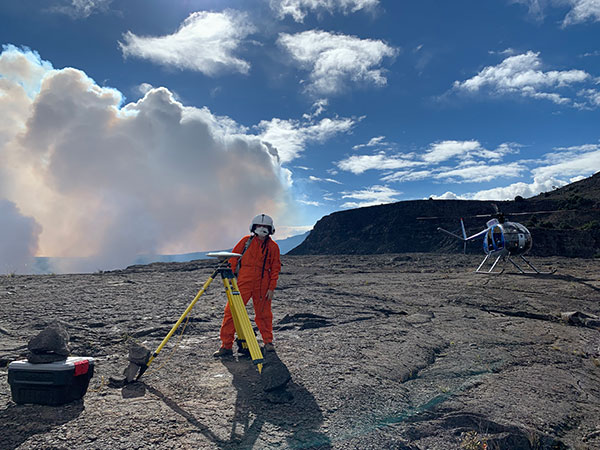
Shortly after 9:30 p.m. HST Dec. 20, an eruption began at the summit of Kīlauea Volcano in Hawaii. Red spots indicate fissure vents feeding lava into the bottom of Halema‘uma‘u crater. Lava coverage is 32 feet higher than the water in this photo (base map is from imagery collected on Sept. 23, 2020).The water lake at the base of Halema‘uma‘u crater has been replaced with a growing lava lake. View from the west rim of Kīlauea Caldera just before 5 a.m. HST on Dec. 21, 2020. A 59-foot fountain joins two other fissures to feed a growing lava lake at the base of Halema‘uma‘u crater. (Photo: USGS)The interactive USGS monitoring map shows GPS stations situated on and around Kilauea as well as volcano activity. (screenshot taken at 12 p.m. HST on Dec. 21).An HVO geophysicist deploys a GPS receiver on the Kilauea caldera floor to measure changes in ground motion. A volcanic gas plume rises in the background. GPS and tiltmeter data show contraction in the upper portion of the East Rift Zone (an area between Kīlauea’s summit and Pu‘u ‘Ō‘ō). (Photo: USGS)
Looking southwest towards Leilani Estates with Fissure 8 erupting in the background. (Image: Ron Chapple/GEO 1)
High-resolution lidar surveys help first responders, scientists and government agencies monitor Kilauea conditions and predict future lava flows.
Independent geospatial data firm Quantum Spatial Inc. (QSI) has conducted high-resolution lidar surveys of areas surrounding the Kilauea volcano eruption in Hawaii.
The emergency response effort was part of the U.S. Geological Survey’s (USGS) Rapid Response Imagery Products (RRIP) in support of the Kilauea’s 2018 East Rift Zone – Remote Sensing Acquisition Requirement.
The USGS Hawaiian Volcano Observatory (HVO), along with emergency responders, government agencies and academics, will use the data to better understand the conditions and characteristics of the Kilauea volcano, which has been continually erupting since May 3.
Data also will assist planners in modeling potential lava flows, which may better predict and respond to future flows and enhance safety of residents.
The USGS National Geospatial Program (NGP) selected QSI to perform the first of two planned surveys over the active volcanic area. The QSI team, which included GEO1 and Windward Aviation, deployed within days to acquire high-resolution lidar at point densities averaging from 40 to 80 ppsm, with up to 150 ppsm in select areas and 100-mp digital imagery using a Riegl dual VUX-1 LR sensor pod equipped with ABGPS/IMU mounted on a Hughes 500D helicopter.
Five distinct locations, covering an area of 57 square miles, were targeted:
Kīlauea Summit Caldera
Pu’u O’o Crater and flow
Chain of Craters Road / Kaoe
Puna Geothermal Venture (PGV)
Western Leilani Estates lava field.
The project required 11 missions over the course of six days, operating at times as low as 500 feet above the ground and above active flows and nearby erupting calderas. With a need for a quick turn around, QSI deployed an analyst with the flight crew to post process each mission within hours of collection.
The data was uploaded to the Geospatial Repository and Data Management System (GRiD) interface, developed by the U.S. Army Corps of Engineers (USACE), where additional data products have been developed and provided to the response team that includes FEMA, Hawaii’s Emergency Operations Center (EOC) and the Hawaii County Civil Defense.
After data collection, QSI measured topographic shifts during the processing by comparing new data with a 2011 lidar collection from the same area. Survey specialists and USGS experts confirmed within hours of processing QSI’s lidar data that areas within the site had shifted up to 1.5 meters east, 2 meters to the north and 1 meter in elevation.
USGS scientists will continue to examine the new topographic data to better understand the nature of these shifts, and integrate it into lava flow models for more accurate predictive modeling.
“Airborne lidar and imagery remote sensing surveys are invaluable tools for understanding the effects of active volcanic eruptions, which change the topography as fissures emerge and lava flows extend to the ocean,” said Michael Shillenn, vice president at QSI. “We were honored to work with the USGS and others on this critical project. We believe that data and analysis provided by the QSI team will provide insights into future scenarios, enabling emergency responders to protect the surrounding community.”
GPS measurements are playing a key role in monitoring the erupting Kilauea volcano in Hawaii.
The floor of the Pu’u ‘O’o Crater started to collapse on April 30, following weeks of uplift and increasing lava levels within the cone and seismicity in the East Rift Zone. The eruptions began on May 3, when a magnitude 5 earthquake struck, causing further collapse of the crater.
The Hawaiian Volcano Observatory (HVO) has monitored volcanic activity on the islands since 1912. The HVO is operated by the U.S. Geological Survey (USGS) and is issuing continuous updates on Kilauea.
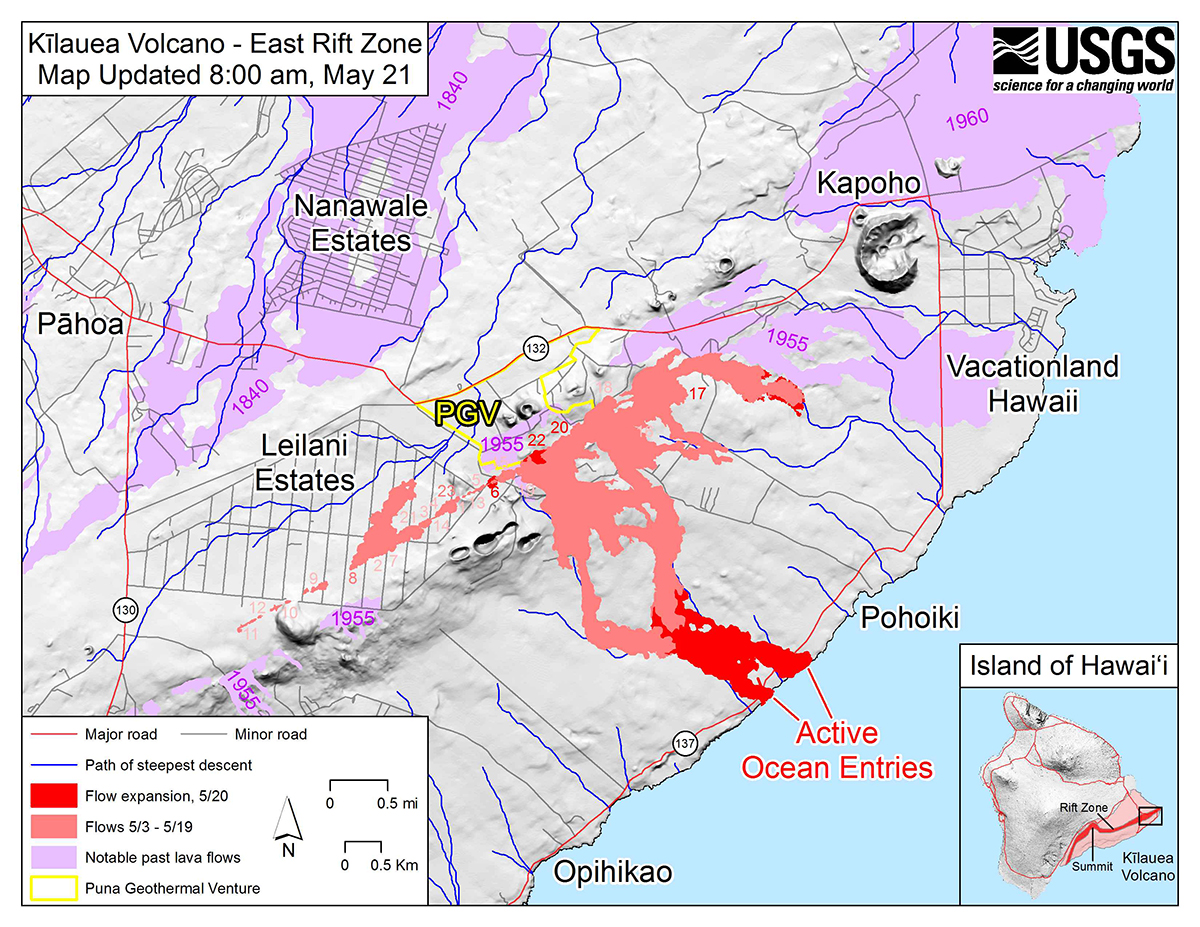
The HVO is closely monitoring the biggest fissures in what is known as the lower East Rift Zone. Geologists are onsite to track ongoing and new fissure activity and the advance of lava flows.
Kilauea eruption map as of 8 a.m. HST, May 21. Shaded purple areas indicate lava flows erupted in 1840, 1955, 1960 and 2014–2015. (Photo: USGS)
GPS stations monitor land movement of Kilauea. The Big Island’s most active volcano has erupted nearly continuously for more than three decades.
“Magma supplied to the Lower East Rift Zone was indicated by the northwest displacement of a GPS monitoring station,” the HVO said in its May 26 status update, but the station ceased movement a few hours later, telling a new story.
“Magma continues to be supplied to the Lower East Rift Zone; however, a GPS instrument near the Lower East Rift Zone is no longer moving, suggesting that the rift zone is no longer inflating in this area,” the HVO stated. “Elevated earthquake activity continues, but earthquake locations have not moved farther downrift in the past couple of days.”
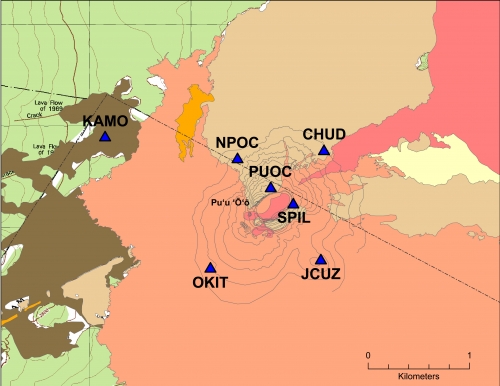
Map of GPS stations installed near the Pu’u O’o vent on Kilauea. (Photo: USGS)
The GPS stations also monitor earthquake activity associated with the volcano. For instance, the May 4 magnitude 6.9 earthquake resulted in seaward motion of 1.5 feet along portions of Kīlauea’s south flank as measured by GPS stations across the volcano.
“Because active volcanoes make for unstable land, highly sensitive seismometers come in handy to track the frequency and strength of micro-earthquakes,” the HVO explained. “Global Positioning System (GPS) devices and another satellite-based technology, InSAR (Interferometric Synthetic Aperture Radar), map ground deformation (inflation and deflation) to within a fraction of an inch while tiltmeters measure slope from ground level. Together, these technologies help track lava’s movement underground and help pinpoint where it might break through the surface.”