Geographical information of urban areas is critical because it forms the basis for planning, intelligent urban modeling and disaster mapping and management. For many decades, ground surveys and aerial photographs were used as the primary tools for collecting this data. Starting in the 1990s, these methods were replaced by such advanced remote-sensing technologies as synthetic aperture radar (SAR) and ground-based interferometric radar (GBIR).
This article explores the use of software-defined radio (SDR) platforms for acquiring high-resolution SAR/GBIR images, including:
- How low-cost commercial-off-the-shelf SDR platforms can be used to realize complex systems for acquiring images and processing measurements.
- How different specifications of SDRs make them suitable for use in SAR applications.
Hazard Monitoring in Urban Areas
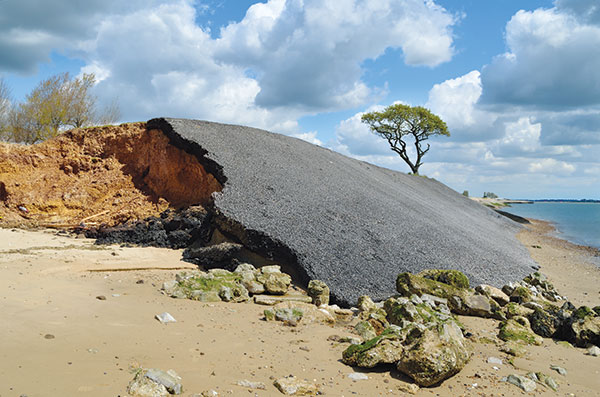
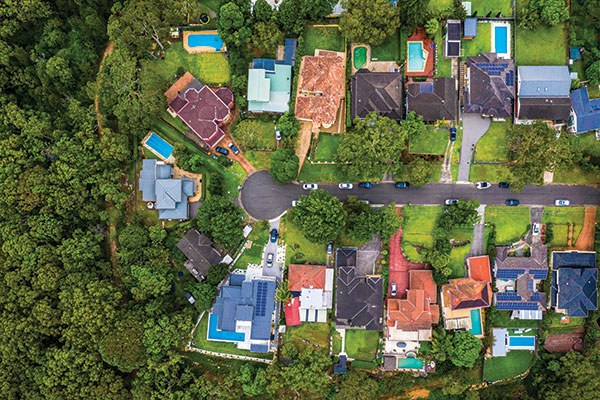
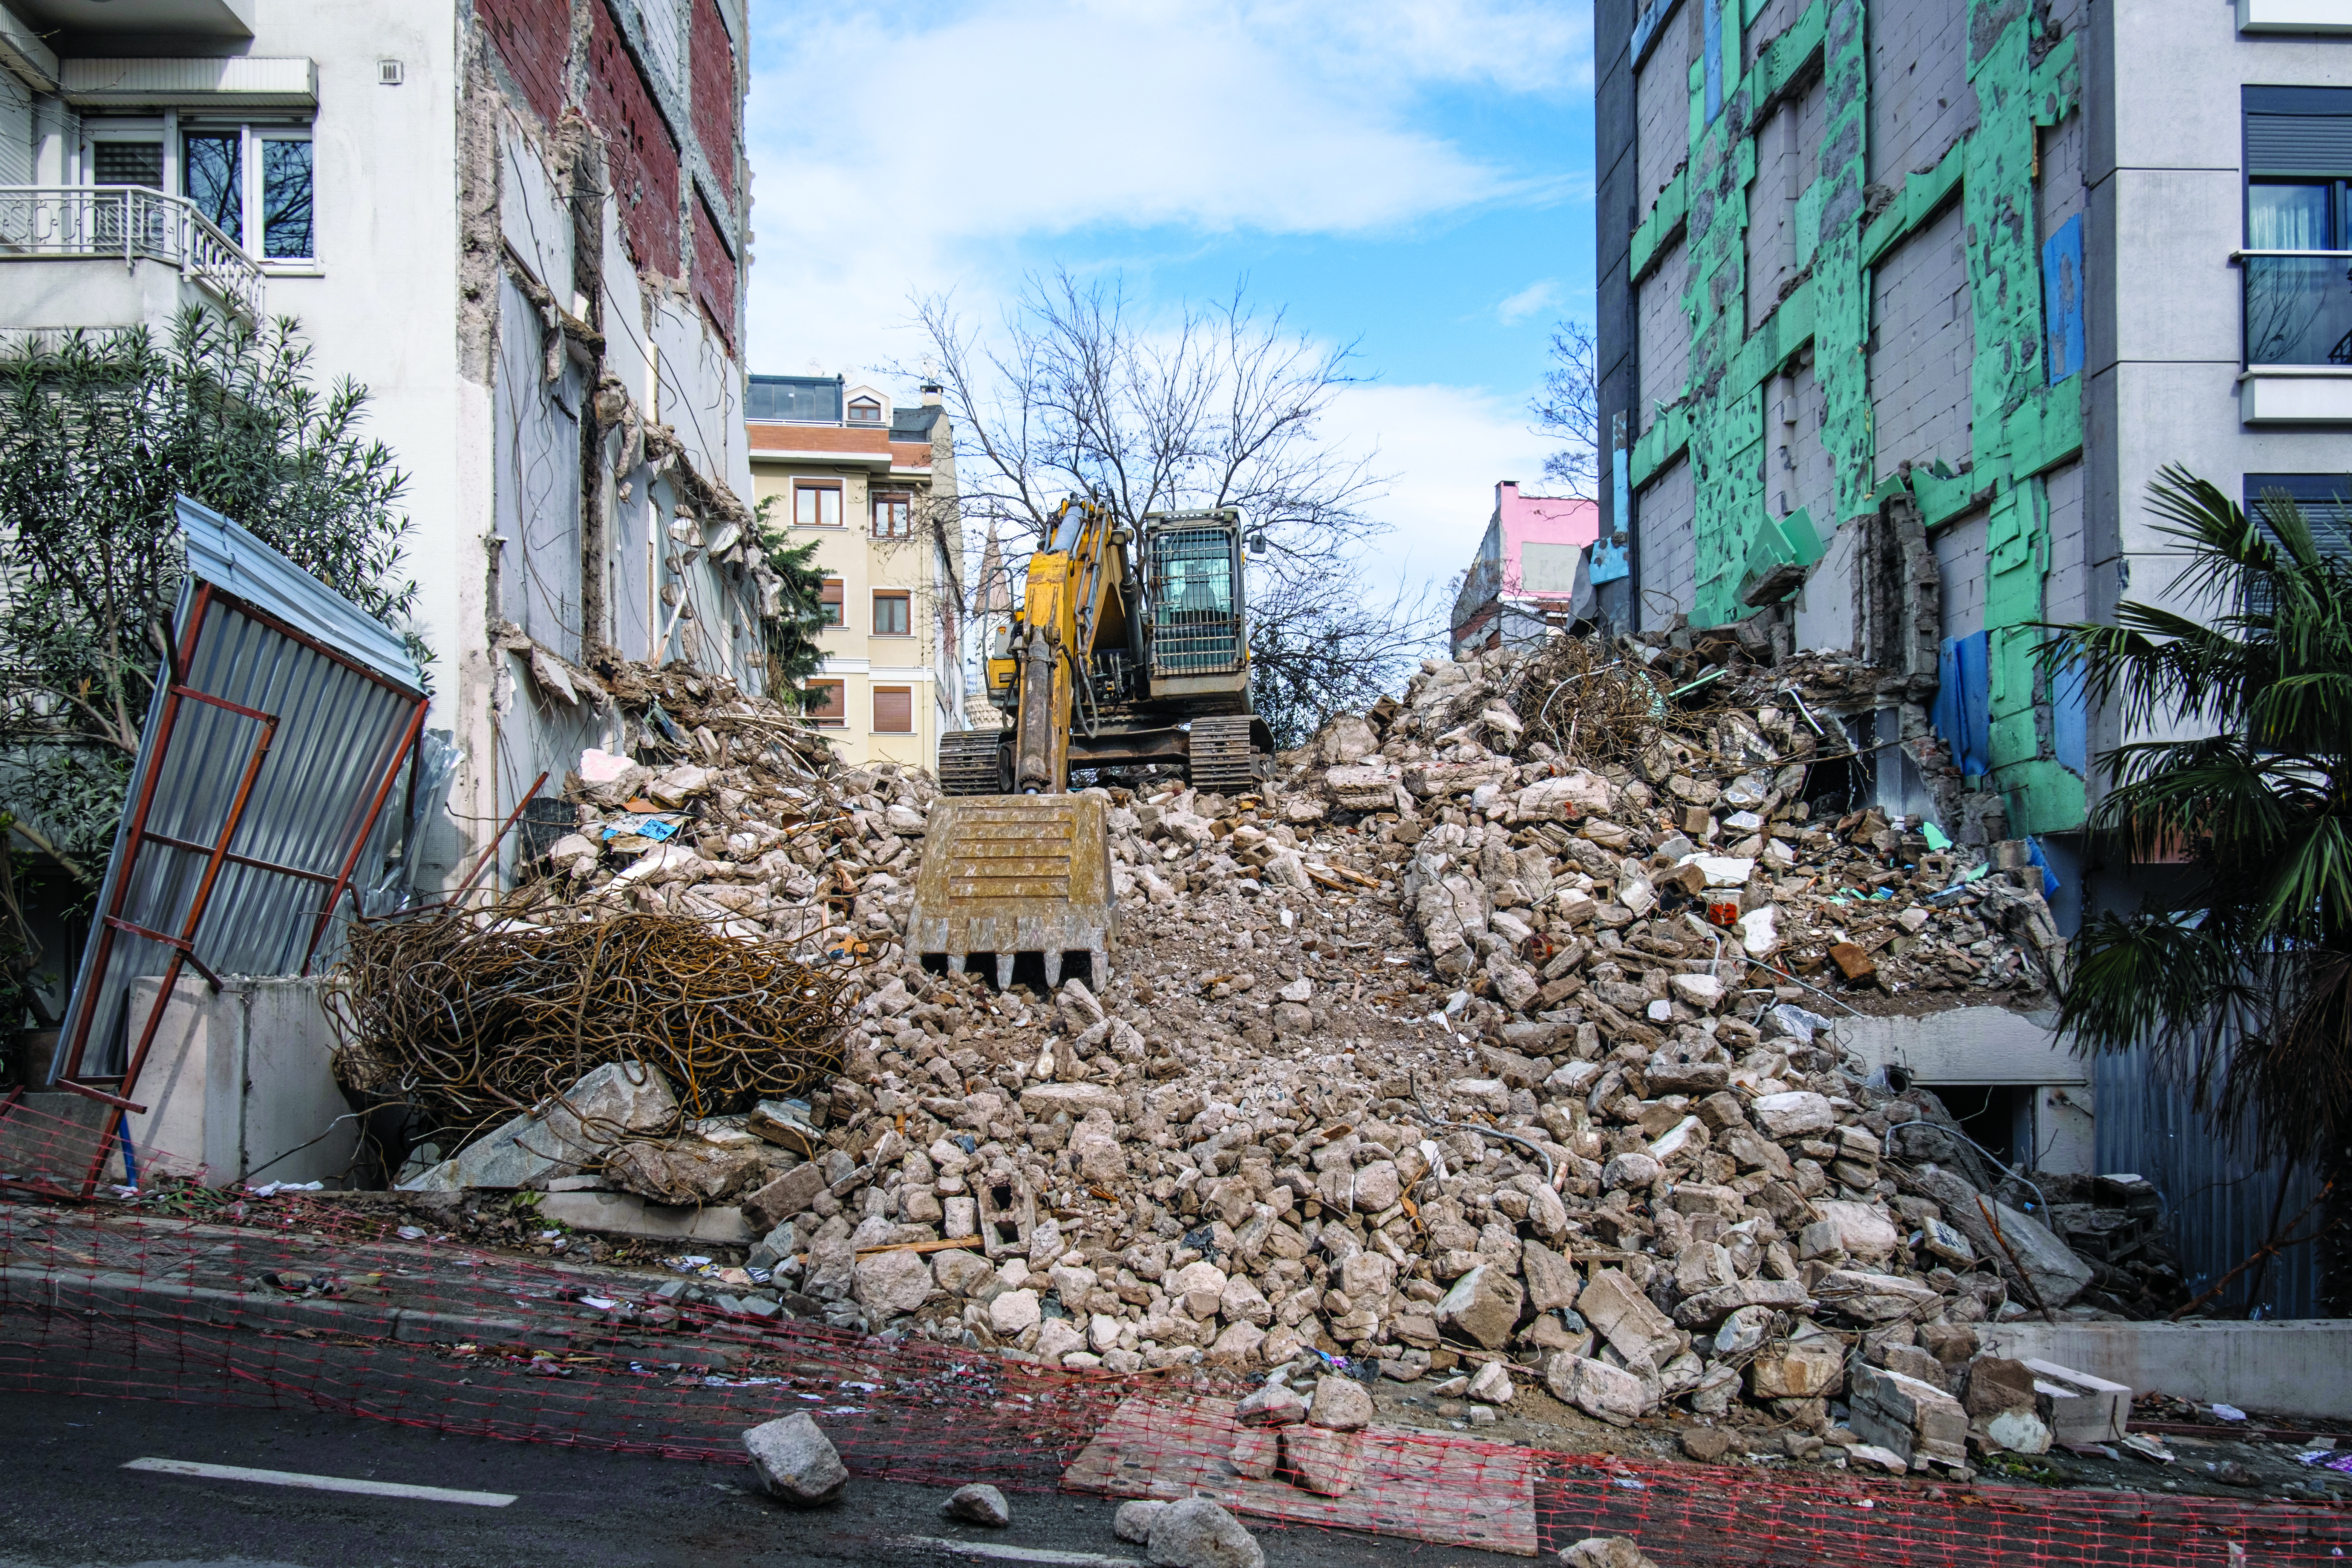
Many urban areas and critical infrastructure are in regions highly prone to natural disasters such as volcano eruptions, earthquakes, avalanches and landslides, or near man-made systems such as dams and quarries. Monitoring of surface changes and structures is integral to the mitigation of risk and ensuring public safety. Modern remote-monitoring systems allow surface displacements to be monitored without the need to access a location. With these systems, several square kilometers of Earth’s surface can be monitored at once and with high accuracy. The sub-millimeter accuracy of modern remote-monitoring technologies enables accurate measurements to be collected with impressive precision, including in rainy and foggy conditions.
Remote-monitoring systems are autonomous and can operate for a long time without human intervention. Their real-time feedback makes them suitable for use as early-warning systems. In addition, these monitoring systems can be integrated into a wide range of sub-systems, such as decision support systems that assist decision makers in assessing emergency plans and selecting the best options.
Using Radar to Measure
Details of the surface observed by a SAR satellite are encoded in the amplitude and phase of a SAR image. The amplitude component contains information about the surface roughness and terrain slope of the target area, while the phase component contains information about the elevation of the satellite.
A typical SAR satellite transmits microwave signals toward a target area at an oblique angle and measures the backscattered signal. The intensity of the reflected signal is mainly determined by the roughness and the structure of the target, and the distance between the satellite and the target. This measurement is usually described in terms of the radar cross-section (RCS) parameter, which is obtained by calculating the ratio of the scattered to the intercepted signals as shown in this equation:
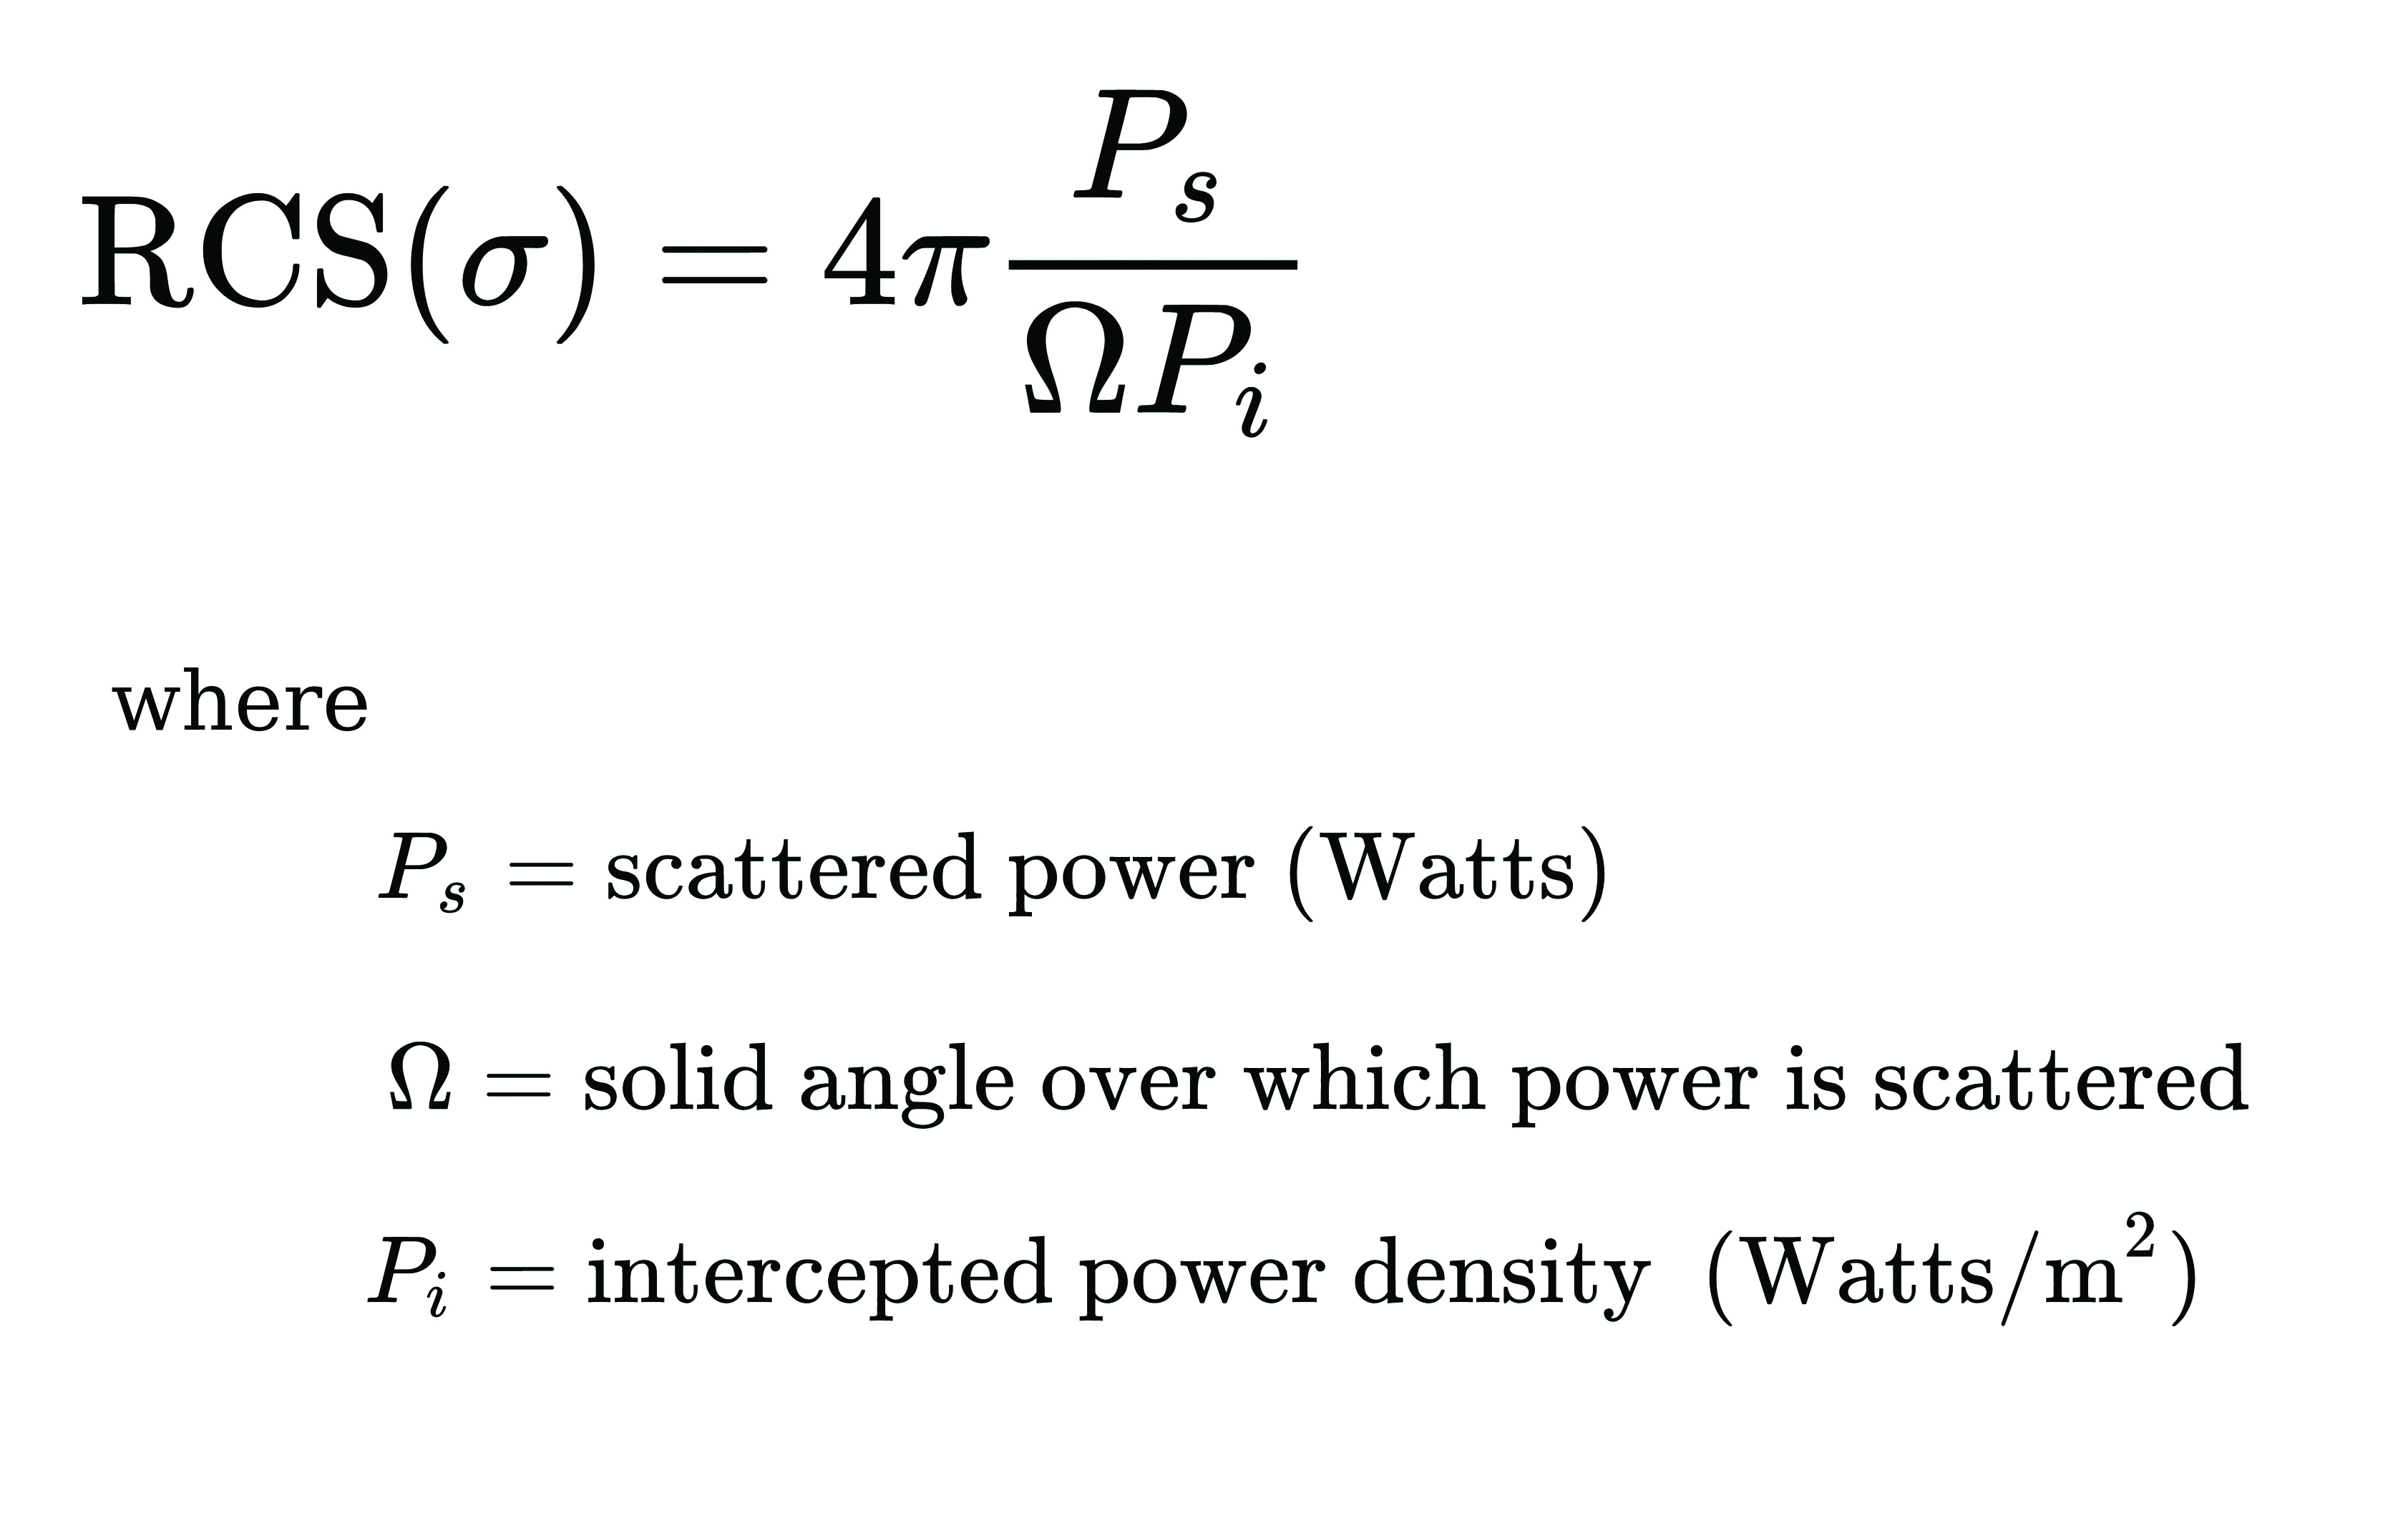
The RCS parameter is mainly dependent on the surface roughness and the dielectric properties of the target object.
The interferometric SAR (InSAR) technique allows surface movements to be identified. These observations also can be used to measure and monitor changes associated with volcanic eruptions, tectonic activity and other geophysical processes. To identify crustal changes using this geodetic technique, at least two SAR images are required.
In differential InSAR, two images of the same location that are recorded at different times are used. If a surface movement has occurred between the first and the second acquisition, a phase shift is observed (Figure 1). The presence of interference fringes on an interferogram is an indicator of a phase shift and these fringes are summed during processing to provide a relative value of the phase change.
Ground-based SAR (GBSAR) employs the synthetic aperture radar technique to capture high-resolution images of the electromagnetic reflectivity of a target. This remote-sensing system is commonly used for monitoring civil infrastructure, buildings, mines, landslides, glaciers and more. While spaceborne SAR is capable of surveying large areas and records data over long periods of time, usually several weeks or months, GBSAR is suitable for monitoring small areas and has short sampling periods, usually a few minutes. In most surveying applications, the two remote-monitoring techniques are used together in a complementary fashion to enhance the overall performance.
The all-weather monitoring capability of satellite-based SAR makes it a popular tool for natural disaster management. Since the launch of the first SAR satellite in 1991, this technology has provided many emergency response teams with important insights on manmade and natural hazards. SAR data can be used to study different aspects of long-term behaviors of slow-moving surfaces, which is critical for planning emergency response to natural hazards such as volcanic eruptions, landslides and avalanches. SAR satellites orbit Earth at altitudes of between 500 km and 800 km and operate in the C-band (5 GHz to 6 GHz), X-band (8 GHz to 12 GHz) and L-band (1 GHz to 2 GHz). The temporal resolution of these satellites is mainly determined by their revisit periods.
Software-Defined Radio Platforms
A typical SDR platform features a radio front end (RFE) and a digital back end, with the RFE performing receive (Rx) and transmit (Tx) functions and offering a wide tuning range, typically 0 GHz to 18 GHz. This range is acceptable for widely used bands in SAR applications, including L-band, C-band and X-band.
The digital back end of a high-performance SDR system features a field programmable gate array (FPGA). This FPGA offers a variety of digital signal processing (DSP) capabilities, including upconverting, downconverting, modulation and demodulation. In addition, an SDR platform offers multiple transmit and receive channels, making it suitable for implementing multi-in multi-out (MIMO) radar systems.
The architecture of SDR platforms allows them to integrate easily with a wide range of complex systems, such as SAR systems. The reconfigurability of SDRs allows upgrades and updates to be implemented without modifying the existing hardware, and can be designed to meet the size, weight and power (SWaP) requirements of an application. These features make SDRs suitable for implementing custom SAR monitoring solutions in small and large ground stations (Figure 2).
Integrating SDRs with SAR
A software-defined radar (SDRadar) is an SDR-based radar system that offers high flexibility and robustness. Compared to conventional radar, SDRadar offers many benefits, including the opportunity to reuse hardware, develop multi-function radar solutions, achieve faster development cycles, and have easier implementation of updates and new algorithms.
Tests with prototype SDR-based GBSAR systems have revealed the strong potential of SDR-based implementations. The MIMO architecture of an SDR platform allows realization of complex multi-frequency GBSAR systems uniquely suited for measuring displacement and other geophysical characteristics of landforms. SDR-based GBSAR systems can operate in different frequency bands and offer unmatched flexibility when it comes to signal generation and digital signal processing.
Many prototypes of airborne/satellite SAR systems based on SDR platforms have been implemented and their performance evaluated. Results have shown that they can offer better performance compared to conventional implementations. The use of multiple independent channels by SDR platforms allows the realization of compact and power-efficient multimode SAR systems, while the architecture of an SDR platform allows complex signal processing techniques such as digital beamforming (DBF), null steering and direction of arrival estimation to be implemented on FPGA.
Benefits of Integrating SDRs with SAR Solutions
Integrating SDRs into SAR systems provides many benefits. The MIMO architecture of SDR systems provides more channels than are required for SAR functions. The extra channels can be used for other applications such as satellite communications during emergencies. The wide frequency-tuning range of an SDR system allows the realization of a multi-function system with applications using different frequency bands. The reconfigurability of SDR platforms allows them to be repurposed for other applications. In addition, this reconfigurability enhances reusability, scalability and power efficiency. The low-latency FPGAs in high-performance SDR systems allow the realization of ultra-high-speed DSP algorithms for use in image processing and DBF.
Conclusion
The reconfigurability and impressive performance features of SDR platforms make them ideal for implementing scalable and flexible SAR monitoring systems for measuring land changes. The wide tuning range and MIMO architecture of SDR devices allows realization of a multi-function and multi-frequency system using a single device. In addition, the reconfigurability of SDR devices allows hardware reuse and low-cost implementation of updates and new algorithms.
Brendon McHugh is the field application engineer and technical writer at Per Vices. He possesses a degree in theoretical and mathematical physics from the University of Toronto.
Simon Ndiritu is an independent technical writer for Per Vices with a background in electrical and electronic engineer with a wealth of experience in designing hardware and firmware. He also has a passion for writing.