Tag: interferometric synthetic aperture radar

  • Seen & Heard: Finding Nemo, weighing bears

    Seen & Heard: Finding Nemo, weighing bears

    “Seen & Heard” is a monthly feature of GPS World magazine, traveling the world to capture interesting and unusual news stories involving the GNSS/PNT industry.


    Photo: Alexey_Seafarer/iStock/Getty Images Plus
    Photo: Alexey_Seafarer/iStock/Getty Images Plus

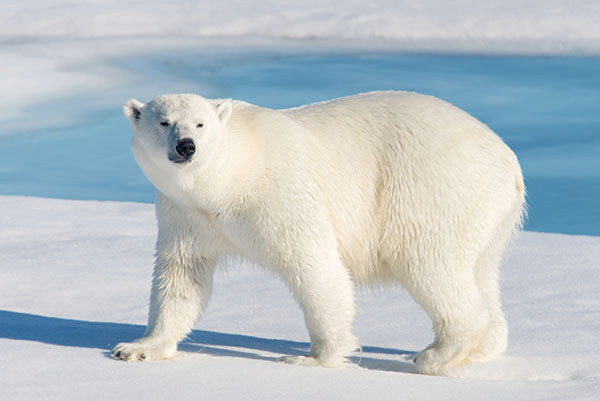
    HOW BIG IS THAT BEAR?

    Monitoring the weight of polar bears — an important health factor — usually means tranquilizing them from the air and lifting them with a tripod attached to a scale. However, technology might provide a non-invasive solution. Various zoos and sanctuaries are testing the accuracy of lidar scanners to measure the weight of polar bears, reports Geo Week News. The scans could be done using drones and mobile mapping equipment and techniques, according to Joel Cusick, a GIS specialist for the National Parks Service.
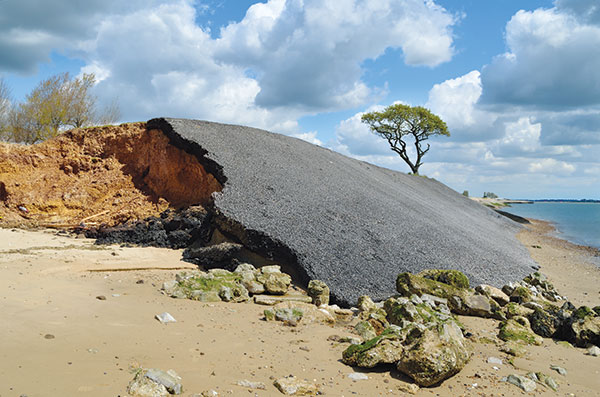

    Photo: PaulFleet/iStock/ Getty Images Plus
    Photo: PaulFleet/iStock/ Getty Images Plus

    SLIP SLIDING AWAY

    Researchers used a combination of GNSS and interferometric synthetic aperture radar (InSAR) data from Sentinel-1 satellites to determine subsidence in
    99 cities around the world between 2015 and 2020. Subsidence rates in Tianjin, Semarang and Jakarta exceed 30 mm per year. Even in mostly stable cities, areas are sinking faster than sea level is rising, with Istanbul, Lagos, Taipei, Mumbai, Auckland and Tampa sinking faster than 2 mm per year in some areas. Besides climate change, causes include groundwater extraction, mining, reclamation of natural wetlands, infrastructure projects and ecological disturbances. The study is published in Geophysical Research Letters.


    Photo: NOAA Fisheries/Raymond BolandPhoto:
    Photo: NOAA Fisheries/Raymond Boland

    FINDING NEMO

    National Oceanic and Atmospheric Administration (NOAA) ocean mapping ship Rainier completed a five-month expedition to the Mariana Islands in September, combining mapping and charting with coral-reef ecosystem surveying. Collection of high-resolution mapping data in near real time improved the effectiveness of the traditional marine science data collection as the combined team mapped 4,000 square nautical miles of seabed and conducted 1,800 SCUBA dives. The data will improve navigation safety through updated NOAA nautical charts and increase understanding of coral reefs through the National Coral Reef Monitoring Program. Besides charts, the seabed mapping data supports marine protected areas, sustainable fisheries, and offshore wind siting — and, in the Marianas, is important for tsunami modeling.
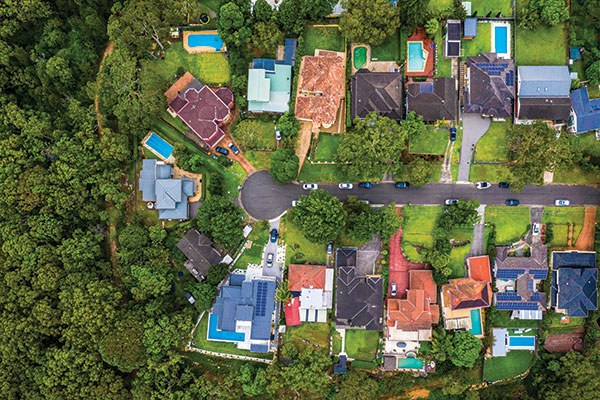

    Photo: mikulas1/iStock/Getty Images Plus
    Photo: mikulas1/iStock/Getty Images Plus

    GRAVITY DOWN UNDER

    An airborne gravity sensor is flying above 80,000 square kilometers of New South Wales (NSW), Australia, collecting data that will improve the accuracy of real-world heights from GNSS positioning to just a few centimeters. Data for the 18-month NSW Gravity Model project will be captured in five stages, starting in Western NSW. The resulting model is expected to enable better resource management, infrastructure planning and natural hazard preparation. It is also a critical building block for developing digital twins, replacing datasets that predate GNSS positioning.

  • GPS Data, Satellite Images Used to Study Icelandic Caldera

    MSimons-BardarbungaVolcano-caldera
    This Landsat 8 image, Caltech acquired on Sept. 6, 2014, is a false-color view of the Holuhraun lava field north of Vatnajökull glacier in Iceland. The Bárðarbunga caldera is visible in the lower left of the image under the ice cap.
    Photo: U.S. Geological Survey / Caltech

    Access to satellite images and GPS data has allowed scientists to document the collapse of the Bárðarbunga caldera, a volcano beneath the Vatnajökull ice cap in Reykjavik, Iceland.

    Mark Simons, a professor of geophysics at the California Institute of Technology (Caltech), traveled to Reykjavik with 15 students and two faculty members on Aug. 16, 2014, to lead a tour of the volcanic, tectonic, and glaciological highlights of Iceland. That day, earthquakes occurred  — the seismicity was related to the Bárðarbunga caldera.

    Simons is one of the leaders of a Caltech and Jet Propulsion Laboratory (JPL) project known as the Advanced Rapid Imaging and Analysis (ARIA) program, which aims to use a growing constellation of international imaging radar satellites that will improve situational awareness and response following natural disasters, according to Caltech. Under the ARIA umbrella, Caltech and JPOL, managed for NASA by Caltech, had formed a collaboration with the Italian Space Agency (ASI) to use its COSMO-SkyMed (CSK) constellation — consisting of four orbiting X-Band radar satellites — following such events.

    CSK used an interferometric synthetic aperture radar (InSAR) technique to gather images of the surface of the glacier above the caldera. By the evening of Aug. 28, Caltech says the first interferogram showed that the ice above the caldera was subsiding at a rate of 19.685 inches a day.

    Simons took the data to researchers at the University of Iceland who were tracking Bárðarbunga’s activity on Aug. 29.

    “At that point, there had been no recognition that the caldera was collapsing. Naturally, they were focused on the dyke and all the earthquakes to the north,” Simons said. “Our goal was just to let them know about the activity at the caldera because we were really worried about the possibility of triggering a subglacial melt event that would generate a catastrophic flood.”

    The flood never occurred, but Caltech says the researchers at the University of Iceland increased their observations of the caldera with radar altimetry flights and installed a continuous GPS station on the ice overlying the center of the caldera.

    The Icelandic researchers published a paper in December 2014 in Nature about the Bárðarbunga event, largely focusing on the dyke and eruption. Simons and his colleagues have developed a model to describe the collapsing caldera and the earthquakes produced by that action. The new findings appear in the Geophysical Journal International.

    Bryan Riel, a graduate student in Simons’s group and lead author on the paper, used the interferogram of the Bárðarbunga area, along with four others collected by CSK in September and October, to show that the earthquakes were not the primary cause of the surface deformation inferred from the satellite radar data.

    “What we know for sure is that the magma chamber was deflating as the magma was feeding the dyke going northward,” Riel said in the article. “We have come up with two different models to explain what was actually generating the earthquakes.”

    “Because we had access to these satellite images as well as GPS data, we have been able to produce two potential interpretations for the collapse of a caldera — a rare event that occurs maybe once every 50 to 100 years,” Simons said. “To be able to see this documented as it’s happening is truly phenomenal.”