Tag: Kilauea

  • Seen & Heard: White giraffe, approaching iceberg

    Seen & Heard: White giraffe, approaching iceberg

    “Seen & Heard” is a monthly feature of GPS World magazine, traveling the world to capture interesting and unusual news stories involving the GNSS/PNT industry.


    Photo: Lukassek/iStock/Getty Images Plus/Getty Images
    Photo: Lukassek/iStock/Getty Images Plus/Getty Images

    The light at the end of the tunnel

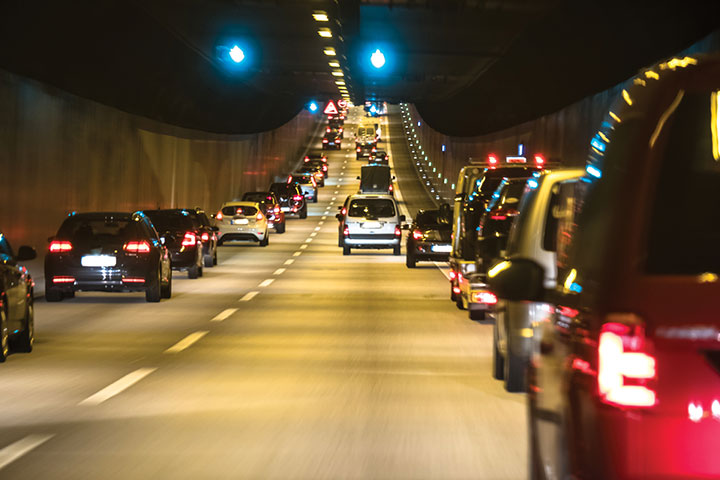
    The city of Prague started testing a system of GNSS repeaters to prevent the loss of satellite signal in the city’s tunnels. The system, which should make life easier for drivers who rely on car navigation technology, is being tested in Prague’s Blanka tunnel. If it proves successful, the municipality wants to install the devices in other strategic locations around the city, especially at intersections as well as tunnel entries and exits.


    Photo: A. Ellis/USGS
    Photo: A. Ellis/USGS

    On the hot spot

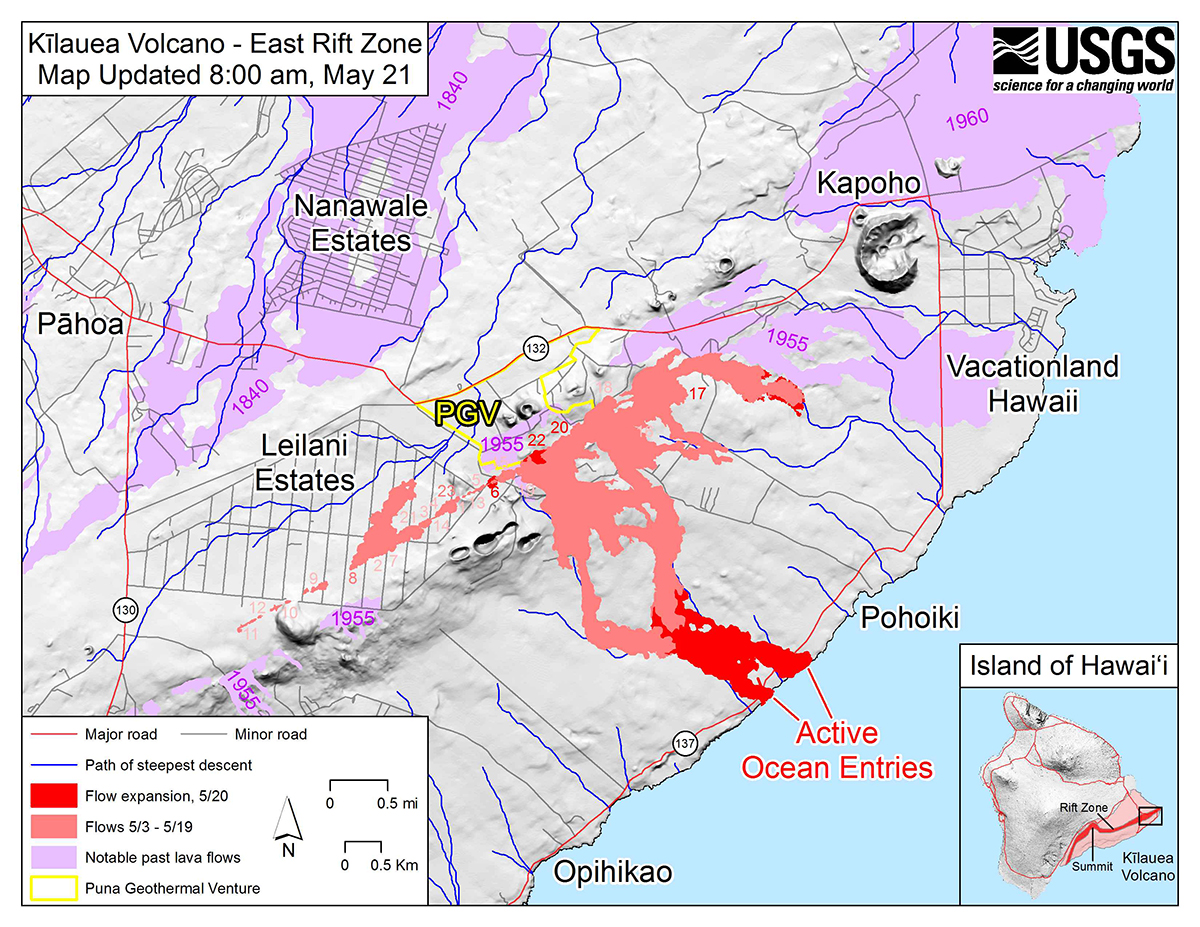
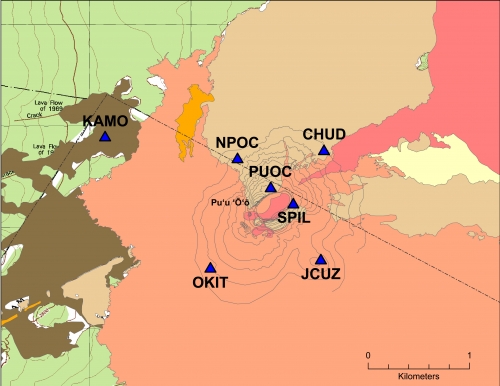
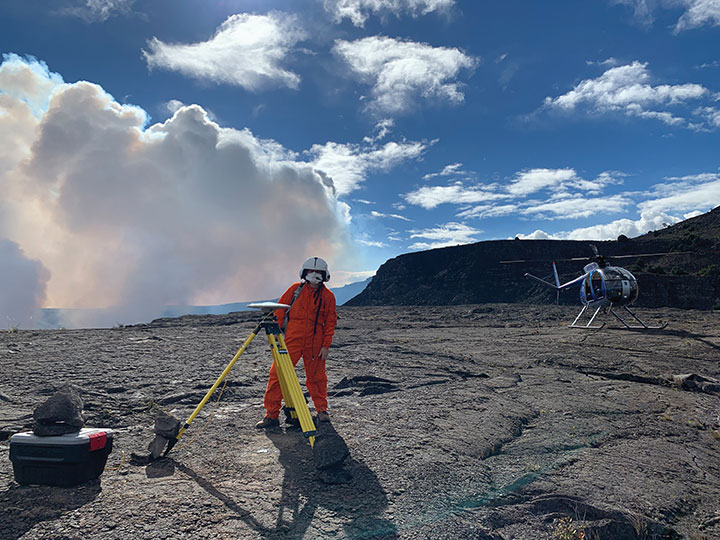
    While permanent monitoring receivers are scattered about Hawaii’s active volcano sites, additional GPS receivers are being deployed during the ongoing eruption of Kilauea. In this photo taken Dec. 21, 2020, a Hawaiian Volcano Observatory geophysicist deploys receivers on the caldera floor in Hawai‘i Volcanoes National Park to measure changes in ground motion. The gas plume from the summit eruption within Halema‘uma‘u crater is visible in the background.


    Photo: Ishaqbini Community Conservancy
    Photo: Ishaqbini Community Conservancy

    Last but not least

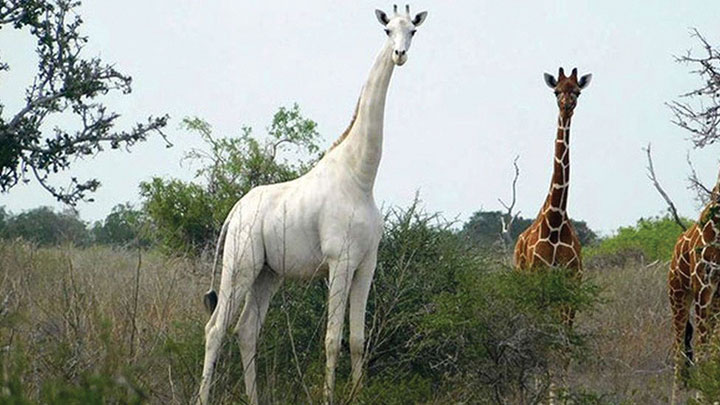
    The last white giraffe known in existence now sports a GPS tracker, reports BBC News. The male giraffe has a rare genetic trait called leucism that causes the unusual color. The giraffe was tranquilized in November and the tracker placed on one of its horns. Tracking will help protect it from poachers as it grazes in Kenya’s savannah near the Somalia border. The white giraffe is alone after a female and her calf were killed by poachers in March 2020, according to Ishaqbini Hirola Community Conservancy.


    Photo: British Antarctic Survey/ESA
    Photo: British Antarctic Survey/ESA

    The biggest loser

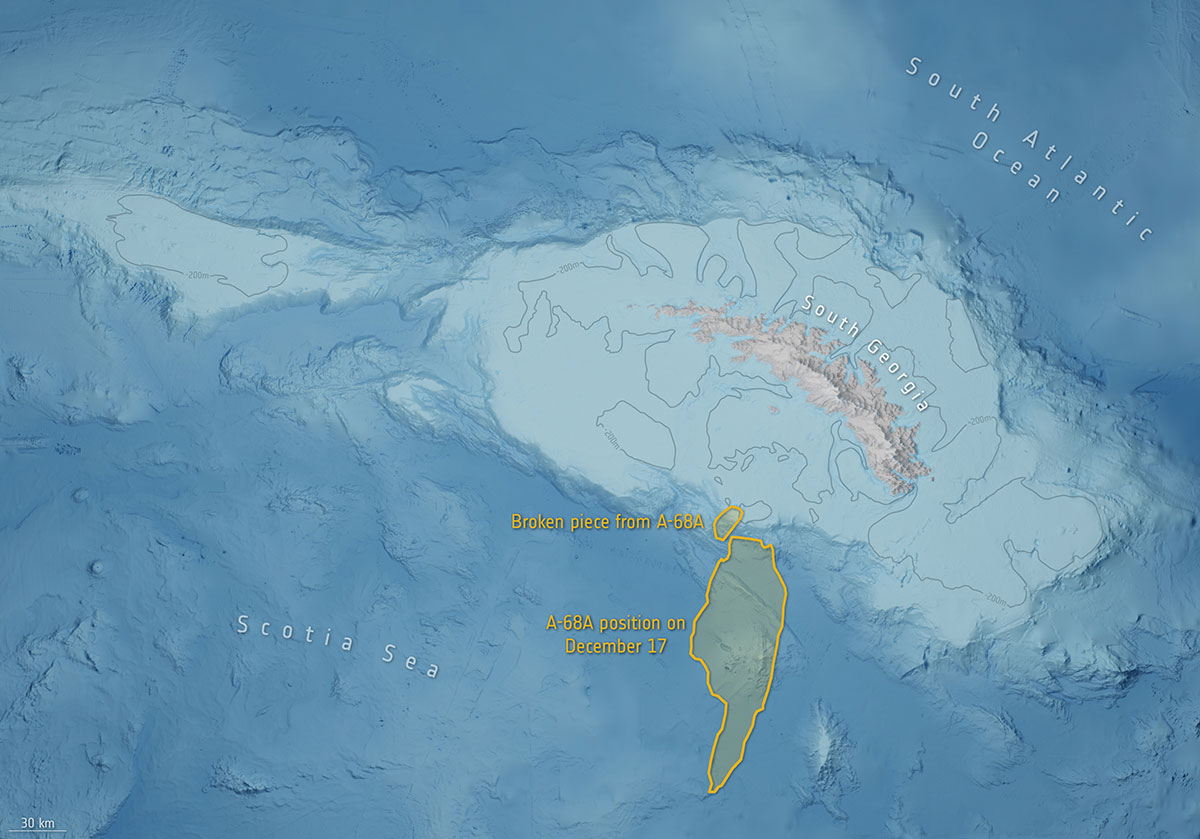
    In July 2017, an iceberg more than twice the size of Luxembourg broke off Antarctica’s Larsen C ice shelf and began traveling the Southern Ocean. Looming in its path is South Georgia Island, home to numerous species of wildlife threatened by the massive iceberg, designated A-68A. Europe’s Copernicus Sentinel satellites observed pieces breaking off of A-68A in December, each large enough to receive its own designation.

  • Quantum Spatial lidar surveys provide volcano eruption insights

    Looking southwest towards Leilani Estates with Fissure 8 erupting in the background. (Image: Ron Chapple/GEO 1)
    Looking southwest towards Leilani Estates with Fissure 8 erupting in the background. (Image: Ron Chapple/GEO 1)

    High-resolution lidar surveys help first responders, scientists and government agencies monitor Kilauea conditions and predict future lava flows.

    Independent geospatial data firm Quantum Spatial Inc. (QSI) has conducted high-resolution lidar surveys of areas surrounding the Kilauea volcano eruption in Hawaii.

    The emergency response effort was part of the U.S. Geological Survey’s (USGS) Rapid Response Imagery Products (RRIP) in support of the Kilauea’s 2018 East Rift Zone – Remote Sensing Acquisition Requirement.

    The USGS Hawaiian Volcano Observatory (HVO), along with emergency responders, government agencies and academics, will use the data to better understand the conditions and characteristics of the Kilauea volcano, which has been continually erupting since May 3.

    Data also will assist planners in modeling potential lava flows, which may better predict and respond to future flows and enhance safety of residents.

    The USGS National Geospatial Program (NGP) selected QSI to perform the first of two planned surveys over the active volcanic area. The QSI team, which included GEO1 and Windward Aviation, deployed within days to acquire high-resolution lidar at point densities averaging from 40 to 80 ppsm, with up to 150 ppsm in select areas and 100-mp digital imagery using a Riegl dual VUX-1 LR sensor pod equipped with ABGPS/IMU mounted on a Hughes 500D helicopter.

    Five distinct locations, covering an area of 57 square miles, were targeted:

    • Kīlauea Summit Caldera
    • Pu’u O’o Crater and flow
    • Chain of Craters Road / Kaoe
    • Puna Geothermal Venture (PGV)
    • Western Leilani Estates lava field.

    The project required 11 missions over the course of six days, operating at times as low as 500 feet above the ground and above active flows and nearby erupting calderas. With a need for a quick turn around, QSI deployed an analyst with the flight crew to post process each mission within hours of collection.

    The data was uploaded to the Geospatial Repository and Data Management System (GRiD) interface, developed by the U.S. Army Corps of Engineers (USACE), where additional data products have been developed and provided to the response team that includes FEMA, Hawaii’s Emergency Operations Center (EOC) and the Hawaii County Civil Defense.

    After data collection, QSI measured topographic shifts during the processing by comparing new data with a 2011 lidar collection from the same area. Survey specialists and USGS experts confirmed within hours of processing QSI’s lidar data that areas within the site had shifted up to 1.5 meters east, 2 meters to the north and 1 meter in elevation.

    USGS scientists will continue to examine the new topographic data to better understand the nature of these shifts, and integrate it into lava flow models for more accurate predictive modeling.

    “Airborne lidar and imagery remote sensing surveys are invaluable tools for understanding the effects of active volcanic eruptions, which change the topography as fissures emerge and lava flows extend to the ocean,” said Michael Shillenn, vice president at QSI. “We were honored to work with the USGS and others on this critical project. We believe that data and analysis provided by the QSI team will provide insights into future scenarios, enabling emergency responders to protect the surrounding community.”

  • UAVs, new sensors and mapping help with volcano eruption response

    A team of five volunteers armed with drones, advanced sensor systems and GIS technologies joined the response effort at Kilauea Volcano Lower East Rift Zone to assist in tracking and predicting the ongoing volcanic eruption.

    Using small unmanned aerial systems (sUAS) together with air-quality sensors, advanced imaging tools and Esri’s spatial analytics and mapping, the team from the Center for Robot-Assisted Search and Rescue (CRASAR) provided real-time aerial views of the eruption.

    The CRASAR team identified a new fissure not visible from the ground, projected the lava flow rate during the night when manned helicopters were not allowed to fly, and provided ongoing data collection from new thermal sensors technology.

    The CRASAR response marks the first known use of sUAS for emergency response to a volcanic eruption and first known use of sUAS for sampling air quality. The CRASAR team provided Hilo Fire Department and the Civil Defense with live streaming of video from the sUAS over the new FirstNet cellular network.

    “This latest CRASAR mission is another example of dedicated volunteers working together with private sector partners to deploy technology to save lives and property when disaster strikes,” said CRASAR Director and disaster robotics expert Robin Murphy. “With support from technology partners like Esri, Hangar Technologies, RemoteGeo and RMUS, we are able to both respond to active disasters but also demonstrate to the first responder community best practices and benefits of engaging robots and other technologies in disaster response.”

    CRASAR supported tactical response operations at the Leilani, Hawaii, eruption event May 14-19, supplementing the University of Hawaii Hilo’s (UHH) sUAS capabilities and allowing UHH sUAS operators to focus on geographical and volcanology.

    During the six-day Leilani deployment, the CRASAR team flew 44 sUAS flights, including 16 at night, using DJI 200, 210, Inspire, and Mavic Pro drones.

    Esri’s Drone2Map for ArcGIS together with Hangar’s Enterprise Platform for 360-degree imaging enabled rapid 360-imaging for situational awareness.

    DJI’s new XT2 thermal sensor provided unprecedented drone-based air-quality monitoring.

    Video and data were shared with local first responders using FirstNet, the first high-speed, nationwide wireless broadband network dedicated to public safety.

    The CRASAR response team included sUAS pilots Justin Adams of Constellation Consulting Group, David Merrick and Laura Hart of Florida State University Center for Disaster Risk Policy, Jon McBride of Rocky Mountain Unmanned Systems, and Robin Murphy of Texas A&M University. Funding was provided in part through research grants from an insurance partner and the National Science Foundation.

    “This eruption is especially impactful because of its location,” said Esri’s Public Safety Lead, Ryan Lanclos. “That makes the CRASAR’s use of drones and mapping technologies, and the near real-time situational awareness it provides of people, homes, businesses and infrastructure during this disaster, a resource first responders will be able to turn to time and again.”

    CRASAR’s deployment to Hawaii marked a number of firsts for technology applied to disaster response. To interact with the same GIS mapping and imaging technologies responders used on the scene at Kilauea Volcano Lower East Rift Zone, visit this page.

  • GPS actively monitoring Kilauea’s eruptions, lava flows

    GPS actively monitoring Kilauea’s eruptions, lava flows

    GPS measurements are playing a key role in monitoring the erupting Kilauea volcano in Hawaii.

    The floor of the Pu’u ‘O’o Crater started to collapse on April 30, following weeks of uplift and increasing lava levels within the cone and seismicity in the East Rift Zone. The eruptions began on May 3, when a magnitude 5 earthquake struck, causing further collapse of the crater.

    The Hawaiian Volcano Observatory (HVO) has monitored volcanic activity on the islands since 1912. The HVO is operated by the U.S. Geological Survey (USGS) and is issuing continuous updates on Kilauea.

    The HVO is closely monitoring the biggest fissures in what is known as the lower East Rift Zone. Geologists are onsite to track ongoing and new fissure activity and the advance of lava flows.

    Kilauea eruption map as of 8 a.m. HST, May 21. Shaded purple areas indicate lava flows erupted in 1840, 1955, 1960 and 2014–2015. (Photo: USGS)

    GPS stations monitor land movement of Kilauea. The Big Island’s most active volcano has erupted nearly continuously for more than three decades.

    “Magma supplied to the Lower East Rift Zone was indicated by the northwest displacement of a GPS monitoring station,” the HVO said in its May 26 status update, but the station ceased movement a few hours later, telling a new story.

    “Magma continues to be supplied to the Lower East Rift Zone; however, a GPS instrument near the Lower East Rift Zone is no longer moving, suggesting that the rift zone is no longer inflating in this area,” the HVO stated. “Elevated earthquake activity continues, but earthquake locations have not moved farther downrift in the past couple of days.”

    Map of GPS stations installed near the Pu’u O’o vent on Kilauea. (Photo: USGS)

    The GPS stations also monitor earthquake activity associated with the volcano. For instance, the May 4 magnitude 6.9 earthquake resulted in seaward motion of 1.5 feet along portions of Kīlauea’s south flank as measured by GPS stations across the volcano.

    “Because active volcanoes make for unstable land, highly sensitive seismometers come in handy to track the frequency and strength of micro-earthquakes,” the HVO explained. “Global Positioning System (GPS) devices and another satellite-based technology, InSAR (Interferometric Synthetic Aperture Radar), map ground deformation (inflation and deflation) to within a fraction of an inch while tiltmeters measure slope from ground level. Together, these technologies help track lava’s movement underground and help pinpoint where it might break through the surface.”