EOS has partnered with four high-resolution imagery providers — Airbus Defense and Space, SI Imaging Services, SpaceWill and 21AT — so users can purchase the latest images directly from LandViewer, the official high-resolution data reseller, or view the images of an area of interest in high resolution on the map.
LandViewer collects the latest up-to-date satellite imagery from commercial satellite providers and incorporates it into an easy-to-use platform. The collection is constantly being improved with new sensors.
LandViewer offers two data sources of commercial imagery:
High-resolution imagery (for analytics), to find and purchase high-resolution images for further in-depth analysis. In this case, the price is based on the size of the area of intersection between the selected image and your area of interest (AOI).
Image from Landviewer for analytics. (Image: EOS)
High-resolution imagery (view only) to view high-resolution images for your area of interest (AOI). In this case, the price is based on the number of tiles within your AOI. The view only option is designed as a stand-alone data source for the everyday business user.
Image from Landviewer (view only). (Image: EOS)
The EOS platform uses commercial imagery from LandViewer with a resolution between 0.3 meter and 1.5 meters, enabling a close look at assets of interest, anywhere in the world.
A major use of remote sensing data is to compare images of an area taken at different times and identify the changes it underwent. With a wealth of long-term satellite imagery in open use, detecting such changes manually would be time-consuming and most likely inaccurate.
To address this, EOS Data Analytics has introduced an automated Change Detection tool to its flagship product LandViewer, a cloud tool for satellite imagery search and analysis in today’s market.
Unlike the methods involving neural networks that identify changes in the previously extracted features, the change detection algorithm implemented by EOS is using a pixel-based strategy, meaning that changes between two raster multi-band images are mathematically calculated by subtracting the pixel values for one date from the pixel values of the same coordinates for another date.
This new signature feature is designed to automate a change detection task and deliver accurate results in fewer steps and in a fraction of the time needed for change detection in most image-processing software.
Change detection interface: Images of Beirut city coastline selected for tracing the developments of the past years. (Image: LandViewer)Change detection interface: Images of Beirut city coastline selected for tracing the developments of the past years. (Image: LandViewer)
Applications from farming to environmental monitoring
One of the main goals set by EOS team was to make the complex process of change detection in remote sensing data equally accessible and easy for non-expert users coming from non-GIS industries.
With LandViewer’s change detection tool, farmers can quickly identify the areas on their fields that were damaged by hail, storm or flooding. In forest management, satellite image detection of changes will come in handy for estimation of the burned areas following the wildfire and spotting the illegal logging or encroachment on forest lands.
Observing the rate and extent of climate changes occurring to the planet (such as polar ice melt, air and water pollution, natural habitat loss due to urban expansion) is an ongoing task of environmental scientists, who may now have it done online in a matter of minutes. By studying the differences between the past and present using the change detection tool and years of satellite data in LandViewer, all these industries can also forecast future changes.
Top change detection use cases: Flood damage and deforestation
A picture is worth a thousand words, and the capabilities of satellite image change detection in LandViewer can be best demonstrated on real-life examples.
Forests that still cover around a third of the world’s area are disappearing at an alarming rate, mostly due to human activities such as farming, mining, grazing of livestock, logging, and also the natural factors like wildfires. Instead of massive ground surveying of thousands of forest acres, a forestry technician can regularly monitor the forest safety with a pair of satellite images and the automated change detection based on NDVI (Normalized Difference Vegetation Index).
How does it work? NDVI is a known means of determining vegetation health. By comparing the satellite image of the intact forest with the recent one acquired after the trees were cut down, LandViewer will detect the changes and generate a difference image highlighting the deforestation spots, which can further be downloaded by users in JPG, PNG or TIFF format. The surviving forest cover will have positive values, while the cleared areas will have negative ones and be shown in red hues indicating there’s no vegetation present.
A difference image showing the extent of deforestation in Madagascar between 2016 and 2018; generated from two Sentinel-2 satellite images. (Image: LandViewer)
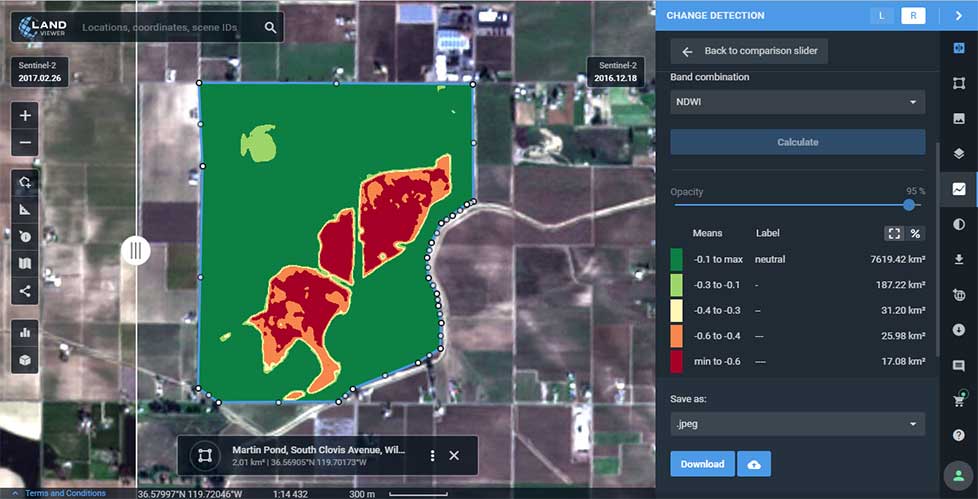
Another widespread use case for change detection would be agricultural flood damage assessment, which is of most interest to crop growers and insurance companies. Whenever flooding has taken a heavy toll on your harvest, the damage can be quickly mapped and measured with the help of NDWI-based change detection algorithms.
Results of Sentinel-2 scene change detection: The red and orange areas represent the flooded part of the field,; the surrounding fields are green, meaning they avoided the damage. California flooding, February 2017. (Image: LandViewer)
How to run change detection in LandViewer
There are two ways you can launch the tool and start finding differences on multi-temporal satellite images: by clicking the right menu icon “Analysis tools” or from the Comparison slider ‒ whichever is more convenient. Currently, change detection is performed on optical (passive) satellite data only; addition of the algorithms for active remote sensing data is scheduled for future updates.
LandViewer, a cloud service developed by EOS Data Analytics, provides access to satellite data and fast-paced analytics. In recent months, it has undergone numerous updates, which have expanded the existing catalogue of satellite imagery, introduced more tools for analysis and added other new features.
By the end of 2018, free space and airborne data available for browsing, analysis and download via LandViewer included imagery from the European Space Agency’s (ESA’s) Sentinel-2 and Sentinel-1, NASA-USGS’s Landsat 8 and previous missions, MODIS, CBERS-4 and NAIP.
This broad selection of Earth observation data has grown even larger with the addition of high-resolution commercial imagery from Airbus, SpaceWill and SI Imaging Services.
LandViewer has evolved into a single platform. On top of open-source data, users can freely explore the potential of commercial data with global coverage, short revisit periods, and spatial resolution up to 40 centimeters.
The current catalogue includes imagery from Pléiades 1a/1b, SPOT 5, SPOT 6 and SPOT 7, along with KOMPSAT-2, 3, 3A and SuperView. The high-resolution imagery browser offers free preview, automatic price calculation by selected area, and fast image delivery within three business days via cloud EOS Storage.
Preview of KOMPSAT-3A image collected over Shanghai Hongqiao International Airport on Oct. 29, 2018. (Photo: EOS)
Long-term observations. An abundance of available data, such as weekly updated Sentinel-2 imagery and historical Landsat data, has made it much easier to monitor changes over long time spans. Rather than taking a long time to select and process years of satellite data to get a multitemporal perspective, the LandViewer’s new Time Series Analysis will crunch the remote sensing data and deliver the results in an easily interpretable graph.
Sentinel-2 time series graph generated for agricultural fields in Kansas state. (Screenshot: EOS)
Users can select an area of interest (AOI), and a satellite dataset and a time period between 1 month and 10 years. The algorithm can then pick all imagery with minimum cloudiness and calculate NDVI, NDWI or NDSI in just a few moments. By default, the generated Time Series graph contains lines (representing the min, max, mean and std values) that can be hidden or displayed for convenience; whenever an unusual spike or drop in values is noticed, a satellite scene that represents that part of the curve can be visualized to establish the cause. The results can be downloaded either as an image (.png), or a .csv file for working in Excel.
Enhanced vegetation analysis. Users searching for an in-depth look at vegetation cover can use LandViewer’s new spectral indexes: SAVI, EVI, ARVI, GCI, SIPI and NBR. These indexes complement generalized NDVI analysis by making corrections for atmospheric and topographic effects or soil brightness influences, depending on vegetation density, climate and elevation in the area of interest.
The NBR index is designed to highlight burned areas against healthy vegetation; the difference between pre-fire NBR and post-fire NBR values can be applied to estimate the severity of burn.
The use of several indexes simultaneously enables better insight into plant health and helps to identify stressed or infected vegetation at an early stage.
Sentinel-2-derived SAVI analysis of an arid agricultural region in Saudi Arabia. (Screenshot: EOS)
User-friendly legend and area calculation. Another new LandViewer feature, the index legend, is designed to solve the problem of interpreting the index results, a common issue for new users. Now when a spectral index is applied over the selected territory, the user can view a detailed legend, where each color-marked class contains a short description.
For example, calculation of NDVI will identify and highlight areas with “dense”, “moderate”, “sparse vegetation”, “open soil” or “no vegetation”.
Screenshot: EOS
Another new time-saving functionality is that the area of each class within the spectral index legend is calculated automatically, in both square meters and by percentage.
Also, the expanded Area of Interest (AOI) tool enables bulk uploading of AOIs and speeds up work by allowing simultaneous visualization and fast switching of all AOIs on a map for imagery searches or new scene subscription.
Advanced zone analytics. By introducing the clustering function, EOS’ remote sensing experts and software developers have taken LandViewer’s spatio-temporal analytics to the next level. With this function, users can run unsupervised satellite data-based classification of an area up to 200 square kilometers into as many as 19 clusters (or zones). This process involves setting custom parameters (size/number of zones) and waiting a few moments for LandViewer to build a raster image of the area with color-marked zones, and a vector layer outlining the boundaries. Both outputs can be downloaded.
This scalable analysis can provide various insights across agriculture, forestry, coastal monitoring and other industries. For example, a farmer can make use of convenient color mapping of zones within the field based on NDVI values for precise in-field navigation and crop management.
Engaging animations. With the informative spectral data contained in satellite image pixels, LandViewer has introduced a time-lapse animation feature allowing journalists and active social media users to create engaging animated stories and share them on the internet. Each GIF can contain up to 300 scenes, with indexes or band combinations applied. From calving of glaciers to construction of new stadiums, satellite imagery is full of information that’s worth watching and sharing with the world.