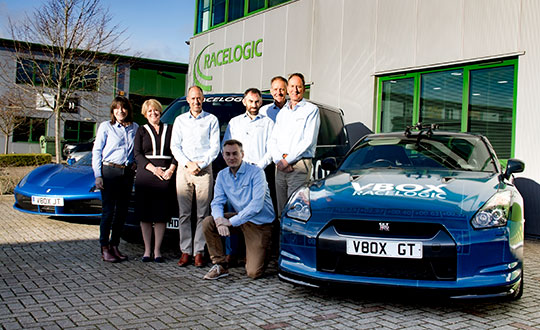
Racelogic, the company behind LabSat, has been named as one of the “10 Ones to Watch” in the 22nd annual The Sunday Times BDO Profit Track 100, which ranks Britain’s top private companies.
The Profit Track 10 Ones to Watch list represents a cross-section of companies that have achieved or predict good profit growth. In addition to profit performance, inclusion is also based on factors such as resilience in the face of the pandemic and strength of the business model.
Graham Mackie, CEO of Racelogic, was delighted to see the hard work of his team recognized by industry experts. “In a challenging year, we are proud of our performance and the way in which every member of the team at RACELOGIC has adapted to new ways of working and serving our customers,” he said.
The Buckingham-based business sells to more than 100 countries and generated 88% of its sales overseas last year. “We have great products that service a global market that provided some resilience to the impact of the pandemic,” Mackie said. “We are continuing to develop cutting-edge technology, which is enabling us to diversify into new sectors including the film and gaming industries.”
The sales growth and addition of new products has resulted in Racelogic expanding its workforce at a time when many are having to reduce staff numbers, Mackie said. “We are currently recruiting for a range of engineering and administrative positions, all of which can be found on our website. It is an exciting time to join Racelogic, and perhaps even more so now that we are officially ‘one to watch’.”
The 10 Profit Track Ones to Watch finalists will be judged by Stuart Lisle, senior tax partner at BDO, and Hamish Stevenson, founder of Fast Track. The winner will be announced at the Profit Track 100 virtual awards event in June.
London building-design agency DCSK is using 3D building models from Bluesky to inform the design of high-profile urban residential developments.
Derived from the most up-to-date and accurate aerial photography, the Bluesky 3D models allow DCSK to place a design within its real-world context, consider sensitive view and vantage points, and communicate ideas to clients, planning authorities and the public.
DCSK has used a number of models from Bluesky, including a detailed representation of central Birmingham for the design of a 24-storey student accommodation on Lancaster Street.
“We have always had to consider how a design sits within the existing cityscape and how it will interact with the buildings and infrastructure that surround it,” said James Khamsi, Director of DCSK. “Before geographically accurate computer representations, such as the Bluesky 3D models, were available and affordable, we relied on a combination of site photographs and traditional 2D maps. This was a crude workflow that raised potential concerns about the currency and accuracy of information that was informing both the design and resulting planning permissions.”
DCSK is using 3D models from Bluesky for projects such as Curzon Circle Student Accommodation and others.Photogrammetrically derived from stereoscopic aerial photography, the Bluesky models are fully rendered and are provided as either wireframe or block models in a format suitable for use in both CAD and GIS software.
All Bluesky 3D models are supplied with a digital terrain model (DTM) depicting the topography of the underlying surface.
DCSK imports the Bluesky data into its 3D modelling software Rhino, where it is used to create a background layer for the design. The development site is isolated, and this data removed from the background layer, allowing for the detailed design to be dropped in. The proposed development can then be viewed and analyzed in its real-world context with detailed assessments of access ways and viewpoints, for example.
“The Bluesky models allow us to inhabit the site and experience the design as if we were there,” said Khamsi. “We can explore potential sensitivities, and, as the models are agile, we can massage the design exploring different options without leaving the office. The Bluesky models are also intuitive and therefore easy to interpret allowing us to communicate complex design ideas.”
Highly accurate, UK city-wide 3D models are now available to view and download from Bluesky’s online Mapshop.
The geographically accurate, photo-realistic MetroVista mesh models are available in a variety of formats ready for use in 3D GIS, CAD and other modelling software as well as visualisation, gaming and Virtual Reality workflows.
Captured using Leica’s large-format imagery and lidar hybrid airborne sensor and generated in Skyline’s PhotoMesh software, the Bluesky MetroVista datasets of major UK cities are available online offering a compelling alternative to traditional photogrammetrically produced models.
Now in America. In December, Bluesky launched its 3D data capture programme in the United States. The MetroVista product suite allows high-resolution imagery, both vertical and oblique, to be captured simultaneously with high-accuracy, wide-scale 3D data using an advanced Leica camera, the CityMapper. Specifically designed for 3D city modeling and urban mapping, the system includes a traditional vertical camera as well as survey-grade oblique cameras.
The CityMapper also includes high-performance lidar technology to accurately collect elevation data — even in shadows that are common in urban environments and can make photo-based collection difficult.
“Since launching in the UK the MetroVista product range has received enormous offline interest from sectors such as infrastructure and building development, risk assessment, telecommunications and environmental mapping,” said Rachel Tidmarsh, managing director of Bluesky. “By making the data easy to access and consume via our online Mapshop, we hope to increase the take up from traditional users of 3D models and encourage applications such as smart city management, autonomous vehicle testing, virtual reality experiences and gaming.”
Two seasons in the UK
Bluesky has been capturing MetroVista data in the UK for two flying seasons. Visitors to Bluesky’s Mapshop will initially be able to select an area and download MetroVista mesh models of London, Birmingham and Cambridge with other UK and U.S. cities coming online in the future.
Data can be supplied in a variety of proprietary and open source formats including OBJ, FBX, I3s and 3DML for use in Skyline’s TerraExplorer product suite.
The Bluesky Mapshop also offers complete nationwide coverage of aerial photography from multiple epochs, 3D models, lidar data, thermal mapping and Bluesky’s National Tree Map. Blueskymapshop.com is easy to use and purchasing of data is simple, straightforward and secure. Account options are also available and data can be purchased with a range of easy to understand licence options, including the option of a Sub Contractor Licence.
A new president and council were elected at the annual meeting of the Royal Institute of Navigation (RIN), held at the Royal Geographical Society in London on July 15.
The meeting, which included presentations on the Mary Rose Trust and quantum technology, concluded with the declaration of ballot results for the new president, officers and council members.
The RIN’s Patron, HRH The Duke of Edinburgh Prince Philip, divested outgoing President R. A. McKinlay and placed the Presidential Medal on the new incumbent, Captain James B. Taylor. James Taylor paid tribute to McKinlay and his outgoing officers and council members for their impressive leadership while in office.
GPS World magazine founding editor Glen Gibbons received the Harold Spencer Jones Gold Medal from the duke in recognition of his “outstanding contribution to navigation as the founder and editor of various world-leading GNSS publications for more than 25 years, thus fulfilling a vital role in raising awareness and understanding of Global Navigation Satellite Systems.”
Two President’s Invitation Addresses were given. Rear Admiral John Lippiett, chief executive of the Mary Rose Trust, gave a talk entitled “Insights into Tudor navigation from the Mary Rose,” and Prof. David Delpy, chair of the Strategic Advisory Board of the Engineering and Physical Sciences Research Council Quantum Technologies Programme, and chair of the MOD’s Scientific Advisory Council, gave a talk entitled “The UK National Quantum Technologies Programme and its relevance to Navigation.”
Council members for 2015-16 are:
President: Capt. J. B. Taylor, Order of the British Empire (OBE, Officer), Royal Navy (RN)
Vice Presidents: Prof. T. Moore and Wg. Cdr. J. W. Lindsay, Royal Air Force (RAF)
Treasurer: D. Cockburn
Chairman of the Technical Committee: Dr. Sally Basker
Chairman of the Membership & Fellowship Committee: D. Rydlard
Chairman of the Audit & Risk Committee: D. Goddard, Order of the British Empire, Member (MBE)
Other members of the Council:
R. Angel
D. Barrie (Order of the British Empire, Commander)
Sqn. Ldr. J. Cairns, RAF (Retired)
Lt. Cdr .F. A. Egeland-Jensen, RN
Lt. Cdr. S. E. Gaskin, RN
Dr. M. A. Hadley
P. K. Hope-Lang
Prof. S. Kos
Ms. M. M. G. M. von Wendland
Ex Officio Members:
P. J. Brook, OBE, CAA
Wg. Cdr. S. Gilbert, RAF
John Pottle (Corporate), Spirent
To be named, RN
UPDATE: Title changed to clarify that GPS signals are not affected, but the transfer of the GPS data to the broadcasters.
GPS is playing a role at the 2012 Olympics in London, through apps for smartphones to transportation issues, and even a clash with social media.
Twitter Disrupts GPS Data from Olympic Cyclists to Broadcasters
The International Olympic Committee (IOC) said that social media prevented broadcasters from getting accurate GPS data about the precise location of Olympic bicycle competitors during the155-mile men’s cycling road race.
According to Reuters, commentators on Saturday’s men’s cycling road race were unable to tell television viewers how far the leaders were ahead of the chasing pack because data could not get through from the GPS satellite navigation system traveling with the cyclists.
IOC spokesman Mark Adams says the Olympic Broadcasting Services service was jammed by “hundreds of thousands” of people sending texts, pictures and updates to social networks such as Twitter and Facebook, the Washington Post reports.
To alleviate the bandwidth issue, the IOC asked users not to tweet, saying unless it’s an “urgent, urgent one, please kind of take it easy.”
The problem arose due to lack of data bandwidth provided by telecom carriers, which did not properly anticipate demand. CNET’s Zack Whittaker reports that users send almost 10 million tweets during the opening ceremonies alone.
The problem appeared to be solved for Sunday’s women’s road race.
Apps Spark User Interaction, Excitement
A number of mobile apps will help spectators at the Games keep tabs on the action.
SoFit Mobile. A Toronto-based mobile development company, SoFit Mobile, has released a free social-gaming app that uses GPS technology to track users’ steps as they compete with friends. Users can donate money to charity or unlock medals and real-life discounts and coupons based on how far they travel. Early participants were eligible to win tickets to the games.
The app is designed to connect users with friends virtually, regardless of geographical and cultural differences, where they can train together and take part in athletic events like the New York Marathon.
“Using the Olympics as a way to inspire more people to get active, SoFit will engage users to take small steps to start living healthier while connecting millions to make the world a better place,” said Olympic figure skater Michelle Kwan in a press release.
The app was developed in partnership with the Walk A Mile campaign, which was inspired by the 2012 London Games. SoFit is available for Apple and Android devices.
Samsung Hope Relay. For every mile run while this app is activated, Samsung donates 1 pound to charities, including Kids Company and International Inspiration. The app uses GPS to track the users’ movements walking, running, or cycling, alone or as part of a team.
TorchTracker. This app used GPS tracking to pinpoint where the Olympic Torch was as it made its way to the games, and helped fans find places to see it go by.
American and Australian Team Buses Get Lost
Before the games began, buses taking Australian and American athletes from Heathrow Airport to Olympic Park experienced a failure of GPS end users, sending the athletes around the city for a long tour before arriving at the Olympic Village.
The bus driver hired by London Olympic organizers had not driven or been shown the route before, and could not operate the GPS navigation system fitted in the vehicle. Also, some of the venues, such as the village, had not been pre-loaded into the devices.
For the Aussies, it turned into a 3½-hour marathon, accidentally taking them past central London landmarks such as Buckingham Palace and the Houses of Parliament.
A separate London 2012 bus carrying American athletes got so badly lost it took four hours to make the 23-mile trip across the capital.
Olympic Lanes and GPS Vehicle Tracking
After there were problems for the athletes getting to events in 1996, every host country has had an Olympic Lane to speed the journey for Olympians. However, residents have grumbled about it and there has been some talk about defying the rule and using the lane for unofficial business.
Blogger Oliver Ortiz posits that the conflicts could have been avoided if organizers had made use of GPS vehicle tracking. “The Olympic Lane is open from 6 a.m. until midnight both ways, and for many this is a folly. There will be certain times of the day when the Olympic Lane will be essential and it almost appears lazy on behalf of the Olympics organisers not to consider the best times for the lane to be open. If only they had thought about using GPS Vehicle Tracking to not only design the opening times, but also to monitor the Olympic Lanes during the games and make changes to when they are open. GPS Vehicle Tracking would have made these two things possible.
“London knew they were having the Olympics way back in 2005, could the Olympic Committee not have thought about levels of traffic and travel times at various points in the day using GPS Vehicle Tracking to put forward a more practical schedule for the Olympic Lane to be open?”
European Commission Vice President Antonio Tajani announced in London that the consortium led by OHB System AG and Surrey Satellite Technology Ltd. (SSTL) will build a further eight satellites for the European Union’s Galileo satellite navigation program under the supervision of the European Space Agency.
The new contract will see SSTL continuing its role as payload prime, assembling, integrating and testing the navigation payloads in the UK, whilst OHB System, as the prime contractor, builds the eight satellite platforms and executes the final integration of all the satellites in Germany. The SSTL-OHB partnership is already building fourteen satellites for the Galileo program and will draw on its heritage and experience to produce the additional satellites to demanding schedules.
Matt Perkins, SSTL Group CEO commented “SSTL has played a key role in the development of the Galileo program for nine years and we have the commitment, experience and track record to deliver this substantial contract. We are delighted to have been selected with our partner, OHB, to continue to play our part in building Europe’s operational navigation system.”
SSTL is assembling the Galileo program payloads at its recently opened purpose-built Kepler technical facility in Guildford, UK. Under the contract, SSTL is fully responsible for the construction and test of the navigation payloads. SSTL will manufacture the electrical harnesses and the electronics to interface the navigation payload with the satellite platform. The remaining payload equipment will be externally procured by SSTL from European and other suppliers. SSTL’s payload solution is based on European-sourced atomic clocks, navigation signal generators, high power travelling wave tube amplifiers and antennas and will provide all of Galileo’s services.
Galileo is Europe’s own Global Navigation Satellite System (GNSS), providing real-time positioning, navigation and timing services with unrivalled accuracy and integrity. It will be interoperable with the American GPS system and Russia’s GLONASS system.
The Full Operational Capability phase of the Galileo program is managed and fully funded by the European Union. The Commission and ESA have signed a delegation agreement by which ESA acts as design and procurement agent on behalf of the Commission. The views expressed in this Press Release can in no way be taken to reflect the official opinion of the European Union and/or ESA. “Galileo” is a trademark subject to OHIM application number 002742237 by EU and ESA.
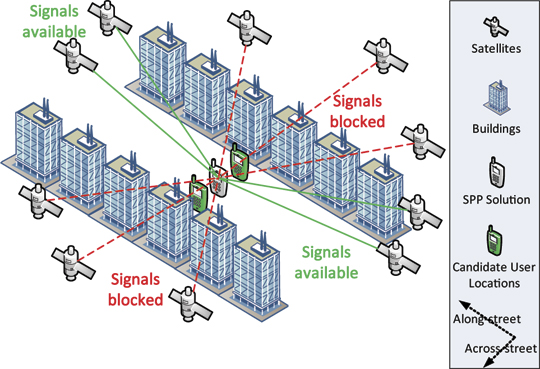
Shadow matching. The two GNSS mobile phones beside the middle one show additional possible user positions referenced by the along-street component of the standard point positioning (SPP) solution.
By Paul D. Groves, Lei Wang, and Marek K. Ziebart
GNSS positioning in dense urban areas is unreliable, with accuracy particularly poor in the cross-street direction. One solution is shadow matching, a new positioning technique that uses 3D building models to predict which satellites are visible from different locations and compares this with the measured satellite visibility to determine position. This article presents test results of a preliminary shadow-matching algorithm in a London urban canyon and discusses the practical implementation of the technique
Poor GNSS positioning accuracy is common in urban canyons where tall buildings block the direct line-of-sight (LOS) signals from many, sometimes most, of the satellites, effectively casting GNSS shadows over the adjacent terrain. Without direct signals from four or more satellites, an accurate position solution cannot be determined. Sometimes, a degraded position solution can be obtained by using signals that can only be received by reflection off a building, known as non-line-of-sight (NLOS) signals.
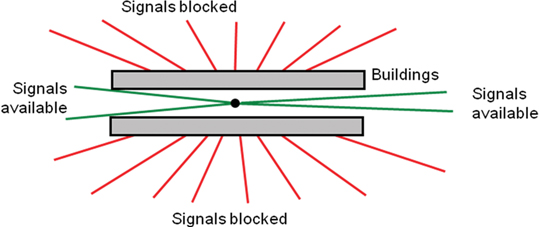
Using GLONASS in addition to GPS considerably enhances direct signal availability, and the ongoing deployment of Galileo and Compass will enhance it further. However, an urban canyon affects the geometry of the available GNSS signals as well as their number. Signals with lines of sight going across the street are much more likely to be blocked by buildings than signals with lines of sight going along the street (see Figure 1). As a result, the signal geometry, and hence the positioning accuracy, will be much better along the direction of the street than across the street. For example, for a building-height-to-street-width ratio of three and direct signals from four GNSS constellations, the cross-street position uncertainty can exceed 20 meters, while the along-street uncertainty is within 5 meters.
Figure 1. Signal geometry of GNSS satellites in an urban canyon (aerial perspective).
This level of accuracy is good enough for some applications but not others. Knowing which side of the street a pedestrian on is useful for visitor guidance and location-based advertising, while it is critical for guiding the blind and visually impaired and for augmented-reality applications. Similarly, lane-level positioning is important for advanced intelligent transportation systems that can direct individual vehicles in order to maximize traffic flow and prioritize emergency vehicles.
Improving GNSS positioning in urban canyons requires lateral thinking. If it’s not possible to calculate a sufficiently accurate position solution using the visible satellites, why not use the nonvisible satellites as well? This is exactly what shadow matching does. If you know where the buildings are and how big they are, you can deduce positional information from the knowledge that certain signals are blocked.
This requires a 3D model of a city’s buildings. These are becoming more accurate and widely available and have already been used to predict GNSS signal availability and multipath interference.
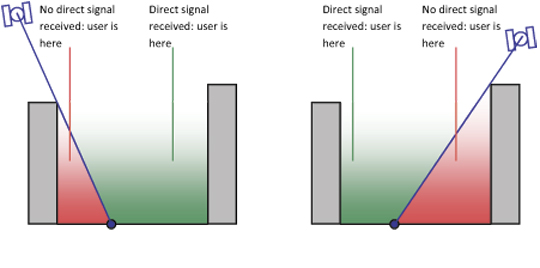
The principle of shadow matching is simple. Due to obstruction by buildings in urban canyons, signals from many GNSS satellites will be receivable in some parts of a street, but not others. Where each direct signal is receivable can be predicted using a 3D city model. Consequently, by determining whether a direct signal is being received from a given satellite, the user can localize their position to within one of two areas of the street. Figure 2 illustrates this. By considering other satellites, the position solution may be refined further, producing a much more accurate cross-street position solution than available from conventional GNSS positioning in this environment. Thus the observed signal shadowing is matched with the predicted shadowing to determine position.
Figure 2. The shadow-matching concept: using direct signal reception to localize position.
This concept of shadow matching, has been proven by mathematical modeling. Satellite visibility predictions using a 3D city model of London have been validated with real-world observation, demonstrating the practical potential of shadow matching. Here, shadow matching is brought from proof of concept one step further to practical demonstration. A preliminary but complete implementation of shadow matching has been developed and tested in London using real-world GPS and GLONASS measurements. The algorithm is described first, followed by the test results. We then discuss dealing with different types of signal propagation that occur in urban areas. and how to implement shadow matching in real time on a platform such as a smartphone.
Shadow-Matching Algorithm
A basic shadow matching algorithm may be broken down into four steps:
Perform standard point positioning (SPP) using GNSS pseudo-ranges to obtain an approximate user position.
Define the search area for the shadow-matching position solution, generating a set of possible user positions close to the approximate position solution.
Predict satellite visibility at each candidate position using the 3D city model.
Evaluate the similarity between predicted and observed satellite visibility at each position. The candidate position with the best match is deemed to be the shadow-matching solution. This process can be conducted epoch by epoch, so the GNSS user can be either static or dynamic.
Conventional Positioning. In the first step, SPP using GNSS pseudo-ranges is conducted to acquire an initial user position. In an urban environment, the accuracy will often be poor, partly due to contamination by NLOS signals. Consistency checking may be used to identify the NLOS signals and, where possible, remove them from the position solution.
Candidate Position Determination. As discussed earlier, signal geometry and hence positioning accuracy will be much better along the direction of the street than across the street. Therefore, in this preliminary shadow-matching algorithm, the along-street component of SPP solution is used as a reference to generate a set of possible user positions that vary in across-street direction only (shown by the two mobile phones beside the SPP solution on the opening page of this article).
A more advanced shadow-matching algorithm would also consider candidate positions in the along-street direction and would vary the size of its search area based on an assessment of the quality of the SPP solution. The smaller the search area, the more efficient the shadow-matching algorithm will be. However, the search area must be large enough to contain the true position. Further research is needed to determine the optimum search area.
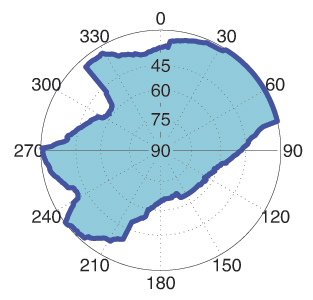
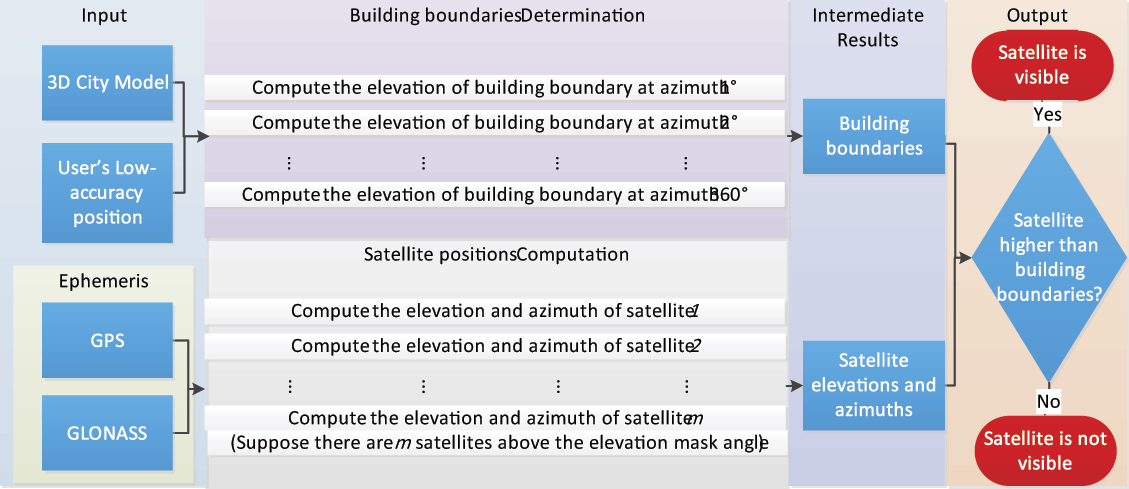
Satellite Visibility Prediction. At each candidate position, the two-step building boundary method predicts satellite visibility from the 3D city model. First, a building boundary from a GNSS user’s perspective is determined for each azimuth (from 0 to 360°) as a series of elevation angles. The results from this step show where the building boundaries are located within an azimuth-elevation sky plot. Figure 3 shows an example of a building boundary computed from a possible user location. Once the building boundary has been computed, it may be stored and reused.
Figure 3. Example of a building boundary as azimuth-elevation pairs in a sky plot. (The centre of the plot correspond to a 90º elevation or normal incidence).
Next, each satellite elevation is compared with the building boundary elevation at the same azimuth. The satellite is predicted to be visible if it is above the building boundary. If the satellite is just within the building boundary, a potentially diffracted signal can be predicted. However, this feature was not included in the preliminary shadow-matching algorithm described here. A software toolkit for determining satellite visibility was developed in C++.
Figure 4 shows the relationships between its processes.
Figure 4. The process of satellite visibility prediction. (Click to enlarge.)
The building boundary approach is efficient where a great number of satellite visibility tests are performed at the same location. For real-time visibility determination, building boundaries may be pre-computed over a grid of possible user locations and stored. However, there is an alternative. Instead of computing building boundaries, each satellite LOS can be directly compared with the city model to determine if it is blocked by buildings. This single LOS method is more efficient overall where only a few satellite visibility tests are performed at a given location. However, for real-time, it imposes a much higher processing load than using pre-computed building boundaries.
In practice, either method may be employed, depending on the situation. For real-time shadow matching, the trade-off is between a higher processing load for the single LOS method and greater data storage for the building boundary method. For non-real-time visibility determination, the trade-off depends on the number of tests required at each location.
Matching Prediction and Observation. The final step, evaluating the similarity between predicted and observed satellite visibility at each position and identifying the best match as the shadow matching solution, comprises three functions: satellite matching, position scoring, and position comparison.
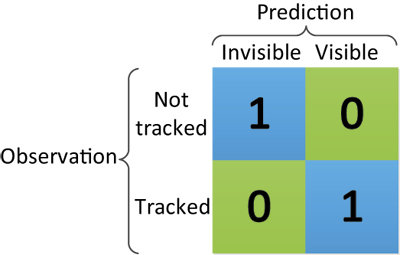
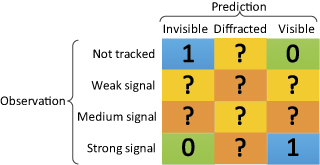
Satellite matching determines for each satellite the degree of similarity between the predicted satellite visibility and the real observation. Figure 5 shows the simple satellite matching function deployed for this study. For each satellite above a pre-set elevation mask angle, if the prediction agrees with the observation, the score is one; otherwise, the score is zero.
Figure 5. Scoring matrix giving the score for each satellite in shadow matching.
Future research will be conducted to extend the matching function so that different scores are produced for signals predicted to be in the diffraction region and signals observed with low and medium signal-to-noise levels.
Position scoring evaluates the overall degree of match between predicted and observed satellite visibility for each possible user position, summing up the satellite matching scores for each candidate position to give a position score.
Finally, position comparison selects the candidate position with the highest overall score and outputs this as the position solution. However, sometimes there is more than one candidate. Further research is needed to find the optimum way of determining a positioning solution with associated error bounds from a grid of shadow-matching scores.
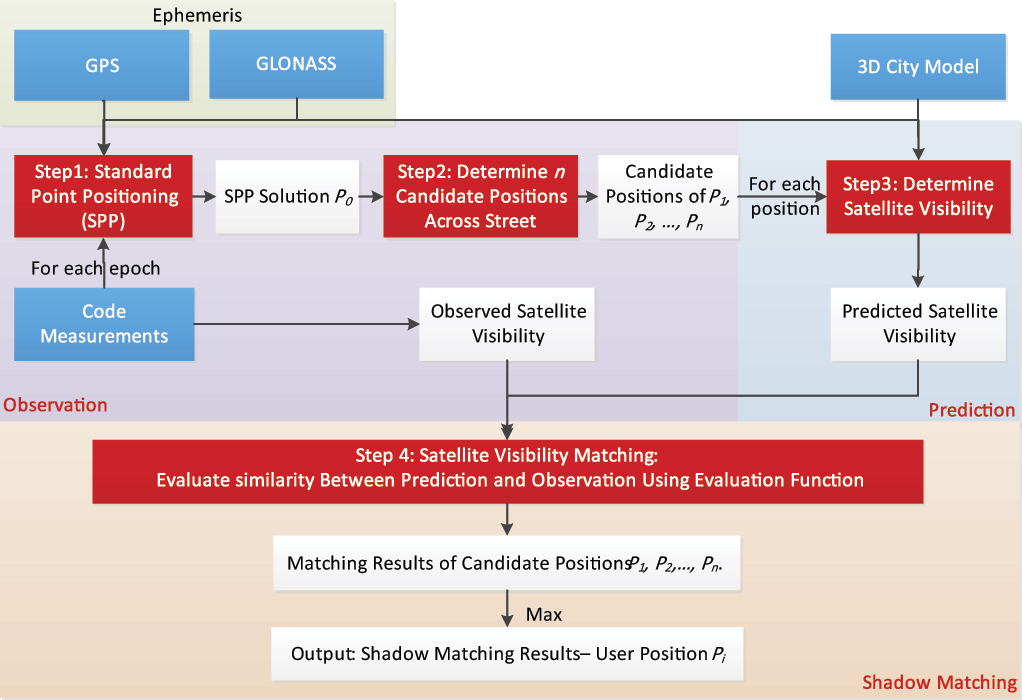
Figure 6 summarizes the shadow-matching process.
Figure 6. The shadow matching process. Blue denotes input data, red denotes main process steps, and white denotes intermediate or final results. (Click to enlarge.)
Experimental Verification
We used a 3D city model of the Aldgate area of central London to test shadow matching. The model has a high level of detail and decimeter-level accuracy.
The software toolkit developed for this study stores and processes 3D city model data using Virtual Reality Modeling Language (VRML), an international standard format. Model data in other formats can be transformed to VRML. Buildings in VRML format are represented by structures, which in turn comprise polygons (normally triangle meshes).
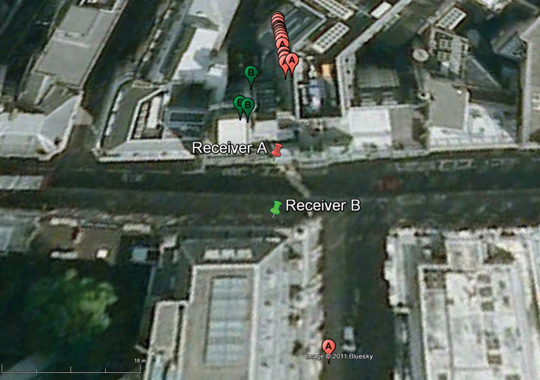
Methodology. Experimental data were collected in a highly built-up area in central London, using two multi-constellation survey-grade GNSS receivers, logging 1 Hz data simultaneously (note that shadow matching does not require two receivers). As shown in Figure 7, they were set up on the north and south sidewalks of Fenchurch Street.
Figure 7. True position of receivers against conventional standard point positioning (SPP) solution. Pins show the true positions and bubbles the SPP solutions; the numbers and colors indicate the receiver.
For the first step of shadow matching, software was used to conduct SPP processing using GPS and GLONASS signals. Only L1 pseudo-ranges were used to acquire an initial user position. It can be seen in Figure 7 that the conventional SPP solutions have significant offsets from the true positions (16–31meters for receiver A and 18–24 meters for receiver B). As receiver B suffers more signal blockage from buildings, it has fewer epochs with four or more satellites in view, so fewer successful SPP GNSS solutions were obtained. Although they have significant offsets in the across-street direction, they are consistent and agree much more with the receivers’ true positions in the along-street direction. This result verifies the assumption made in the shadow-matching algorithm that the accuracy of the along-street SPP positioning solution is much better than in the across-street direction.
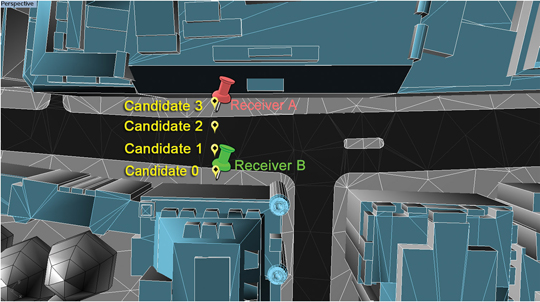
Four candidate user positions were selected using the common along-street position of the conventional SPP solution. They are distributed across the sidewalks and vehicle lanes, on both sides of the street. Figure 8 illustrates this. Note that candidate 3 is the true position of receiver A and candidate 0 is the true position of receiver B.
Figure 8. Candidate user positions (in yellow) and true receiver positions (in red and green) in the shadow matching experimental verification.
Satellite visibility was predicted individually for each of the four positions. Then each was compared with the real data observed from the two GNSS receivers. Figure 8 shows part of the architectural city model of London used to predict the satellite visibility.
Results. The experimental results are shown in three stages: the satellite visibility comparison between prediction and observation, the candidate position scoring function, and the success rate for each candidate location. The primary success criterion is whether the algorithm is able to determine the correct side of the street. A secondary aim is to test whether the algorithm can distinguish between the sidewalk and vehicle lane on the same side of the street.
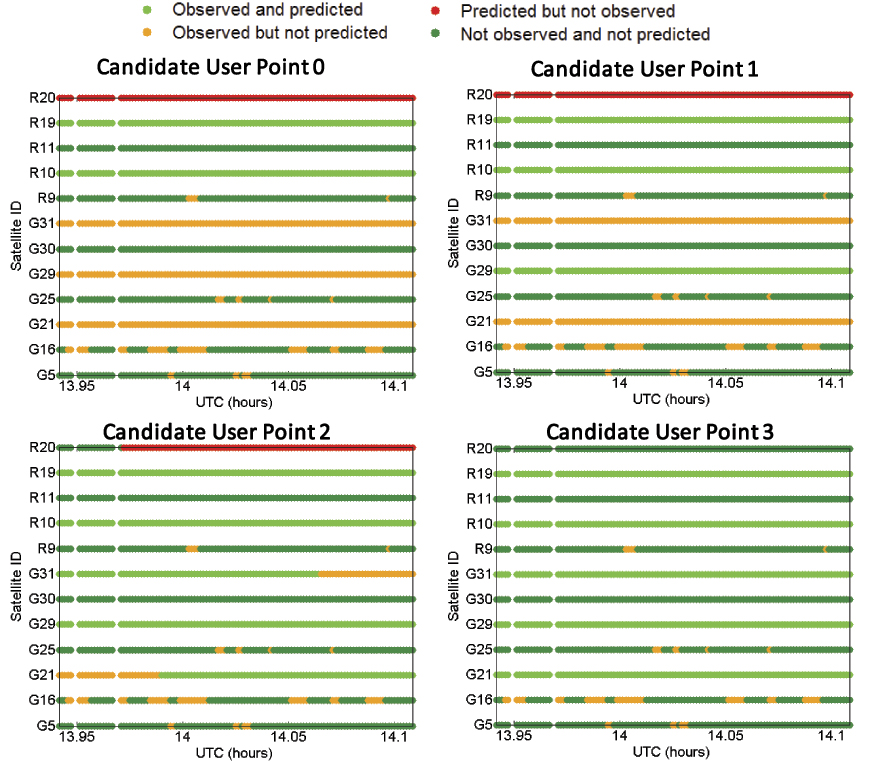
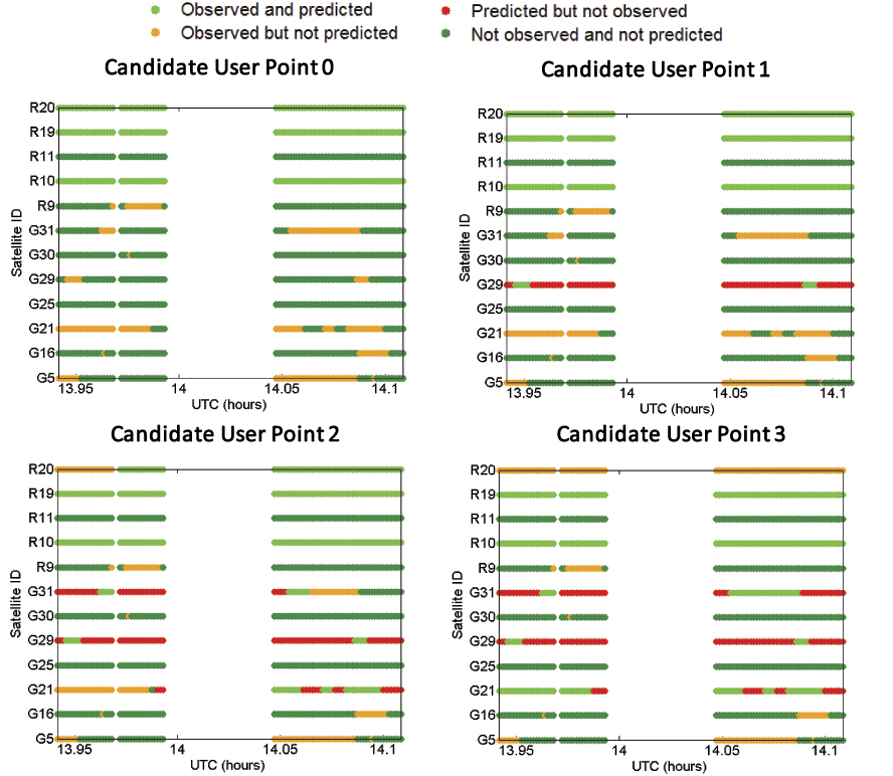
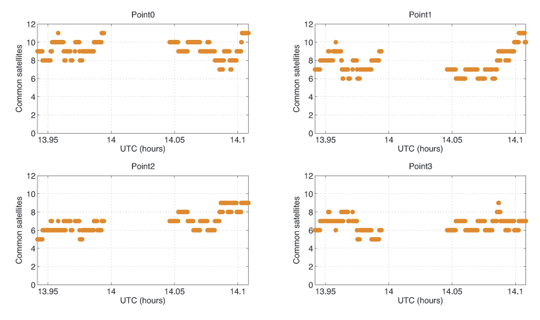
To show the degree of agreement or disagreement between the predicted and observed satellite visibilities, time series for each of the four candidate positions are compared with each of the two receivers’ experimental data. The results are shown in eight graphs. Figure 9 compares data from receiver A for each of four possible user locations. Figure 10 shows the same comparison for receiver B. The time window was from 13:56:30 to 14:06:30 (UTC). G denotes GPS satellites and R refers to GLONASS satellites.
In Figure 9, the green and blue dots indicate an agreement between prediction and observation for the candidate user position, while the orange and red colors represent their disagreement. Thus, a larger number of cases of green and blue indicate a better match between the candidate user location and the observations. Therefore, such a candidate is more likely to be close to the receiver’s true position.
Figures 9 and 10 clearly show that the closer the candidate position is to the true position, the greater the agreement between predictions and observations.
Figure 9. Comparison of satellite visibility between receiver A and candidate user locations (candidate user point 3 is the true position). (Click to enlarge.)Figure 10. Comparison of satellite visibility between receiver B and candidate user locations (candidate user point 0 is the true position). (Click to enlarge.)
Even at the correct candidate location, there is not complete agreement between the observations and predictions. A number of signals were observed but not predicted. These had signal-to-noise levels 8 dB or more lower than the predicted signals and are most likely due to reflection and/or diffraction.
However, shadow matching does not require complete agreement in order to work. In this test, no signals were predicted but not observed at the correct location.
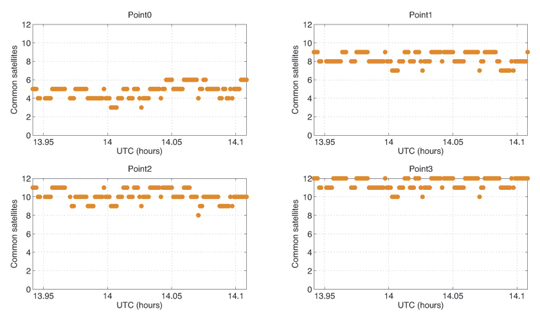
To complete shadow matching, we evaluate each candidate position by summing up the number of satellites common to both the predictions and real observations. Figure 11 and Figure 12 show the results of the summation for receivers A and B, respectively.
Figure 11. Evaluation of similarity — number of common satellites in view between each candidate user point and receiver A.Figure 12. Evaluation of similarity — number of common satellites in view between each candidate user point and receiver B.
It is clear from Figure 11 that among four possible user positions, point 3 is the one with the highest agreement score with the observations from receiver A. As shown in the right-bottom graph, for about half the epochs, visibility predictions for all 12 satellites above the masking angle match the real observations.
As shown in Figure 12, for receiver B, the time series of the agreement score is generally better at the true location (Point 0) than at other points. However, the level of agreement between predictions and observations is not as good as at receiver A‘s location.
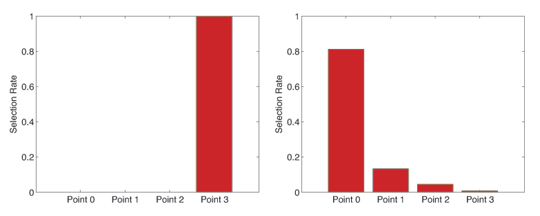
To judge the performance of shadow matching, the selection rate of each of the four candidate user positions for each of the two receivers was computed by dividing the number of times that position was selected by shadow matching by the number of epochs. Where the same score was attained for two or more positions, each position was considered partially selected. For example, if two positions have the same score, then each of them is considered half-selected.
The selection rate results are shown in Figure 13. For receiver A, the shadow matching algorithm correctly indicated the true position among the four candidates 100 percent of the time. This means the algorithm successfully distinguished between the two sides of the street, and further distinguished between a user on the sidewalk and a user in the vehicle lane. For receiver B, the algorithm identified the correct side of the street (Points 0 and 1) 94.65 percent of the time, and the correct location among the four candidates in 81.29 percent of the epochs evaluated.
Taking the average of the two test sites, the correct side of the street was identified 97.3 percent of the time and the correct position from the four candidates 90.6 percent of the time.
Figure 13. Candidate position selection rate for receiver A (left) and receiver B (right).
Practical Implementation
The basic shadow-matching algorithm operates under the assumption that GNSS signals are either directly visible or blocked by a building. However, in reality, signals can also be received via indirect paths due to reflection or diffraction. This was observed at both locations during the tests. As shadow matching seeks the position with the best match, rather than looking for a perfect match, it can tolerate a certain number of these signals and still identify the correct position.
These tests were performed using survey-grade user equipment with a relatively high tracking threshold, so the weakest signals are not observed. Furthermore, the antenna has strong polarization discrimination so exhibits a low gain for reflected signals. However, for shadow matching to be practical, it should also work on a smartphone, which typically combines a high-sensitivity receiver with a linearly polarized antenna, which does not distinguish between direct and reflected signals. Consequently, a smartphone receiver is likely to observe more reflected and diffracted signals.
NLOS reflected and diffracted signals are weaker than directly-received signals, so the shadow-matching algorithm could be modified such that only signals received above a certain signal-to-noise threshold are classified as observed. However, this would introduce a new problem: signals received via a direct LOS path but attenuated by a person’s body would be classified as not observed, even though they would be predicted to be visible at the correct location. The same problem would occur where the LOS coincides with a direction in which the antenna is weak. Consequently, to get the best performance from shadow matching, several different categories of observed signal should be considered in the scoring matrix.
Diffraction occurs when the LOS is just inside the building boundary. Therefore, the 3D city model can be used to predict when a diffracted signal may be received. However, it cannot easily be used to predict the signal-to-noise level of that signal because diffraction patterns are complex. Therefore, shadow matching can potentially be improved by adding a third prediction category for diffraction. Figure 14 shows a posssible optimized scoring matrix with values between 0 and 1 for the new categories to be determined empirically, possibly as functions of the measured signal-to-noise. Different scoring matrices may be suited to pedestrian and vehicle applications and to different user equipment designs.
Directly-received signals are also affected by multipath interference. However, this will not normally impact shadow matching as it does not affect whether a signal is received or not.
Shadow matching has been demonstrated using both GPS and GLONASS measurements. The more signals available for shadow matching, the better the expected accuracy and reliability. Thus, the addition of Galileo, Compass, and regional systems, including SBAS, should improve performance. However, further research is needed to determine whether shadow matching using GPS alone is viable. Combining data from multiple epochs should also improve shadow matching performance, particularly where the user is moving.
A practical shadow-matching algorithm must be implementable in real time on a mobile device. Three models maybe considered.
A network-based solution, whereby GNSS measurements are transmitted to a server, which stores the building boundary data, computes a solution and then sends it to the user.
A handset-based solution, where the shadow-matching algorithm is run on the handset, which also stores the building boundary data.
A hybrid model, whereby the shadow-matching algorithm runs on the handset, but the building boundary data is streamed from a server as and when required.
Using stored or streamed building boundaries, fewer than fifty comparison and addition operations are required to calculate an overall shadow-matching score for one candidate position with two GNSS constellations. Therefore, shadow matching may be performed in real time on a mobile device with several hundred candidate positions, where necessary.
Without any data compression, about 300 bytes are required to store a building boundary with a 1° resolution. If a 2×2 meter grid spacing is used for the candidate positions, a 1-kilometer long, 20-meter wide street will contain 5000 grid points, requiring 1.5 MB of data storage. By exploiting the similarities both between neighboring azimuths in the same building boundary and between building boundaries at neighboring grid points, substantial data compression should be achievable; possibly up to a factor of ten.
Therefore, a standard 4 GB flash drive could store building boundary data for 2,500–25,000 kilometers of road network. For comparison, the Greater London metropolitan area contains about 15,000 km of road. However, as shadow matching is only useful in streets where conventional GNSS positioning is poor, the database need only contain building boundary data for these streets, maybe 10 percent of the total. Therefore, it should be practical to preload a mobile device with shadow-matching data for several cities, which could be kept up-to-date via the internet.
An alternative model is to download the building boundary data from a network server as required. A conventional GNSS position solution or Wi-Fi fix should be able to localize position to within 1,000 grid points, requiring 30–300 kB of building boundary data to be downloaded in order to perform shadow matching. This takes less than two seconds using a 3G mobile phone connection with an average data rate.
In practice, shadow matching, would be implemented as part of a wider intelligent urban positioning system. This shadow-matching algorithm assumes that the user is outdoors. Indoor operation, if viable, would require a different approach. It is necessary to determine the error bounds of the conventional GNSS position solution, not only to determine the search area for shadow matching, but decide whether shadow matching should be performed at all. For example, in a completely open-sky environment, shadow matching will fail, but a good position solution will be obtainable conventionally.
There are other ways in which 3D city models could be used to improve GNSS positioning. For example, they could aid identification of NLOS and multipath-contaminated signals and, in principle, even correction of NLOS ranging measurements. Intelligent urban positioning can also incorporate additional sensors, such as odometers on cars and cell phone signals, WiFi and inertial sensors for pedestrian users.
Next Steps
Three potential future lines of research stem from this work: improving the initialization from conventional GNSS positioning, improving of satellite visibility predictions with ambiguous observations, and optimizing the position determination from the shadow-matching scores. In addition, performance will be evaluated over a wider range of environments.
Acknowledgments
The authors gratefully acknowledge Kimon Voutsis for his support with the experiments. This work has been jointly funded by the University College London Engineering Faculty Scholarship Scheme and the Chinese Scholarship Council. This article is based on a paper presented at the 2011 European Navigation Conference in London, organized by the Royal Institute of Navigation.
Manufacturers
The tests used two Leica Viva GS15 GNSS receivers. Leica Geo-office software performed SPP processing of GPS and GLONASS signals. ZMapping Ltd. supplied the London 3D model.
Paul Groves is a member of the academic faculty at University College London (UCL), where he leads the Space Geodesy and Navigation Laboratory’s program of research on robust navigation and positioning. He is also author of the book Principles of GNSS, Inertial, and Multisensor Integrated Navigation Systems.
Lei Wang is a Ph.D. student at UCL. He received a Bachelor’s degree in geodesy and geomatics from Wuhan University in 2010. His current research interests are GNSS-based positioning techniques for urban canyons.
Marek Ziebart is professor of space geodesy, director of the Space Geodesy and Navigation Laboratory, and vice dean for research of UCL Engineering.


 Apps Spark User Interaction, Excitement