“Seen & Heard” is a monthly feature of GPS World magazine, traveling the world to capture interesting and unusual news stories involving the GNSS/PNT industry.
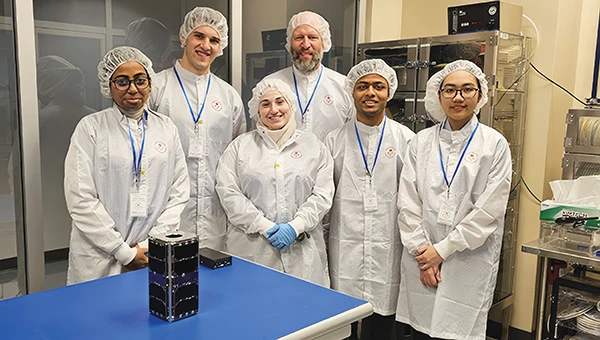
UNB students prepare for second satellite mission
The CubeSat team at the University of New Brunswick (UNB) is developing a second satellite after its first, VIOLET, failed to communicate with Earth. The team is refining its design based on lessons learned from the initial mission. VIOLET, deployed in 2024, was created through a partnership between UNB, the Université de Moncton and the New Brunswick Community College as part of the Canadian Space Agency’s CubeSat Project. This initiative provides students with hands-on experience in designing, building, testing, launching and operating miniature satellites.
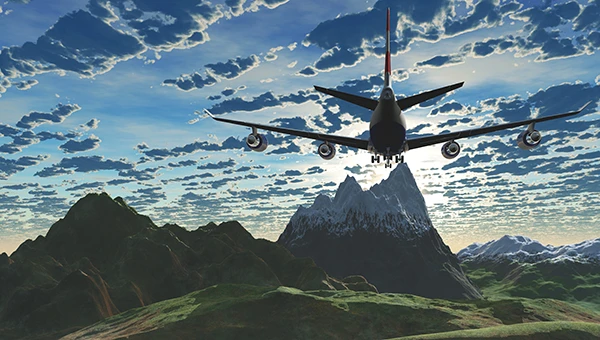
GPS technology played a crucial role in preventing disaster during an EasyJet flight, The Daily Mail reported. As the Airbus A320 descended toward Hurghada, Egypt, it approached dangerously close to a mountain range, flying at an altitude of 3,100 ft — just 770 ft above the peak of the mountain. The Ground Proximity Warning System, which relies on GPS-enabled terrain data, alerted the cockpit with warnings such as “pull up, terrain ahead.” This alarm prompted the pilot to perform an emergency maneuver by pulling up the joystick to level off the plane, narrowly avoiding collision and saving all 190 passengers on board.
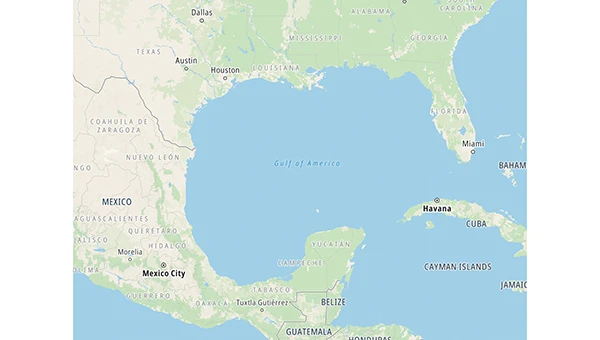
Gulf of America’ name change leaves decisions for map creators
Photo: TomTom
With the U.S. government now recognizing the Gulf waters as the “Gulf of America” and not the “Gulf of Mexico,” TomTom is introducing a U.S. geopolitical view for its users in the United States; they will see “Gulf of America.” Translations will be available in English, Spanish, French and German, and users searching for “Gulf of Mexico” will find the “Gulf of America.” Map users outside of the United States will see the default map view showing the “Gulf of Mexico.” Users searching for “Gulf of America” will find the existing “Gulf of Mexico” feature. All users will be able to change the view based on their preferences
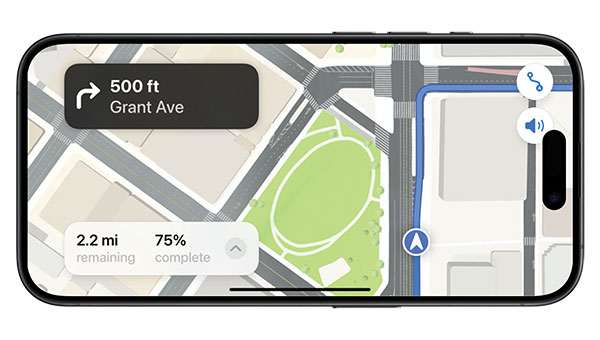
New ‘surveyor’ app for improved mapping accuracy
Photo: Apple
Apple launched the Surveyor app, a tool designed to enhance the accuracy of Apple Maps by collecting real-world mapping data. According to Apple, Surveyor relies on partner companies and users to gather data along assigned routes. The app focuses on capturing detailed information such as street signs, traffic signals and roadside features, which are then transmitted to Apple for precise map updates. By leveraging community-driven data collection, Apple aims to refine its mapping ecosystem and keep critical details current.
Your phone or satnav receiver routinely picks up signals from navigation satellites in order to tell you precisely where you are. But have you ever thought what happens to those satnav signals afterwards? A foresighted ESA inventor had the idea of using them as a tool for observing the Earth.
More than 120 satellite navigation satellites are in orbit, making up multiple constellations including Europe’s Galileo system, sending down a continuous rain of satnav signals for the benefit of users worldwide. Just like visible light, these microwave signals go on to reflect off Earth’s land and sea surfaces.
The traditional attitude to these reflected signals is to see them as something of a nuisance — known as multipath, they can confuse satnav receivers and reduce their overall accuracy.
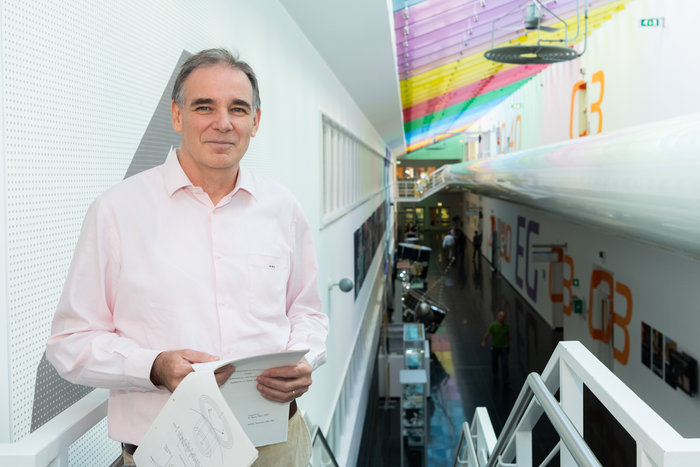
ESA microwave engineer Manuel Martín-Neira, inventor of the PARIS reflectometry concept. (Photo: ESA)
But back in 1993 — at the same time as the US GPS satnav system reached its full constellation of 24 satellites — a young ESA microwave engineer called Manuel Martín-Neira came up with the idea of treating these satnav reflections as a scientific resource instead.
“My head of division asked me to come up with a budget-friendly way of increasing the overall sampling rate to build up a fuller picture of mesoscale phenomena, and that led me to start looking into making use of additional signals of opportunity, chiefly satnav signals.
“The initial reaction was mixed, because the forecast accuracy was not as precise as the ERS-1 altimeter could deliver — but on the plus side there would be a lot of these signals to make use of, and the performance has improved a lot since those early days.”
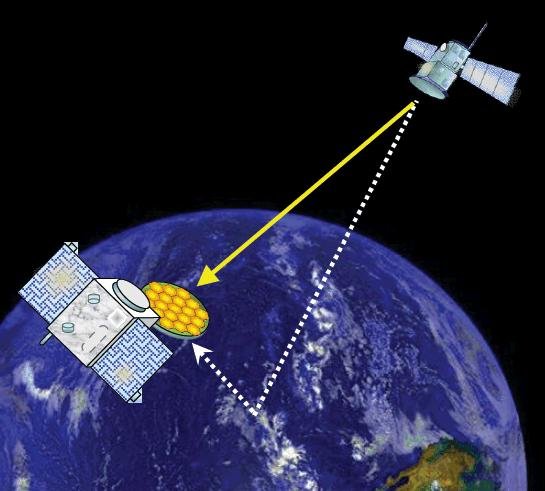
PARIS, detecting reflected satnav. (Photo: ESA)
Inspiration from reflection
The basic idea of what Manuel christened the Passive Reflectometry and Interferometry System, or PARIS, comes down to a two-sided antenna. As the topmost side picks up a satnav signal from the satellites in orbit, the other side picks up the version of the signal bounced back from Earth.
By comparing this initial, overhead signal with its reflected equivalent using a process called interferometry — measuring tiny differences in signal phases – the extra travel time of this reflected beam can be determined, down to an accuracy of less than five centimetres, determining sea height and sea ice thickness.
Additional amplitude waveform processing can deliver further data on wind and wave measurements over the ocean, and soil moisture and biomass over land.
Satellite reflectometry has since grown into a thriving field. This summer, Manuel attended the latest international workshop on the method he first devised 26 years ago.
Reflectometry reaches space
“It’s been fantastic to have experimental evidence, and that’s really been made possible by the growing availability of smaller satellites,” explains Manuel.
“Because satellite reflectometry is a passive form of remote sensing, it makes for an attractive potential payload because it doesn’t need a lot of power to operate. Then one of the results is meteorology data that private companies intend to make money with by delivering to public agencies.”
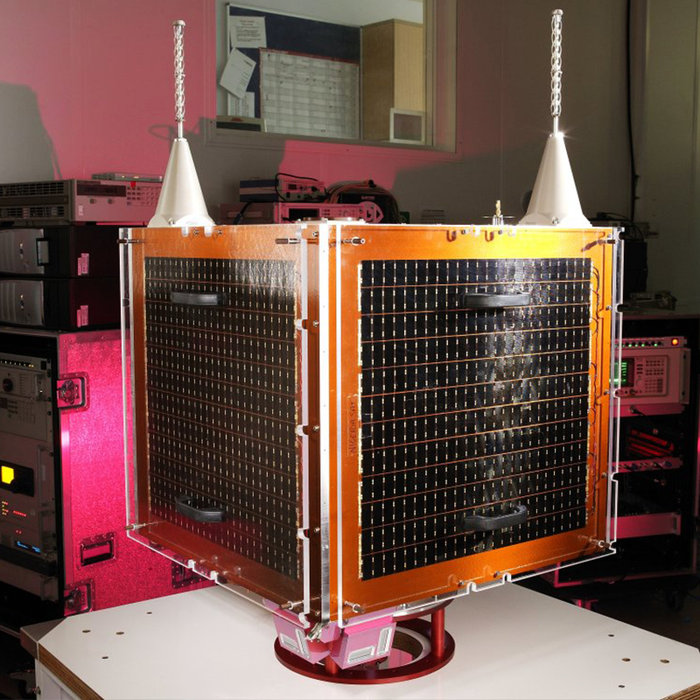
Surrey Satellite Technology Ltd.’s UK-DMC satellite was the first orbital mission with a reflectometry payload. (Photo: ESA)
In 2003, the UK-DMC satellite was the first mission to fly a reflectometry payload, followed in recent years by, for example, the UK’s TechDemoSat-1, NASA’s CyGNSS constellation to monitor hurricanes and the Spire global constellation of commercial nanosatellites.
“These satellites have really given the reflectometry community a wealth of signals, demonstrating what reflections look like over different surfaces including sea ice, forests, and even inland water bodies such as the Amazon River and its tributaries.
“In parts of the ocean near continental masses and within atolls we are seeing reflected signals from very calm waters which resembled a mirror, giving us very high precision down to 1 cm level. Such measurements could potentially complement current altimetry missions, by for instance measuring sea level rise.”
Example of a CYGNSS Microsatellite Observatory. (Image: Southwest Research Institute)
ESA activities taking flight
ESA meanwhile is active on reflectometry in various ways, having developed and tested a steerable airborne antenna called the Software PARIS Interferometric Receiver or SPIR, capable of steering separate antenna beams to build up a rapid surface picture, and differentiating between different signal sources, such as GPS from Galileo.
Manuel adds: “ESA’s GNSS Science Support Centre, based at the Agency’s European Space Astronomy Centre near Madrid, has been taking a keen interest in these activities.”
Missions are also in development, including a dedicated CubeSat with RUAG-Austria and the University of Graz called PRETTY (for Passive REflecTomeTry and dosimetry, which would also carry a radiation detector), and a small satellite pair called FSSCat from Spain’s Universitat Politècnica de Catalunya, backed through the Copernicus Masters competition, seen as a prototype for a future reflectometry constellation.
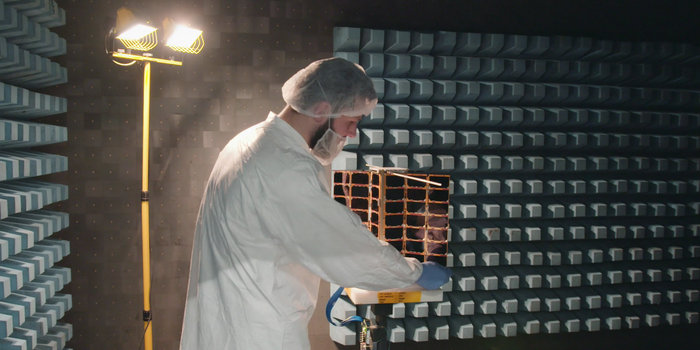
ESA’s Directorate of Telecommunications and Integrated Applications is also working with the Spire company to fly enhanced reflectometry instruments, starting at the end of this year.
One of Spire’s Satellite Manufacturing Technicians (Tomasz Chanusiak) tests the Radio Frequency capabilities of a LEMUR2 nanosatellite in Spire’s cleanroom in Glasgow, Scotland. (Photo: ESA)
When it comes to the thriving state of today’s reflectometry community, Manuel recalls the patenting of his idea as a turning point: ‘Having had this idea, which was not particularly well received, the proposal by ESA’s Patents Group to patent it made all the difference. It gave me a feeling of confidence, that somebody else at least saw the potential of this idea — and the rest is history.”
lava inundation zones: In this USGS map, colors depict 3 of 18 lava Inundation zones for Mauna Loa. Yellow indicates the volcano’s Northeast Rift Zone, an area along which lava could erupt. The extent of the 1984 eruption and lava flow is superimposed on the map (red).
New U.S. Geological Survey (USGS) maps show areas that could be affected by Mauna Loa lava flows — information critical for response planning. Each zone identifies a segment of the volcano that could erupt lava and send flows downslope.
The volcano has erupted 33 times since 1843. Typically, eruptions began in the summit caldera, with a curtain of fire (a 1- to 2-kilometer line of lava fountains).
Using detailed geologic mapping and modeling of how a fluid (in this case, lava) responds to surface topography, the USGS Hawaiian Volcano Observatory constructed nine maps depicting 18 inundation zones on Mauna Loa, Island of Hawai’i.
Colored regions on these maps show areas on the volcano’s flank that could potentially be covered by flows from future Mauna Loa eruptions. These eruptions could originate from the volcano’s summit, rift zones or radial vents. It’s likely, however, that only part of a zone would be covered in a single eruption.
When a Mauna Loa eruption starts, the maps can help decision makers quickly identify communities, infrastructure and roads between possible vent locations and the coast, facilitating more efficient and effective allocation of response resources, the USGS said. The public can also use the maps to consider where lava flows might go once an eruption starts.
lava flow glow: Had the Mauna Loa inundation maps been available in April 1984, when the volcano last erupted, the maps could have been used to determine that the northern portion of Hilo was the most likely area to be impacted by the main lava flow. (Photo: David Little)
Lava inundation zones: In this USGS map, colors depict 3 of 18 lava Inundation zones for Mauna Loa. Yellow indicates the volcano’s Northeast Rift Zone, an area along which lava could erupt. The extent of the 1984 eruption and lava flow is superimposed on the map (red). (Map: USGS)
New U.S. Geological Survey (USGS) maps show areas that could be affected by Mauna Loa lava flows — information critical for response planning. Each zone identifies a segment of the volcano that could erupt lava and send flows downslope.
The volcano has erupted 33 times since 1843. Typically, eruptions began in the summit caldera, with a curtain of fire (a 1- to 2-kilometer line of lava fountains).
Using detailed geologic mapping and modeling of how a fluid (in this case, lava) responds to surface topography, the USGS Hawaiian Volcano Observatory constructed nine maps depicting 18 inundation zones on Mauna Loa, Hawaii.
Colored regions on these maps show areas on the volcano’s flank that could potentially be covered by flows from future Mauna Loa eruptions. These eruptions could originate from the volcano’s summit, rift zones or radial vents. It’s likely, however, that only part of a zone would be covered in a single eruption.
When a Mauna Loa eruption starts, the maps can help decision makers quickly identify communities, infrastructure and roads between possible vent locations and the coast, facilitating more efficient and effective allocation of response resources, the USGS said. The public can also use the maps to consider where lava flows might go once an eruption starts.
lava flow glow: Had the Mauna Loa inundation maps been available in April 1984, when the volcano last erupted, the maps could have been used to determine that the northern portion of Hilo was the most likely area to be impacted by the main lava flow. (Photo: David Little)
Esri released “Peaks and Valleys,” a 3D Story Map that displays the highest and lowest point on the planet.
The map features the heights and descriptions of these points. It takes viewers on a journey through mountain ranges and valleys in the Americas, Africa, Europe, Australia, Antarctica and the Pacific — from Mount Everist to the Challenger Deep.
“Our planet’s peaks and valleys represent some of its most hostile, remote and beautiful environments,” the website reads. “These extreme locations continue to hold a strange allure to explorers and adventurers. To those of us who are adventurers of the armchair type, and who are unlikely to experience these vertiginous locales first-hand, we present this virtual tour of Earth’s highs and lows.”