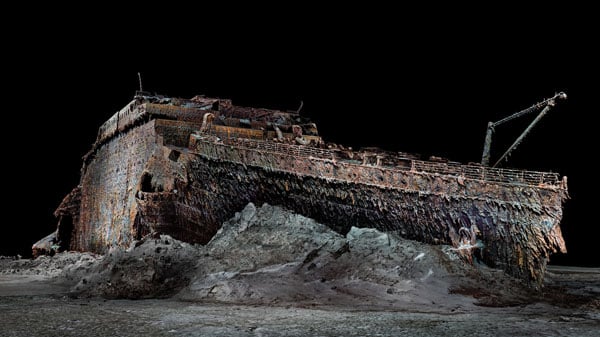
In 2022, deep-sea mapping company Magellan undertook the largest underwater 3D scanning project of its kind to create the first full-size digital scan of the Titanic. The luxury passenger liner sank in the North Atlantic Ocean on April 15, 1912, after striking an iceberg, and now rests 12,500 ft below the surface.
Over three weeks, the Magellan team worked around the clock to capture the luxury vessel in unparalleled detail. They used two remotely operated vehicles (ROVs) — dubbed Romeo and Juliet — to systematically canvass the site. In total, the ROVs collected 715,000 photos, 4K footage and millions of laser measurements — a total of 16 terabytes of data.
The scan itself was only the beginning. The Magellan team then processed the collected data into a smooth, comprehensive 3D point cloud. Applying new processing techniques to the original Magellan IP and raw data sets provided a new data set with 35% better resolution and accuracy. Each point in the dense point cloud used to generate the model has its unique set of Cartesian coordinates(X,Y, Z), time stamp and texture.
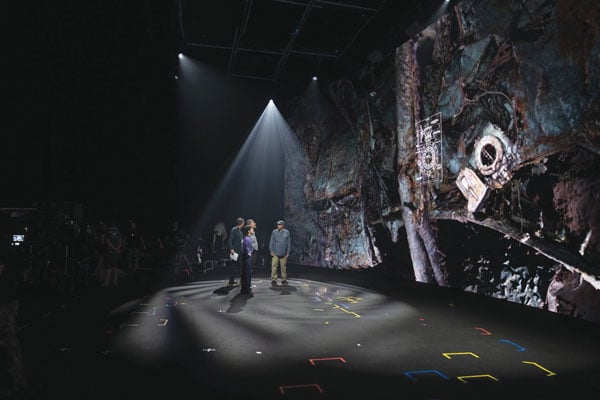
Titanic analyst Parks Stephenson has visited the actual Titanic wreck twice, but the virtual scan revealed
details he never saw before. Aboard a submersible, with its six-inch viewport and limited camera views, details are easily missed. “It’s like being in a dark room and you have a flashlight that’s not very
powerful,” Stephenson told National Geographic. The digital twin gave him an unobstructed, 360° view of every nook and cranny.
The digital twin reconstructs Titanic’s structural collapse in forensic detail. A video rendering of it can be projected to life-size in a warehouse, allowing experts to walk through its final moments. For instance, an open steam valve in the boiler room validates eyewitness accounts that the ship’s engineers remained at their posts for more than two hours after impact, keeping the electricity on and allowing wireless distress signals to be sent. The 35 men may have saved hundreds of lives while sacrificing their own.
The digital scan also helps exonerate First Officer Murdoch, long accused of abandoning his post. The position of a lifeboat davit suggests his crew was preparing a launch moments before the starboard side was engulfed, corroborating Second Officer Charles Lightoller’s testimony that Murdoch was swept away by the sea.
The scans reveal the wreck’s alarming deterioration, with iconic areas collapsing. But the mapping project means the ship is now digitally preserved, along with similar models of historic sites around the world.
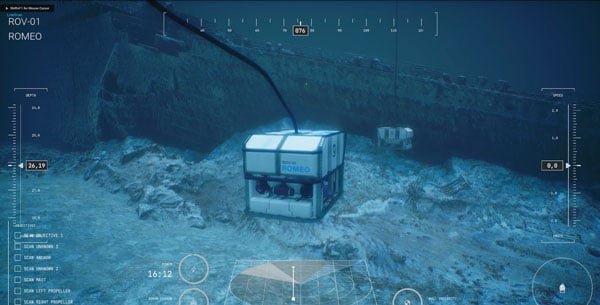
the Titanic’s scans, available in Early
Access on the Steam platform. “vROVpilot:
TITANIC” puts users in the pilot seat of
a virtual ROV to explore the wreck and
complete missions to scan its key features.
The experience comprises an accurate
ROV user interface, along with realistic
underwater condition visual effects and
comprehensive sound effects, according to
the developer.
So far, the app is using only the data
on the bow, which is less than 35% of the
full data set. The stern is expected to be
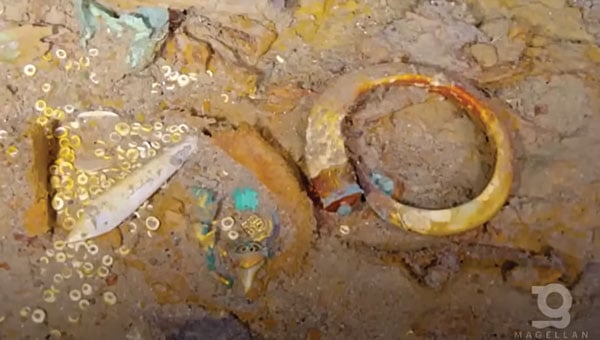
added next, followed by the 15-squaremile debris field, which shows personal
effects such as pocket watches, purses,
gold coins, hair combs, shoes and a
Megalodon-tooth necklace. (Photo: Magellan Limited/Atlantic Productions)