Tag: Mauna Loa

  • Satellite observation is helping to map lava from Hawaii’s Mauna Loa volcano

    Satellite observation is helping to map lava from Hawaii’s Mauna Loa volcano

    Image: USGS
    Image: USGS

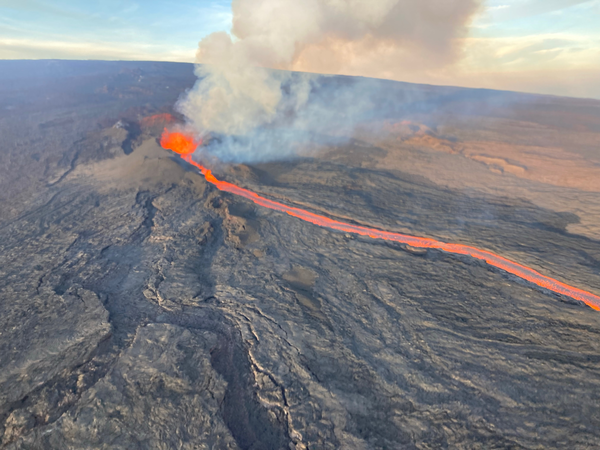
    In late November, the Mauna Loa volcano in Hawaii erupted for the first time since 1984 and is currently in an active volcanic eruption. Scientists are using satellites and helicopters to record and map the flow of lava on the Big Island.

    The active eruption is in a remote area on the island, making it difficult to map it and the lava flow. It is critical to have accurate emergency information during the eruption in order to have appropriate resources and have ample time to evacuate, if necessary.

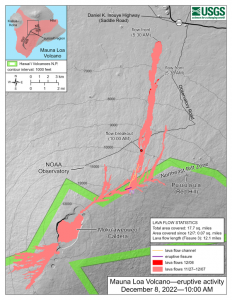
    The easiest and most accurate way to map the lava from this eruption is via satellite. Based on satellite observation, scientists have been able to create a mobile app to support helicopter crews in making maps of lava flow that update in real time. This real time evaluation is sent to emergency personnel and geologists tracking the eruption patterns.


    Photo:
    Image: USGS

    Mauna Loa has erupted 33 times, the most recent of which was 38 years ago. The volcano typically averages an eruption every 5 years, making Mauna Loa’s most recent dormant period longer than normal. According to the U.S. Geological Survey (USGS), this eruption was caused by an increase in earthquakes below the Mauna Loa Summit, an increase of inflation tracked by GPS stations, and several additional geologic factors.

    Live footage of the Mauna Loa eruption can be seen here.

  • USGS map locates lava flows before an eruption

    lava inundation zones: In this USGS map, colors depict 3 of 18 lava Inundation zones for Mauna Loa. Yellow indicates the volcano’s Northeast Rift Zone, an area along which lava could erupt. The extent of the 1984 eruption and lava flow is superimposed on the map (red).

    New U.S. Geological Survey (USGS) maps show areas that could be affected by Mauna Loa lava flows — information critical for response planning. Each zone identifies a segment of the volcano that could erupt lava and send flows downslope.

    Hawaii-laval-maunaloa-map-WThe volcano has erupted 33 times since 1843. Typically, eruptions began in the summit caldera, with a curtain of fire (a 1- to 2-kilometer line of lava fountains).

    Using detailed geologic mapping and modeling of how a fluid (in this case, lava) responds to surface topography, the USGS Hawaiian Volcano Observatory constructed nine maps depicting 18 inundation zones on Mauna Loa, Island of Hawai’i.

    Colored regions on these maps show areas on the volcano’s flank that could potentially be covered by flows from future Mauna Loa eruptions. These eruptions could originate from the volcano’s summit, rift zones or radial vents. It’s likely, however, that only part of a zone would be covered in a single eruption.

    When a Mauna Loa eruption starts, the maps can help decision makers quickly identify communities, infrastructure and roads between possible vent locations and the coast, facilitating more efficient and effective allocation of response resources, the USGS said. The public can also use the maps to consider where lava flows might go once an eruption starts.

    A pamphlet about the maps is available here.

    lava flow glow: Had the Mauna Loa inundation maps been available in April 1984, when the volcano last erupted, the maps could have been used to determine that the northern portion of Hilo was the most likely area to be impacted by the main lava flow. (Photo: David Little)
  • Locating lava flows before an eruption

    Locating lava flows before an eruption

    lava inundation zones: In this USGS map, colors depict 3 of 18 lava Inundation zones for Mauna Loa. Yellow indicates the volcano’s Northeast Rift Zone, an area along which lava could erupt. The extent of the 1984 eruption and lava flow is superimposed on the map (red). (Map: USGS)
    Lava inundation zones: In this USGS map, colors depict 3 of 18 lava Inundation zones for Mauna Loa. Yellow indicates the volcano’s Northeast Rift Zone, an area along which lava could erupt. The extent of the 1984 eruption and lava flow is superimposed on the map (red). (Map: USGS)

    New U.S. Geological Survey (USGS) maps show areas that could be affected by Mauna Loa lava flows — information critical for response planning. Each zone identifies a segment of the volcano that could erupt lava and send flows downslope.

    The volcano has erupted 33 times since 1843. Typically, eruptions began in the summit caldera, with a curtain of fire (a 1- to 2-kilometer line of lava fountains).

    Using detailed geologic mapping and modeling of how a fluid (in this case, lava) responds to surface topography, the USGS Hawaiian Volcano Observatory constructed nine maps depicting 18 inundation zones on Mauna Loa, Hawaii.

    Colored regions on these maps show areas on the volcano’s flank that could potentially be covered by flows from future Mauna Loa eruptions. These eruptions could originate from the volcano’s summit, rift zones or radial vents. It’s likely, however, that only part of a zone would be covered in a single eruption.

    When a Mauna Loa eruption starts, the maps can help decision makers quickly identify communities, infrastructure and roads between possible vent locations and the coast, facilitating more efficient and effective allocation of response resources, the USGS said. The public can also use the maps to consider where lava flows might go once an eruption starts.

    A pamphlet about the maps is available here.

    lava flow glow: Had the Mauna Loa inundation maps been available in April 1984, when the volcano last erupted, the maps could have been used to determine that the northern portion of Hilo was the most likely area to be impacted by the main lava flow. (Photo: David Little)