“At this year’s plenary session, we’ll explore a vision for building a better world,” said Esri President Jack Dangermond, who will deliver the keynote address. With the theme of GIS—Creating a Sustainable Future, attendees can learn from leaders in human storytelling, racial equity, ocean preservation and climate resilience, as well as discover the latest geospatial innovations.
Following the keynote, a two-part Plenary Session provides conversations and stories from these speakers:
Paul Salopek | Founder, Out of Eden Walk, National Geographic A Walk Through the Anthropocene
La June Montgomery Tabron | President and CEO, W.K. Kellogg Foundation
Expanding Racial Equity through Community Action
Enric Sala | Explorer in Residence, National Geographic Pristine Seas
2021–2030: Our Last Best Chance to Protect the Ocean for the Benefit of Humanity
Protecting the Global Ocean for Biodiversity, Food and Climate
Secretary Wade Crowfoot | California Natural Resources Agency
Nature-Based Solutions in California: Combating Climate Change and Achieving 30×30
The Esri UC will also provide a look at new GIS technologies in expert-led demonstrations, including ArcGIS Image for ArcGIS Online. Attendees can learn to directly integrate imagery into your workflows by fast-tracking image analysis and easily sharing data to derive and communicate critical insights.
Registration for the Plenary Session is complimentary. Full event access is available to Esri users current on their maintenance or subscriptions.
The worlds of UAVs, lidar and surveying overlap, with UAV-based lidar able to shed light on places that are difficult or dangerous to access by other means.
Two questions come into play when deciding whether to use UAV-based lidar for a surveying project. First, do you use a UAV or a manned aircraft? The answer concerns cost, safety and efficiency.
Second, do you use only photogrammetry or photogrammetry plus lidar? This answer depends not only on cost, but payload weight — the single biggest constraint with UAVs. Lidar scanners weigh considerably more than comparable digital cameras.
Far from being mutually exclusive, photogrammetry and lidar are complementary, because digital images make it possible to colorize lidar point clouds, making them easier to interpret. However, the less a UAV’s payload weighs, the greater its flight time per battery charge.
“Most surveyors do not want to be UAV pilots. They want to do their job faster and easier,” said Jake McCay, director of business development at Lidar USA. His company manufactures laser systems — integrated with IMUs and software — for backpack systems, UAVs and helicopters. UAVs make surveyors much more productive and yield more accurate data because they enable them to collect many more points, he said.
UAV versus manned aircraft
Traditionally, data for corridor mapping — such as for power lines and railroads — has been captured with helicopters. However, cost and safety considerations have increasingly shifted the balance toward UAVs, especially hybrid systems that can take off vertically then transition to horizontal flight.
UAVs are also able to fly much lower than manned helicopters, thereby capturing data at much greater resolution.
Nevertheless, manned aircraft still have advantages. “Typically, the break-even is somewhere between 20 km and 40 km on a corridor mapping project if you consider a multi-rotor setup,” said Philipp Amon, business division manager, ULS, Riegl Laser Measurement Systems GmbH. “It takes a week of data acquisition using a UAV and two staff out in the field for what you can normally collect in half a day using a manned aircraft. The costs are almost the same.”
Beyond-visual-line-of-sight (BVLOS) flights are challenging for UAV pilots, because it makes them nervous to lose sight of their expensive platform. Successful BVLOS flights require a dependable and redundant data link. High-quality video transmissions that allow operators to monitor their UAV’s behavior in real time and with no significant latency are also very helpful. “If you do not have all these systems in place, I would not risk it either,” Amon said.
Whether mapping a corridor with a UAV or a manned helicopter, it is best to fly in one direction to the side of the corridor, then return on the other side, capturing data at an oblique angle rather than at nadir. This doubles the point density, enables the correction of any shadows created in a single flight, and — in the case of power lines — enhances safety.
Manned operations require a team of four and a helicopter, as well and a much greater focus on safety than UAVs, said John “JP” Cannon. Cannon is a UAV pilot for PrecisionHawk and team lead of the company’s lidar flight operations, totaling five pilots and more than 10 lidar sensors.
With a manned aerial survey, “You are a little more efficient, but you are burning a lot more logistics to get to that point,” he said. With a UAV, “if you have a properly calibrated sensor and a well-trained pilot, you can get even better data because you can fly lower and slower.” A manned helicopter would require multiple passes to get the same quality of data.
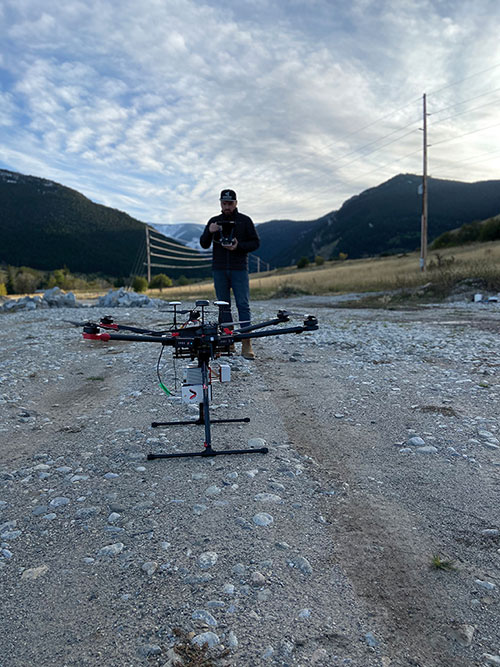
UAVs can collect data even in very remote locations, for later post-processing. (Photo: Lidar USA)
Lidar and photogrammetry
“We combine our lidar systems with all kinds of photogrammetry solutions, such as standard RGB cameras, in both nadir and oblique mounting options,” Amon said. “We also have multi-spectral cameras, hyperspectral cameras, and thermal-imaging sensors in our portfolio, and we offer fully integrated systems that combine all these sensors into one system.”
His customers prefer to use lidar sensors, especially to penetrate vegetation, Amon said. “That is often the most critical part of a survey, especially if you have dense vegetation and are looking for small objects, like in a powerline survey.” While a laser scanner’s multiple returns make it possible to extract surfaces even under vegetation, photogrammetry excels for spot detection.
“If you really want to nail down the error at a specific point, you will need to look at the photogrammetry data. If you want to do surface extraction, classification and remove vegetation, then you are looking for lidar.”
It is generally much faster to post-process lidar data because it does not require georeferencing and correcting thousands of images, but extracting and classifying features takes about the same amount of time.
Lidar “enables utility industry leaders to more effectively manage their networks,” said Cannon. It gives them “a visibility of their assets that photogrammetry just cannot provide, with more robust, precise and consistent data sets.”
Lidar data, he argued, is also less labor-intensive than photogrammetry, because the latter requires constantly tweaking camera features to deal with changes in the environment, such as the amount of light, whereas a well-calibrated lidar scanner “always performs.”
After having tried numerous lidar scanners over the years, PrecisionHawk chose the Riegl miniVUX-1DL, a downward-looking version that can shoot 23˚ off nadir, forward, center and rear. “We use it 20 times a day across multiple platforms.,” Cannon said. “Its data output is consistent and reliable.”
Dissenting voice
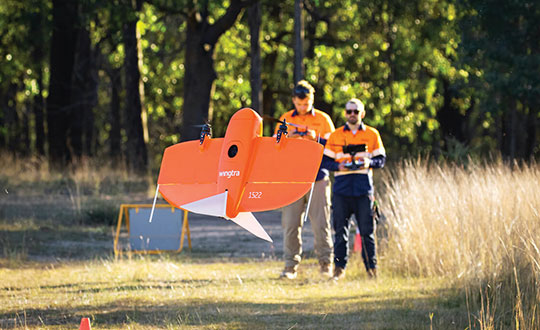
A dissenting voice is that of Wingtra, a manufacturer of vertical take-off and landing UAVs for mapping, survey and mining industry professionals, which has decided not to pursue UAV-based lidar for surveying. “We looked at different use cases, which sensor makes sense for each one, what is already there, and what can be done with manned aircraft and photogrammetry,” explained Andrea Nater, the company’s customer success manager.
“We found that the space for UAV-based lidar systems is very small. There are claims about very high accuracy, but we have not seen that. The point density we have seen so far is limited to 10-cm spacing, so you are really limited in an accurate and dense point cloud, whereas you can have a much higher resolution with photogrammetry.”
While the platform’s absolute position is independent of whether it carries a digital camera or a lidar sensor, “if you have fewer points on the ground, you also have less accuracy,” Nater said. For large areas, UAV-based lidar cannot compete with manned aircraft carrying expensive systems, she said.
“We have also compared manned aircraft with a UAV with low-cost lidar and an RX1 camera. For most use cases you are better off with a high-quality camera rather than a ‘low cost’ lidar. Despite the lidar being more expensive than the camera, the final outputs (point cloud or 3D mesh) generated by photogrammetry have a lower noise level and a higher point density.”
As a bonus, there are more tools for photogrammetry. “The workflows with the many photogrammetry companies are very simple to use, whereas for lidar it is still not as well established and easily adoptable by everyone as it claims to be,” Nater said.
Wingtra’s UAVs perform vertical take off and landing (VTOL), but fly horizontally. New European regulations easing restrictions on flight beyond visual line of sight (BVLOS) make this increasingly common. (Photo: Wingtra)
Positional accuracy
Achieving high positional accuracy with a UAV is challenging, due to the platform’s weight and size limitations for GNSS receivers and antennas. For dedicated UAV missions, Riegl uses the Applanix AV14 and AV18 antennas. The latter can acquire corrections directly from the satellites on L5 without needing a base station, achieving an accuracy of about 5–10 cm.
“We mainly couple our systems with Applanix APX-15 UAV or APX-20 UAV INS/GNSS components,” Amon said. “There are almost no cables needed for an overall system set-up besides power and GPS.” To achieve accuracies of a couple of centimeters, Riegl recommends that users post-process the data. Nearly all of them do, using a single base station in addition to the L-band corrections.
PrecisionHawk uses Riegl lidar equipped with the Trimble Applanix APX20 IMU for direct georeferencing of collected points. “It gives us an absolute and relative positional accuracy of about 2 cm to 5 cm horizontally, with a little bit less vertical accuracy, from 8 cm to 10 cm,” Cannon said. “We couple it with our NovAtel base-station data for PPK corrections. So, everything we do is post-processed, which enables us to focus on safety and efficiency in the field, rather than, say, pulling in RTK corrections and constantly stopping due to jammed signals.”
Lidar USA uses GNSS receivers from “pretty much every manufacturer,” McCay said. “What system we choose depends on the client’s specs. The performance varies greatly. You can buy a $5,000 GNSS-IMU or a $180,000 GNSS-IMU.” Likewise, Lidar USA is not married to a specific platform. “Our system is universal and can be put on several different platforms, as long as they have the payload capacity and have enough clearance for the system underneath.”
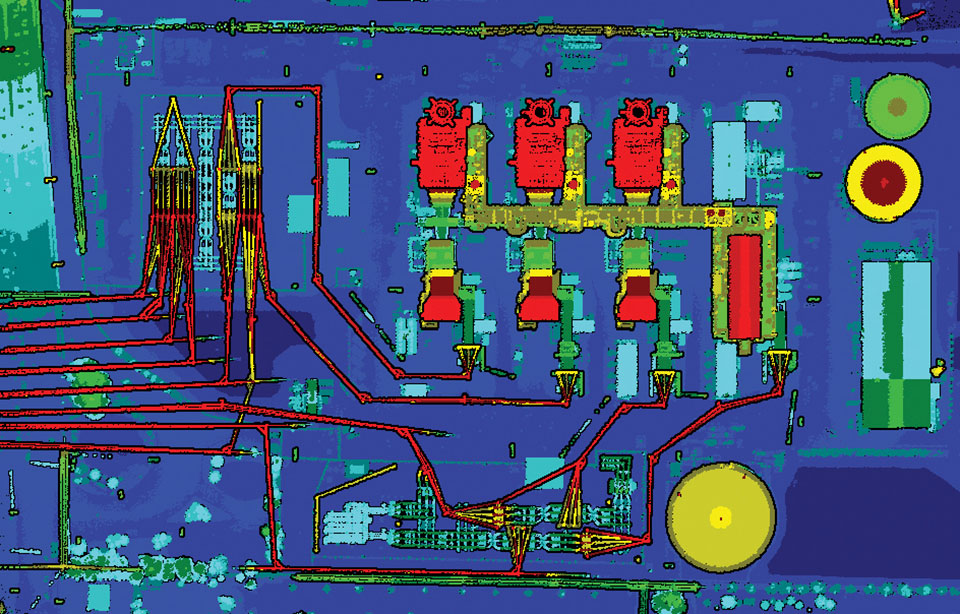
Lidar can reveal the intricate details of an infrastructure, such as this power plant. (Photo: PrecisionHawk)
Multisensory systems
The most common combination of sensors is lidar and RGB. Recently, however, demand for multisensory systems has increased Amon said, especially using hyperspectral integrations and multispectral cameras. “We are using well proven consumer-grade Sony cameras as well as thermal cameras such as the FLIR Tau 2.” The exact mix depends on the customer’s application.
While Riegl sells lidar sensors for customers to use in their own integrations, it also sells complete systems, especially lidar sensors coupled with Applanix INS/GNSS systems and complete turnkey solutions using the systems combined with a platform such as its RiCopter UAV platform.
“We also offer specialized integration kits for the most common UAV platforms, such as the DJI M600,” Amon said. The company also provides software libraries for self-integration, as well as its own data acquisition and postprocessing software.
PrecisionHawk couples its Riegl lidar scanners with Sony A6000 cameras for a dual RGB collection, enabling the company to generate colorized point clouds.
From Nat Geo to Bigfoot
“We have done all sorts of cool projects, from flying for National Geographic in Mexico to looking for Bigfoot in Oregon,” Cannon recalled.
A project for the largest utility provider in the South that has been ongoing for two years involves collecting hundreds of miles of distribution lines across an entire state, including a complete inventory of all the poles.
“These poles have been put up for 100 years. They get put and up and taken down every other day, due to storms and so forth, so who knows what is out there and how accurate it is? Some of the maps they have are from the 1980s.”
Besides accurately locating the poles, the project involves cataloging the assets on each one, such as AT&T equipment, as well as vegetation encroachment and sagging lines between poles. PrecisionHawk executes an average of 25 flights a day for the project, collecting more than one terabyte of lidar and RGB data each month. The data is analyzed using PrecisionAnalytics software.
Lidar USA recently scanned a remote open pit mine in Montana to assess elevation changes from gravel runoff. “There was no cellphone service, and the closest town was probably an hour away,” recalled McCay. “Even in that environment, it is amazing how well our system can perform. The most challenging aspect was that the mine was between two mountains and there were extremely high winds. At one point, the UAV went sideways. Fortunately, our pilot was very experienced, so he was able to correct for that.”
The National Geographic Society, working with partners at Google and World Resources Institute, is building a living map of the world.
National Geographic is calling on the community of land cover and photo interpretation experts by September to help annotate and curate Sentinel-2 satellite imagery needed by machine learning algorithms. Experts who can spend 20-40 hours on this task in the next 6-8 weeks should send their resumes to [email protected].
“Our vision is to produce the world’s first open global time series map of land cover and land use at 10-meter resolution with annual updates using public satellite imagery,” the society said in a statement.
A living map of the world is a foundational dataset for knowledge products driving understanding and forecasting of the world as a system and enabling data-driven conservation, resource management and policy making for sustainable development.
Simultaneous advances in global satellite imagery, super-computing on demand in commercial cloud, and powerful open source machine learning algorithms in high-performance software frameworks, combine to enable production of a global time series map of land cover and land use at a scale, speed and cost that is within reach for large NGOs and global governments.
The major roadblock to production of a global time series map is availability of a large quantity of high-quality annotated data (hundreds of millions of labeled pixels) required to train algorithms to automate production of the map time series.
National Geographic is aiming to create an initial training dataset of densely annotated tiles of Sentinel-2 imagery before September, following an expert-defined land cover taxonomy. This expert-labeled tile set will be used to train a large non-expert crowd to produce tens of thousands of additional labeled scenes, which will then be used to train the machine learning algorithms that produce maps.
Detailed 3D maps of the iconic and historic Notre Dame Cathedral in Paris hold out hope for accurate reconstruction after it was devastated by a massive fire April 15. Both the ceiling and the spire were destroyed, as well as internal woodwork.
But the information to restore the cathedral is abundant. Besides photos, in 2015 art historian Andrew Tallon used laser scanners to create an immaculately accurate model of the cathedral, as reported in this National Geographic feature.
Laser scans, with their exquisite precision, don’t miss a thing. Mounted on a tripod, the laser beam sweeps around the choir of a cathedral, for example, and measures the distance between the scanner and every point it hits. Each measurement is represented by a colored dot, which cumulatively create a three-dimensional image of the cathedral. “If you’ve done your job properly,” says Tallon, the scan is “accurate to within five millimeters [.5 centimeter].”…
Tallon figured out how to knit the laser scans together to make them manageable and beautiful. Each time he makes a scan, he also takes a spherical panoramic photograph from the same spot that captures the same three-dimensional space. He maps that photograph onto the laser-generated dots of the scan; each dot becomes the color of the pixel in that location in the photograph.
As a result, the stunningly realistic panoramic photographs are amazingly accurate. At Notre Dame, he took scans from more than 50 locations in and around the cathedral—collecting more than one billion points of data.
Assassin’s Creed Unity. Another source comes from a video game company. Immaculate models of the cathedral were collected for the creation of the best-selling “Assassin’s Creed: Unity,” where the hero/player is able to climb both the outside and inside of the massive edifice.
An artist for the Ubisoft game, Caroline Miousse, told The Verge:
In the case of the Notre Dame, easily the biggest structure in the game, it meant recreating a version of the cathedral that didn’t actually exist at the time. Level artist Miousse spent literally years fussing over the details of the building. She pored over photos to get the architecture just right, and worked with texture artists to make sure that each brick was as it should be.
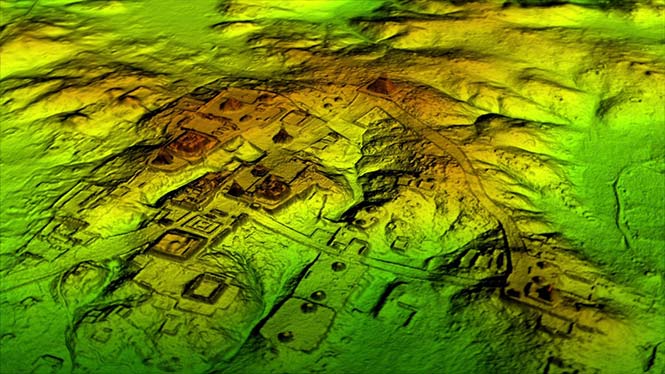
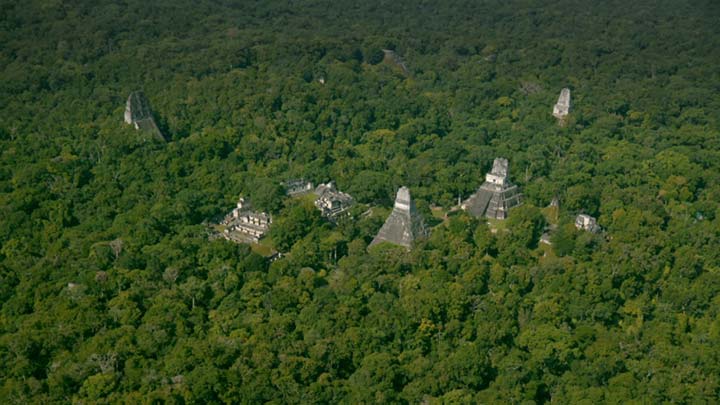
Lidar and UAV technology has revealed hundreds of previously unknown Mayan ruins in the Guatemalan rainforest.
The Optech Titan stripped away overlying vegetation to reveal extensive Mayan ruins in Guatemala’s rainforest. (Image: Teledyne Optech)
In what is considered biggest aerial lidar survey in the history of archaeology, a vast and complex civilization has been discovered.
The University of Houston’s National Center for Airborne Laser Mapping (NCALM) used Teledyne Optech’s Titan sensor to identify raised highways, and complex irrigation and terracing systems.
The jungle of Central America is one of the last great frontiers of archaeology, according to National Geographic, which covered the new finds in a recent documentary, Lost Treasures of The Maya Snake Kings.
After the collapse of the Mayan civilization, its cities and monuments were quickly covered by thick rainforest, hiding it from airborne observation and making it very difficult to survey on foot. Over decades of work, the ancient civilization has gradually been revealed. But now technology is set to change everything.
Lidar digitally removes the forest canopy to reveal ancient ruins below, showing that Maya cities such as Tikal were much larger than ground-based research had suggested. (Photo: National Geographic)
Flying high above the rainforest, the Titan’s lasers penetrated the canopy to collect almost a million data points per second from the forest floor, giving archaeologists a “bare earth” view of the structures underneath.
Having covered 2,100 square kilometers, the Titan’s data revealed massive amounts of ruins hidden below the forest, showing that their urban centers were significantly larger than archaeologists had previously thought.
“Lidar is revolutionising archaeology the way the Hubble Space Telescope revolutionised astronomy,” Francisco Estrada-Belli, a Tulane University archaeologist, told National Geographic. “We’ll need 100 years to go through all [the data] and really understand what we’re seeing.”
(Image: Teledyne Optech)
“We are incredibly proud and excited that our award winning Titan multispectral lidar sensor has contributed to this spectacular discovery,” said Michel Stanier, EVP and general manager of Teledyne Optech. “The Titan’s ability to strip away overlying vegetation and map wide areas very quickly and accurately makes it an important tool for archaeologists, and we expect to see many more discoveries coming from it and our other airborne laser terrain mappers.”
The Optech Titan multi-spectral lidar sensor incorporates three independent laser wavelengths into a single sensor design, with beams at 532, 1064 and 1550 nanometers (0.5/1.0/1.5 microns) and a ground sampling rate of 300 kHz per beam.
Because Titan uses both green and infrared channels, it is capable of simultaneous water-depth mapping and high-precision 900-kHz topography.
Titan can also be used for purposes such as vegetative and forestry applications, which require multiple wavelengths for improved classification accuracy and carbon credit counting initiatives.
Lidar and UAV technology has revealed hundreds of previously unknown Mayan ruins in the Guatemalan rainforest.
The Optech Titan stripped away overlying vegetation to reveal extensive Mayan ruins in Guatemala’s rainforest. (Image: Teledyne Optech)
In what is considered biggest aerial lidar survey in the history of archaeology, a vast and complex civilization has been discovered.
The University of Houston’s National Center for Airborne Laser Mapping (NCALM) used Teledyne Optech’s Titan sensor to identify raised highways, and complex irrigation and terracing systems.
The jungle of Central America is one of the last great frontiers of archaeology, according to National Geographic, which covered the new finds in a recent documentary, Lost Treasures of The Maya Snake Kings.
After the collapse of the Mayan civilization, its cities and monuments were quickly covered by thick rainforest, hiding it from airborne observation and making it very difficult to survey on foot. Over decades of work, the ancient civilization has gradually been revealed. But now technology is set to change everything.
Lidar digitally removes the forest canopy to reveal ancient ruins below, showing that Maya cities such as Tikal were much larger than ground-based research had suggested. (Photo: National Geographic)
Flying high above the rainforest, the Titan’s lasers penetrated the canopy to collect almost a million data points per second from the forest floor, giving archaeologists a “bare earth” view of the structures underneath.
Having covered 2,100 square kilometers, the Titan’s data revealed massive amounts of ruins hidden below the forest, showing that their urban centers were significantly larger than archaeologists had previously thought.
“Lidar is revolutionising archaeology the way the Hubble Space Telescope revolutionised astronomy,” Francisco Estrada-Belli, a Tulane University archaeologist, told National Geographic. “We’ll need 100 years to go through all [the data] and really understand what we’re seeing.”
(Image: Teledyne Optech)
“We are incredibly proud and excited that our award winning Titan multispectral lidar sensor has contributed to this spectacular discovery,” said Michel Stanier, EVP and general manager of Teledyne Optech. “The Titan’s ability to strip away overlying vegetation and map wide areas very quickly and accurately makes it an important tool for archaeologists, and we expect to see many more discoveries coming from it and our other airborne laser terrain mappers.”
The Optech Titan multi-spectral lidar sensor incorporates three independent laser wavelengths into a single sensor design, with beams at 532, 1064 and 1550 nanometers (0.5/1.0/1.5 microns) and a ground sampling rate of 300 kHz per beam.
Image: Teledyne Optech
Because Titan uses both green and infrared channels, it is capable of simultaneous water-depth mapping and high-precision 900-kHz topography.
Titan can also be used for purposes such as vegetative and forestry applications, which require multiple wavelengths for improved classification accuracy and carbon credit counting initiatives.
National Geographic Mapshas joined with Avenza Systems to offer a new channel to access its map content. The alliance enhances Avenza’s digital map database by adding more than 500 maps from National Geographic and furthers National Geographic Maps’ established reach with mobile consumers.
The Avenza PDF Maps app takes advantage of geospatial technology and allows users to view, acquire and interact with maps on their mobile devices, including iPhone and iPad, without needing a mobile data connection or being accessed international roaming charges. PDF Maps offers an in-app store to facilitate the transaction and delivery of the maps, consolidating, in a digital format, consumers’ access to hundreds of maps from multiple publishers.
“In the last decade, advances in technology have shifted how consumers receive and use information, and we have responded by making our rich map content available on a variety of platforms,” said Charles Regan of National Geographic Maps. “Avenza’s PDF Maps app provides a unique way for consumers to access our content with an easy-to-use in-app map store and a set of robust features that will enhance the map user’s experience.”
Hundreds of maps from National Geographic Maps’ extensive library are now available in Avenza’s PDF Maps system, including travel and destination titles covering five continents, historical and thematic maps, and educational and reference titles. The app provides constant access to geographic information and points of interest, with additional interactive tools such as measuring, place marking and location tagging. PDF Maps operates without the risk of lost reception, due to cell tower proximity, and does not rely on an Internet connection.