Using data from satellites to predict and resond to climate-related disasters is considered in a new white paper.
The EU Agency for the Space Programme (EUSPA) and the European Insurance and Occupational Pensions Authority (EIOPA) published the joint white paper.
It explores how Earth observation (EO) data could be harnessed to enhance the supervision of natural catastrophes and assess the impact of extreme weather events on Europe’s insurance sector.
As Europe faces escalating climate-related disasters and rising economic losses related to them, the need for more effective risk management and greater resilience against natural catastrophes is paramount — not least through the deployment of innovative solutions.
The white paper is the result of a joint pilot project between EIOPA and EUSPA — highlights the benefits of using open-access Earth observation data from Copernicus to improve the tracking and management of natural hazards.
The project demonstrates that satellite-based EO data offers independent, objective and near real-time geospatial insights that can meaningfully improve risk assessment and risk management practices for insurers, communities and supervisors.
Earth observation technology — especially the open, traceable data that Copernicus provides — can sharpen risk identification, reinforce scenario design and accelerate loss estimates in the aftermath of shocks. Financial supervisors can leverage the technology to:
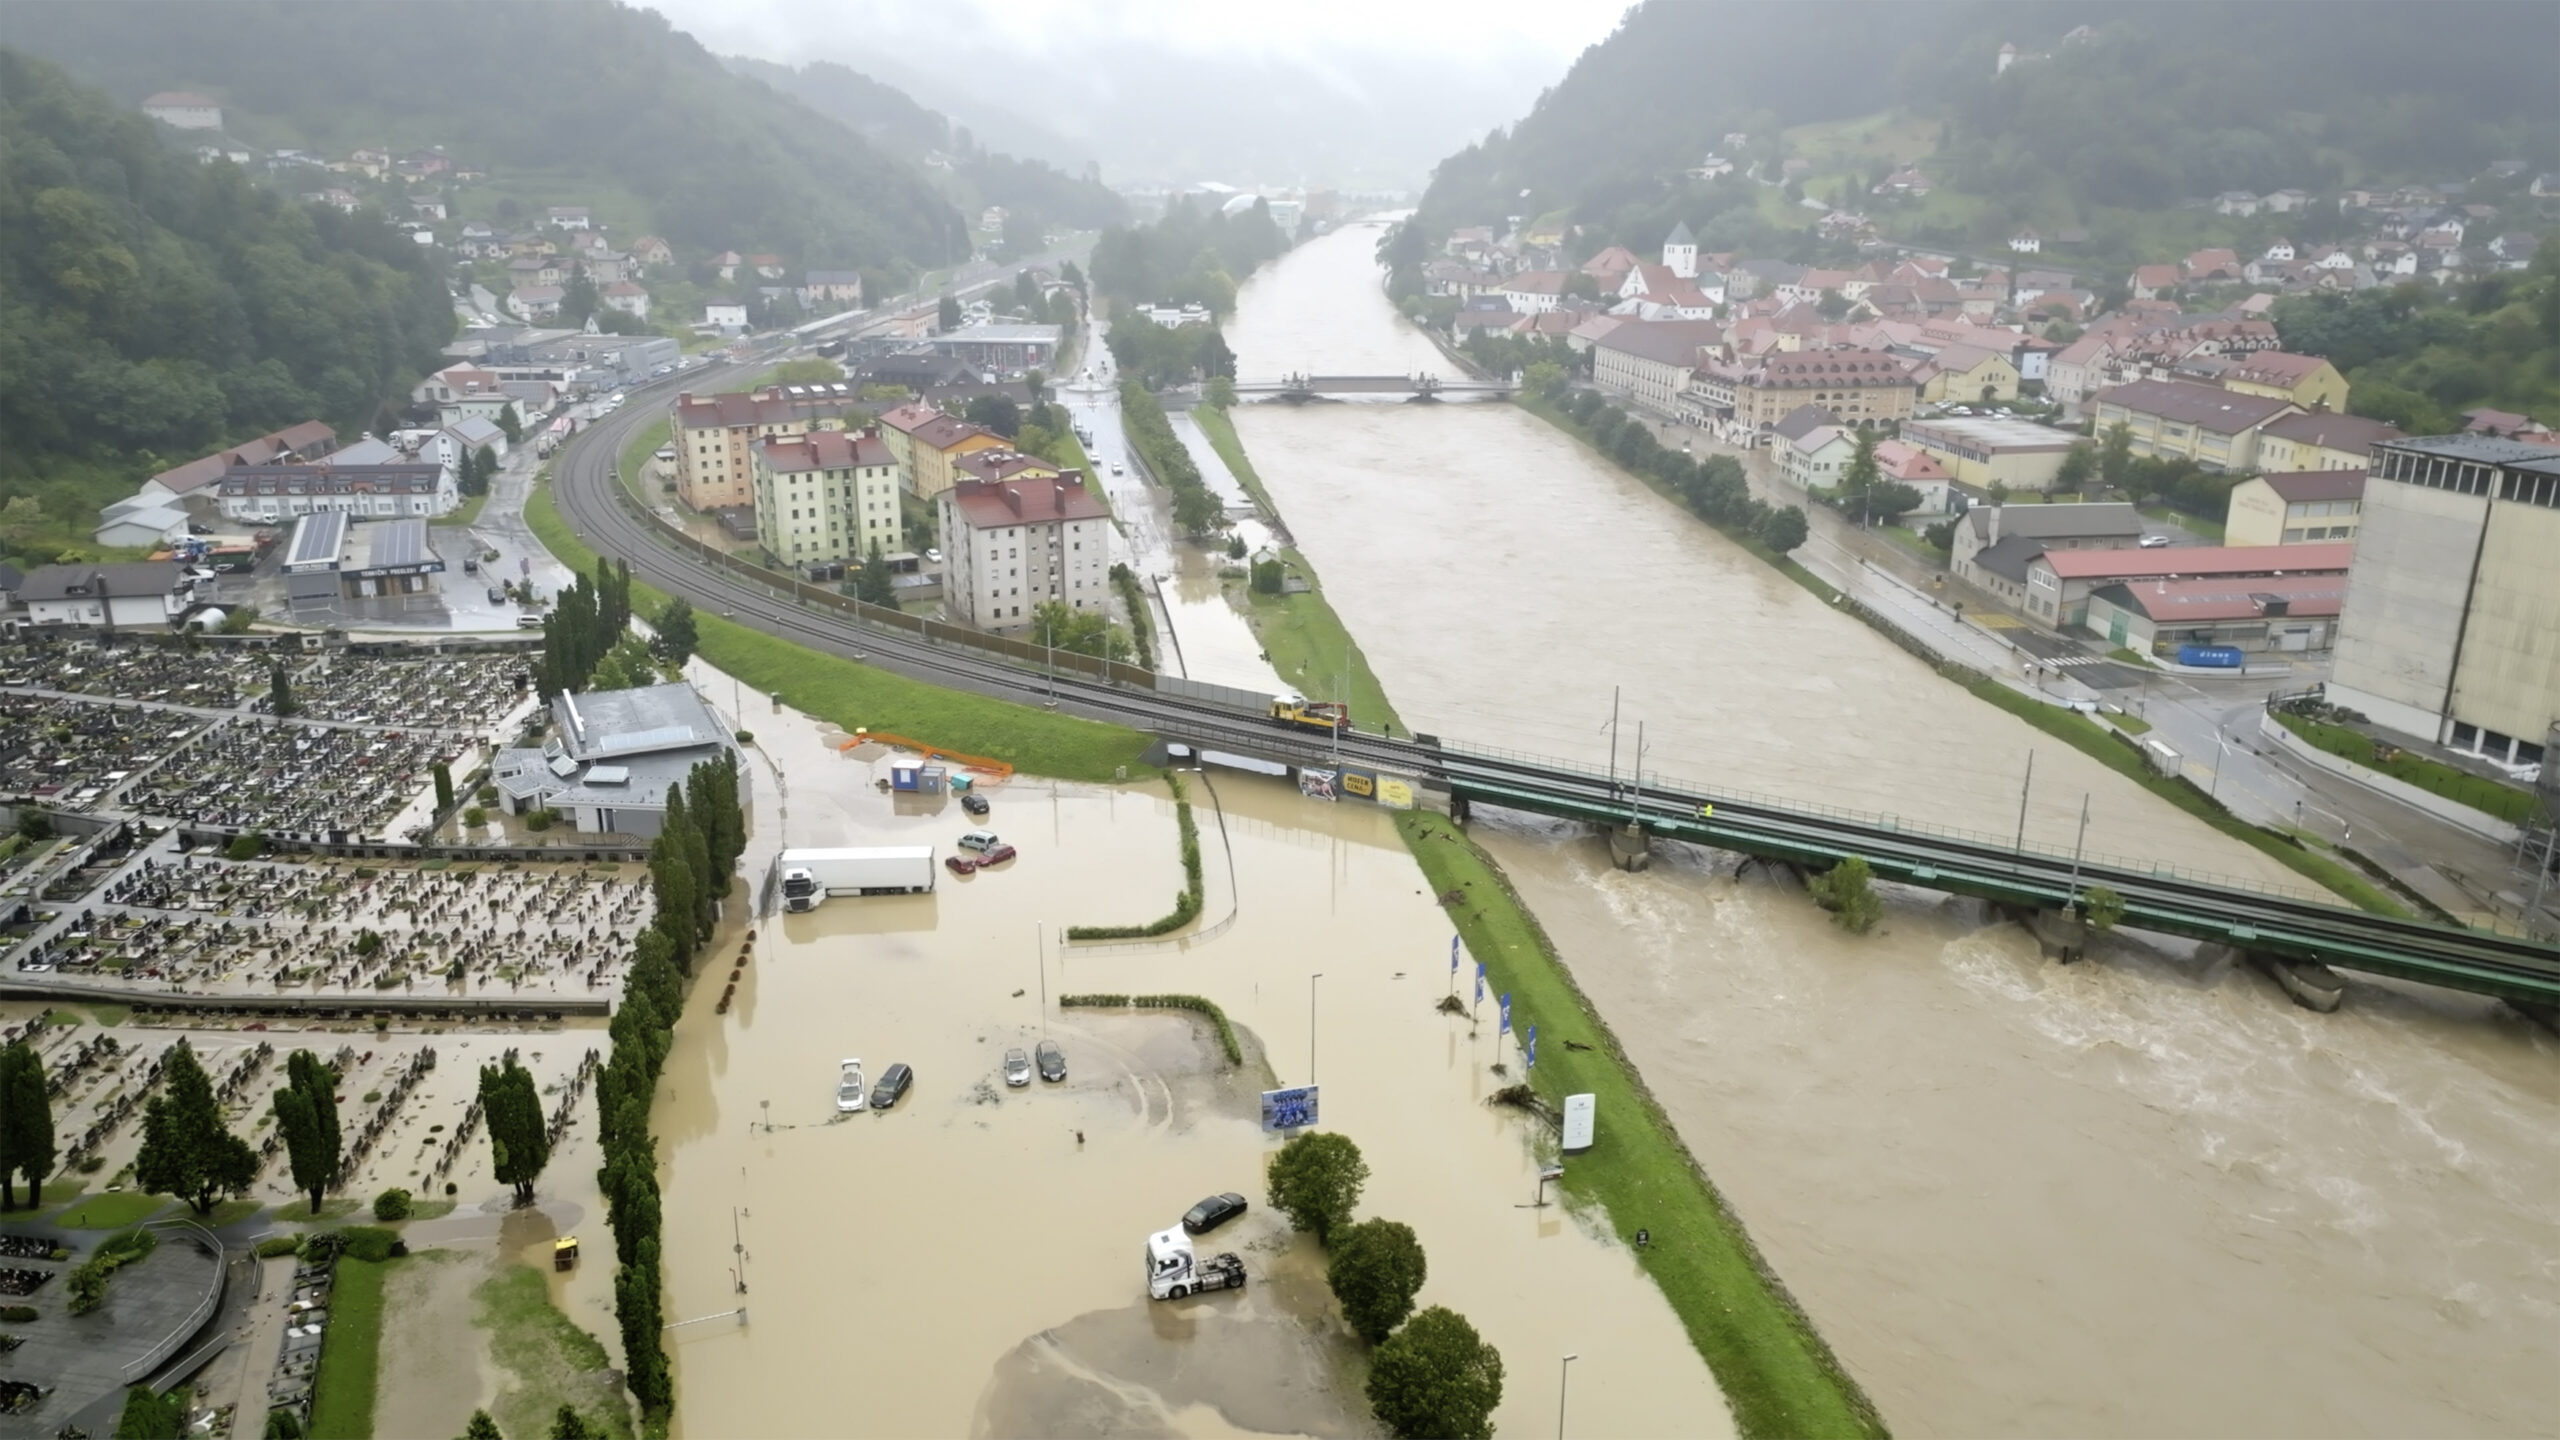
rapidly identify affected areas and exposed insurance undertakings: Satellite imagery makes it possible to map disaster-affected areas (for example, the extent and trajectory of floods) as events unfold. This granular geospatial data can be matched with Solvency II regulatory reporting to estimate the potential impact of natural catastrophe events on individual insurers (micro-prudential perspective);
estimate overall loss-magnitudes early on by scaling up the micro-level analysis to the sector as a whole (macro-level perspective); and
improve benchmarking, model validation and scenario and stress test design by providing objective, data-driven reference points against which model outputs and reported or calculated losses can be compared.
The collaboration between EIOPA and EUSPA showcases the value of innovation in addressing the challenges posed by climate-related disasters: when used effectively, Earth observation data can contribute to a more resilient and sustainable insurance sector — one that better protects European citizens and businesses from the damaging effects of a warming climate.
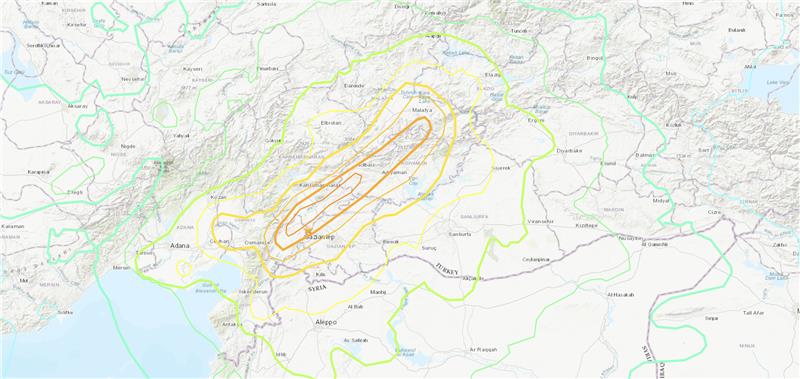
Three earthquakes of magnitude 6 or larger have occurred in Turkiye and northern Syria since 1970. The largest was a magnitude 6.7 earthquake in January 2020. (Credit: USGS)
On Feb. 6, a magnitude 7.8 earthquake struck Turkiye and northern Syria collapsing buildings and killing more than 2,000 people, followed by magnitude 6.7 aftershocks. The impact of the earthquakes was significant and ranks in the red for economic losses and orange for fatalities, according to the United States Geological Survey (USGS).
The USGS reports the earthquake resulted from strike-slip faulting at shallow depths. It appears to be associated with either the East Anatolia fault zone or the Dead Sea transform fault zone.
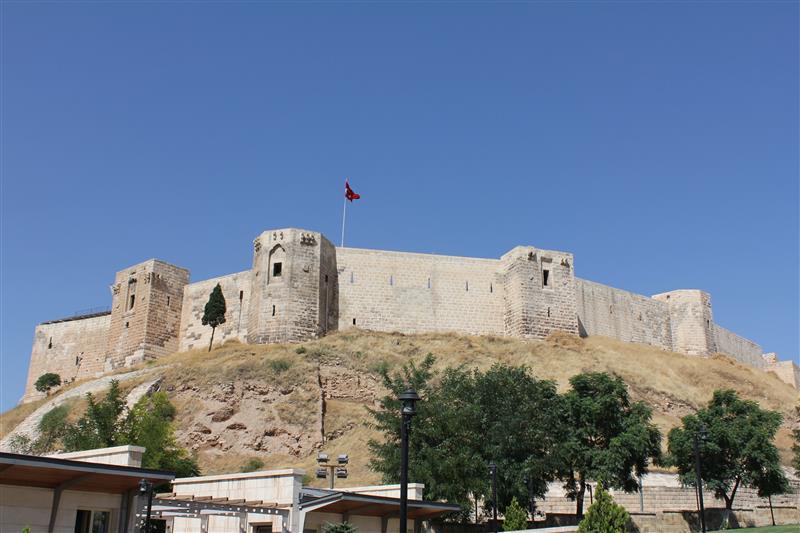
Historical buildings throughout Turkey have been severely damaged, including the Yeni Mosque and the Gaziantep Castle, which date back thousands of years.
War-torn Syria — specifically Aleppo, Hama and Latakia — have also sustained severe damage to infrastructure that was already fragile.
The effects of this earthquake were felt as far as Lebanon and Israel.
Parts of the historic Gaziantep Castle collapsed, as it lies close to epicenter of the magnitude 7.8 earthquake. (Image: JudyDillon/ iStock / Getty Images Plus/Getty Images)
Historical Gaziantep Castle’s east, south and southeast bastions collapse, leaving debris scattered on the road after major 7.4-magnitude earthquake struck Türkiye’s southeasthttps://t.co/5j2soYI6hCpic.twitter.com/1n6whCr2gY
No, this is not a drill or a major motion picture event.
During my lifetime, many natural disasters that have taken place around the globe. These unfortunate events have created mass destruction and caused many deaths by a variety of environmental elements, ranging from earthquakes and volcanic eruptions to hurricanes and snowstorms.
Disasters in the United States. (Image: FEMA)
Once Mother Nature decides to unleash her wrath, rarely anything stands in her way. Some types of disasters create situations worse than others, but all have a reputation of leaving a trail of death and destruction.
Search and rescue is the first and foremost priority when it comes to these disasters, with cleanup and rebuilding to soon follow.
The role of the land surveyor, however, doesn’t usually enter the discussion when it comes to these situations. It has always been considered an occupation that fills an important role in development, construction and parcel ownership, but rarely is discussed in the same terms as a fireman, policeman or doctor.
We will take a closer examination at how the surveyor uses skills developed through education, technical training and practical application of geographical data to quietly assist those in need through these difficult bouts with Mother Nature.
First, however, we will discuss various types of the deadliest natural disasters, the amount of destruction that has been caused and types of problems (besides deaths) that were left because of these tragedies.
Disasters throughout history
When describing natural disasters, the obvious ones come to mind: earthquake, hurricane/typhoon/cyclone, tornado, wildfire, flooding/monsoon, drought/famine, volcanic eruption, tsunami, sandstorm, avalanche, and snowstorm.
All of these have wreaked havoc on mankind for centuries, with more physical destruction taking place in the past few centuries.
Some of the factors leading to an increase in this devastation are gains overall population and amount of buildings and improvements in populated areas. Let’s look at how each disaster impacts the areas in which it occurs:
Flooding/Monsoon
Historically the deadliest type of natural disaster, rainfall through storms and monsoons cause flood events that have caused millions of deaths in several instances around the world. Most of the deaths caused by flooding situations are due to drowning in floodwaters that inundate areas not normally affected by normal amounts of rain.
The largest flood in recorded history took place in China during 1931, combining melting snow and ice with ongoing rain events to create a continuous flooding event that lasted most of the year. Death toll estimates range from 400,000 to almost 4 million, as many of the victims either died or moved to other regions with no trace.
Hurricane/Typhoon/Cyclone
This is another type of flooding disaster, but it combines large amounts of rain gathered from ocean storms with high winds to batter shoreline and inland areas. These storms can often stall in place, causing significant damage by both wind and rain.
Tornado
Most weather systems associated with creating tornadoes are believed to occur in the United States, but they happen all over the world. Many of the deadliest tornadoes have taken place in the Middle East, including Bangladesh, Russia and Pakistan. These storms can include torrential rain, but most of the damage caused by tornadoes is wind-related.
Earthquake
Shifting tectonic plates and earth-shaking tremors are a significant cause of damage and deaths throughout the world. Most of the highest death tolls have taken place in Asia, with the biggest loss of life occurring in Shaanxi, China, on Jan. 23, 1556, with more than 830,000 deaths.
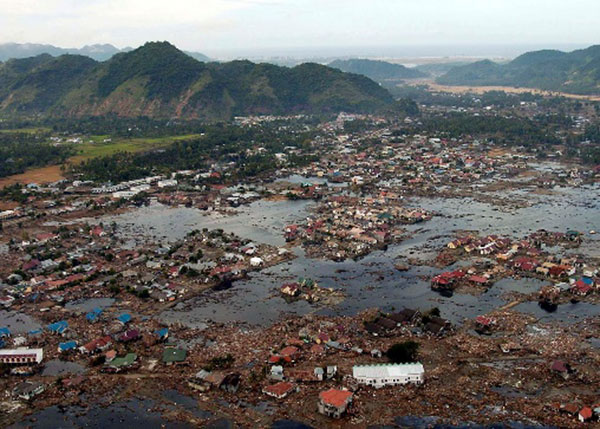
Indian Ocean (Jan. 2, 2005): A village near the coast of Sumatra lays in ruin after the Tsunami that struck South East Asia. (Photo: U.S. Navy/Photographer’s Mate 2nd Class Philip A. McDaniel)
Tsunami
Often a secondary disaster generally associated with earthquakes in coastal areas, tsunamis kill thousands by inundating shorelines with huge waves and sending vast amounts of water into low-lying areas and poorly constructed seaside villages. The largest tsunami in recent memory was on Dec. 26, 2004, in the Indian Ocean off the coast of Indonesia, with the death toll reaching 280,000 people.
Volcano
The biggest cause of earthquakes is typically molten lava expanding to shift tectonic plates, but volcanoes are formed with the lava and associated gases finding an escape in the Earth’s crust.
Once a volcano has formed, an eruption can lead to significant damage from lava flow onto adjacent land and hot ash spewed into the atmosphere. Many volcanic eruptions throughout history have buried local cities and villages, making them virtually disappear.
Wildfire
Grabbing the headlines more recently has been the proliferation of wildfires. While not causing the substantial loss-of-life associated with many other natural disasters, wildfires are responsible for scorching hundreds of thousands of acres of forest and brush areas, as well as decimating neighborhoods.
Avalanche
This disaster only takes place in locations with significant snow pack and elevation changes. After large amounts of snowfall, various factors lead to movement of large areas of snow and ice down mountainous slopes. Often these events take place near cities and villages in mountainous regions and can leave the inhabitants buried and unreachable.
Other Types of Natural Disasters
While the varieties of events listed above can create large-scale destruction, there are others that, while smaller in nature, can collectively cause great damage and loss of life. Thunderstorms, snowstorms and sandstorms are wind-related and can be devastating to the areas being affected.
Other natural disasters that often don’t get the same recognition as those listed above include drought and famine. These environmental tragedies ruin thousands of lives, and it take years to recover from the damage caused by these inflictions.
Disaster hits. Now what?
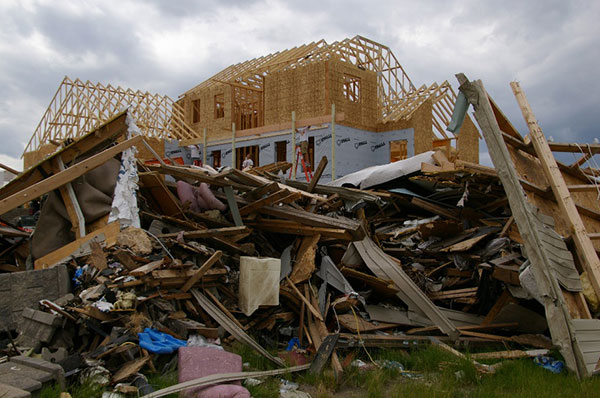
June 28, 2008: A house in Parkersburg, Iowa, is being rebuilt while debris from a deadly EF5 tornado still covers the ground. (Photo: FEMA/Richard O’Reilly)
All of these disaster types have led to a great number of fatalities and total devastation of cities and roadways. To help us understand what type of assistance the surveyor can provide, we first need to identify the conditions left by each of these events.
Most of the disasters simply wipe out whatever is in its path; from tornadoes, hurricanes, and wildfires to earthquakes, avalanches and tsunamis, the regions affected are left in shambles after the occurrence.
The initial search and rescue through the rubble takes manpower and careful identification of areas where people are known to inhabit, either as residences, places of employment or public spaces. These areas require retracement of existing mapping and atlases to accurately identify those places for timely recovery.
Once the search-and-rescue efforts have ceased and cleanup/rebuilding commences, the destroyed areas will need to be remapped based upon existing parcels and ownership rights. Reconciliation of existing parcels, subdivisions and rights-of-way will be required to properly return the injured areas to a habitable state.
The one disaster that’s a big wildcard, however, is the earthquake. The devastation is like the others and generally will need rebuilding like the others, but with one large difference; putting everything back where it belongs.
When large tremors cause significant shifts in inhabited and/or complex parcels, the ability to retrace existing parcels, subdivisions and rights-of-way to place them in their original location becomes a nightmare.
How surveyors and GNSS help before and after disasters
As expert measurers and establishers of boundaries, the surveyor provides guidance for the creation of parcels and rights-of-way. Through extensive education, training and experience, the surveyor combines field reconnaissance, legal definitions of parcels and high-level mathematics to provide direction for the creation and retracement of real property.
After experiencing a devastating event like the ones described above, the surveyor becomes a key position in rebuilding the affected area.
Prior to the invention and proliferation of GNSS technology, however, the use of state plane coordinate data was a tedious and time-consuming task (see my January 2017 article at GPS World).
Establishing coordinate values across a large region and/or utility system was not practical from a time or cost viewpoint. The arrival of GNSS technology in the 1990s changed that situation with the ability to determine coordinate values in real-time and create large databases of infrastructure and utility information. Government agencies (and surveyors) now could replicate, with acceptable accuracy and precision, locations of improvements and utilities throughout their jurisdiction.
Surveyors are now being called upon to assist with search and rescue efforts when these disasters hit to help locate and turn off existing utilities (i.e. electricity, gas, water), and to provide mapping assistance for retracing where people may be in the rubble. Because lives are at stake, timely location is essential for these services and GNSS technology use by the surveyor provides a much-needed service.
Once these disaster events being a rebuilding mode, the surveyor steps in to find the existing parcel and right-of-way lines to assist the respective owners where a deed or roadway was previously located. Most times, the surveyor can retrace existing line by locating buried monuments and recreating existing deed descriptions and/or roadway locations.
Where there becomes a problem is when the devastation is large enough to destroy all existing monuments and leave no trace of any occupied land. The surveyor must expand the search area, as far as needed, to find the closest available monuments in which to begin rebuilding the parcel descriptions.
Depending on the site conditions, GNSS equipment is used to locate the positions of the nearest monuments so the surveyor can perform retracement calculations for the disturbed area.
Once the area to be re-established to calculated, the surveyor can return to the site and place markers signifying parcels and rights-of-way for the rebuilding of roads, utilities and buildings. GNSS receivers are again utilized to increase the proficiency of the field crew by allowing the installation of the markers over a large area in a short amount of time.
How surveyors can prepare for future events
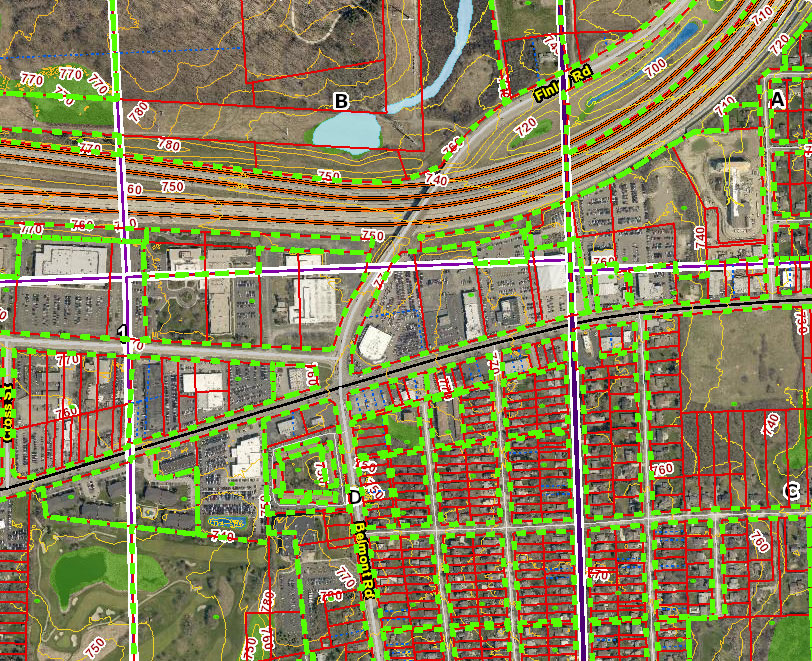
Image: DuPage County, Illinois, GIS
As previously written in my January 2017 column, GNSS technology has helped expand geographic information systems (GIS) into a database beast, containing everything from voter districts, zoning regions and floodplain maps to locations of most municipal utility maps and databases.
When these databases have included a geodetic layer of survey information overseen by the licensed land surveyor, the GIS is now more than a glorified digital Etch-A-Sketch. These entities within the database have geolocation as part of its dataset, with varying accuracy depending on the source of the data.
By having all this information available in a digital format, typically saved in a cloud-computing location, the ability to replicate these entities becomes a simple exercise. As more information becomes available, it needs to be included into the database for future mapping consideration.
All relevant data, together with a geolocation tag, becomes valuable for future retracement. This information could be used to locate possible survivors during a disaster event.
Upcoming technology to assist surveyors with disaster relief planning
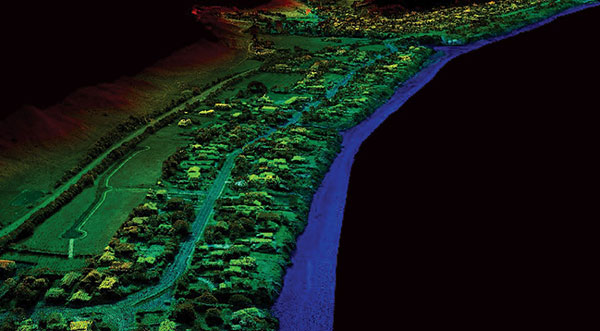
Image: Esri
Many of the tools being utilized by surveyors have the capability of helping with mapping and data collection of municipal and public facilities for GIS database inclusion.
We currently use laser and lidar scanners both terrestrially and aerially to collect point-cloud data for establishing existing conditions of various sites. This point cloud, along with high-resolution photography, can be used to augment and enhance new and existing GIS databases with extensive datasets.
By having this additional information collected and available digitally, qualified experts can perform disaster simulation tests to depict various environmental events and determine what strategies will be necessary for search-and-rescue efforts.
These experts can also use this data to predict potential flood paths, conduct seismic modeling to determine building shift, and combine weather conditions with conceivable wildfire-capable areas. All these potential life-saving exercises can utilize the surveyor as a significant data-collection source.
Coming to a theater near you…
Whether one believes in climate change or just being affected by an active environmental cycle of natural disasters, the entire world is prone to have an occurrence of at least one of these events.
Since these events are not going away, remember to help your fellow man, woman or child in their time of need. It is the duty of the surveyor to provide a service that is intended to protect the public, and being there for disaster planning, prevention and recovery is part of our mission.
Think of us like the Avengers; now there’s a sequel I’d pay to see.
A team of five volunteers armed with drones, advanced sensor systems and GIS technologies joined the response effort at Kilauea Volcano Lower East Rift Zone to assist in tracking and predicting the ongoing volcanic eruption.
Using small unmanned aerial systems (sUAS) together with air-quality sensors, advanced imaging tools and Esri’s spatial analytics and mapping, the team from the Center for Robot-Assisted Search and Rescue (CRASAR) provided real-time aerial views of the eruption.
The CRASAR team identified a new fissure not visible from the ground, projected the lava flow rate during the night when manned helicopters were not allowed to fly, and provided ongoing data collection from new thermal sensors technology.
The CRASAR response marks the first known use of sUAS for emergency response to a volcanic eruption and first known use of sUAS for sampling air quality. The CRASAR team provided Hilo Fire Department and the Civil Defense with live streaming of video from the sUAS over the new FirstNet cellular network.
“This latest CRASAR mission is another example of dedicated volunteers working together with private sector partners to deploy technology to save lives and property when disaster strikes,” said CRASAR Director and disaster robotics expert Robin Murphy. “With support from technology partners like Esri, Hangar Technologies, RemoteGeo and RMUS, we are able to both respond to active disasters but also demonstrate to the first responder community best practices and benefits of engaging robots and other technologies in disaster response.”
CRASAR supported tactical response operations at the Leilani, Hawaii, eruption event May 14-19, supplementing the University of Hawaii Hilo’s (UHH) sUAS capabilities and allowing UHH sUAS operators to focus on geographical and volcanology.
During the six-day Leilani deployment, the CRASAR team flew 44 sUAS flights, including 16 at night, using DJI 200, 210, Inspire, and Mavic Pro drones.
Esri’s Drone2Map for ArcGIS together with Hangar’s Enterprise Platform for 360-degree imaging enabled rapid 360-imaging for situational awareness.
Video and data were shared with local first responders using FirstNet, the first high-speed, nationwide wireless broadband network dedicated to public safety.
The CRASAR response team included sUAS pilots Justin Adams of Constellation Consulting Group, David Merrick and Laura Hart of Florida State University Center for Disaster Risk Policy, Jon McBride of Rocky Mountain Unmanned Systems, and Robin Murphy of Texas A&M University. Funding was provided in part through research grants from an insurance partner and the National Science Foundation.
“This eruption is especially impactful because of its location,” said Esri’s Public Safety Lead, Ryan Lanclos. “That makes the CRASAR’s use of drones and mapping technologies, and the near real-time situational awareness it provides of people, homes, businesses and infrastructure during this disaster, a resource first responders will be able to turn to time and again.”
CRASAR’s deployment to Hawaii marked a number of firsts for technology applied to disaster response. To interact with the same GIS mapping and imaging technologies responders used on the scene at Kilauea Volcano Lower East Rift Zone, visit this page.
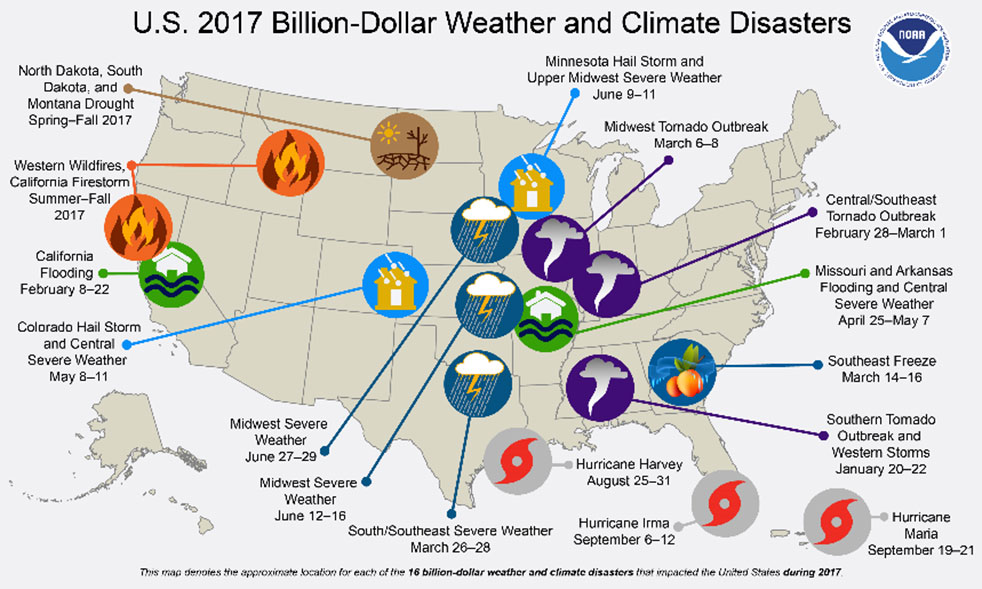
Here in the U.S., this past summer saw an unprecedented number of emergency situations. Hurricanes blasted Texas, Florida, the U.S. Virgin Islands and Puerto Rico, leaving people stranded and without power, while wildfires ravaged the west.
So far this year, 15 separate weather and climate disasters have each caused at least $1 billion in damages in the U.S., according to the National Oceanic and Atmospheric Administration (NOAA), meaning, 2017 could tie 2011 for the most billion-dollar disasters. The USA Today chart shows those events.
In Oregon where I live, we experienced unprecendented smoky skies from wildfires — the hazardous air quality affected the health of many.
The silver lining? Growing expertise in the fields of disaster response, mapping, location awareness, UAVs and imagery. We continue to improve our ability to respond to disasters, such as with Waze traffic alerts for wildfire evacuations and UAVs that bring a virtual doctor to a crisis scene along with medicine. We use state-of-the-art technology to learn more about how, why and when disasters happen with tools such as UAVs that penetrate the mysteries of active hurricanes.
CoreLogic, a residential property information, analytics and data-enabled services provider, today released an expanded version of its natural catastrophe risk management solution, which features a new comprehensive probabilistic flood model that analyzes the potential damage and financial impact at the property-level from flood events in the continental United States.
This probabilistic flood model is unique to the industry because its riverine and flash flood risk components provide better risk estimation for areas outside the 100-year flood zones–areas responsible for 20 percent of historic flood losses but which represent only 1 percent of the flood insurance policies in force.
Measuring both severity and frequency of flood events, the probabilistic flood model loss calculations offer property, contents and business interruption analysis. The model also incorporates historical flood event footprints from the last 50 years and the accompanying property damage.
Additionally, the model incorporates detailed user-provided building information to derive vulnerability assessments driven by both water depth and water velocity. These building characteristics include construction type, occupancy, floor elevation, basements and elevated building configurations. The new CoreLogic flood model provides insurers with an unprecedented tool to more accurately underwrite the risk associated with this complex peril, especially the proprietary flash flood component.
With granular 10-meter elevation data, the catastrophe risk management solution incorporates the Digital Flood Insurance Rate Maps (DFIRMs) provided by the Federal Emergency Management Association (FEMA). It uses more than 80 different occupancy classes covering topography, land-use, stream coverage and inundation. In order to more accurately measure a property’s flood risk, more than 50 data layers ranging from elevation, hydrologic and catchment information are included, as well as data for over 6 million miles of streams and 20,000 stream flow gauges.
“The release of the U.S. Inland Flood Model means insurers can now use this advanced probabilistic tool to help them determine a property’s potential for flood damage,” said Tom Larsen, CoreLogic product architect. “The model’s unique ability to provide granularity down to the property level will offer insurers a complete view of flood risk, including contents and business interruption, for all types of properties.”
The catastrophe risk management solution contains parcel-level geocoding through PxPoint from CoreLogic, which can convert physical addresses or locations into precise geographic coordinates for over 142 million parcel boundaries. A new visualization feature identifies details in the data as well as exceptions via easy-to-use charts and graphics. Other new components include updates to three risk assessment models including Italy Earthquake, the North Atlantic Hurricane Risk and U.S. Offshore Energy.
Highlights include:
The Italy Earthquake Model now incorporates an updated seismic source model based on the Seismic Hazard Harmonization in Europe (SHARE) to provide a current and more accurate view of seismic hazard in Italy. Increased maximum magnitudes, an updated magnitude-frequency distribution and a new ground motion model are part of the enhancements.
The North Atlantic Hurricane Risk Model update includes a high-resolution storm surge model and enhanced hazard risk assessment to more accurately capture the damage from storm surge as the surge attenuates inland (outside of the high velocity zones). It uses storm intensities from historical events based on the Atlantic hurricane reanalysis project by the National Oceanic and Atmospheric Administration (NOAA). Additionally, the North Atlantic Hurricane Risk Model includes a full set of default secondary structural modifiers by vintage and location for all hurricane states, which are based on the International Building Code as well as state-specific building codes to provide refined results. RQE 16 also includes a model version which was certified by the Florida Commission Hurricane for Loss Projection Methodology in June 2015.
The U.S. Offshore Energy Model features a distinctive wave model component and unique financial model which produces an improved estimate of potential damage to physical assets in U.S. territorial waters within the Gulf of Mexico. A network analysis is also built into the model to produce a better estimate of the lost production from oil wells.
“All of these enhancements will help insurers understand hazard risk in a more granular and comprehensive way, and this precision in risk modeling will help the industry overall fine-tune its underwriting, claims and reinsurance efforts,” Larsen said.