Tag: Ohio State University

  • California Spatial Reference Center (CSRC) 2023 Spring Meeting

    California Spatial Reference Center (CSRC) 2023 Spring Meeting

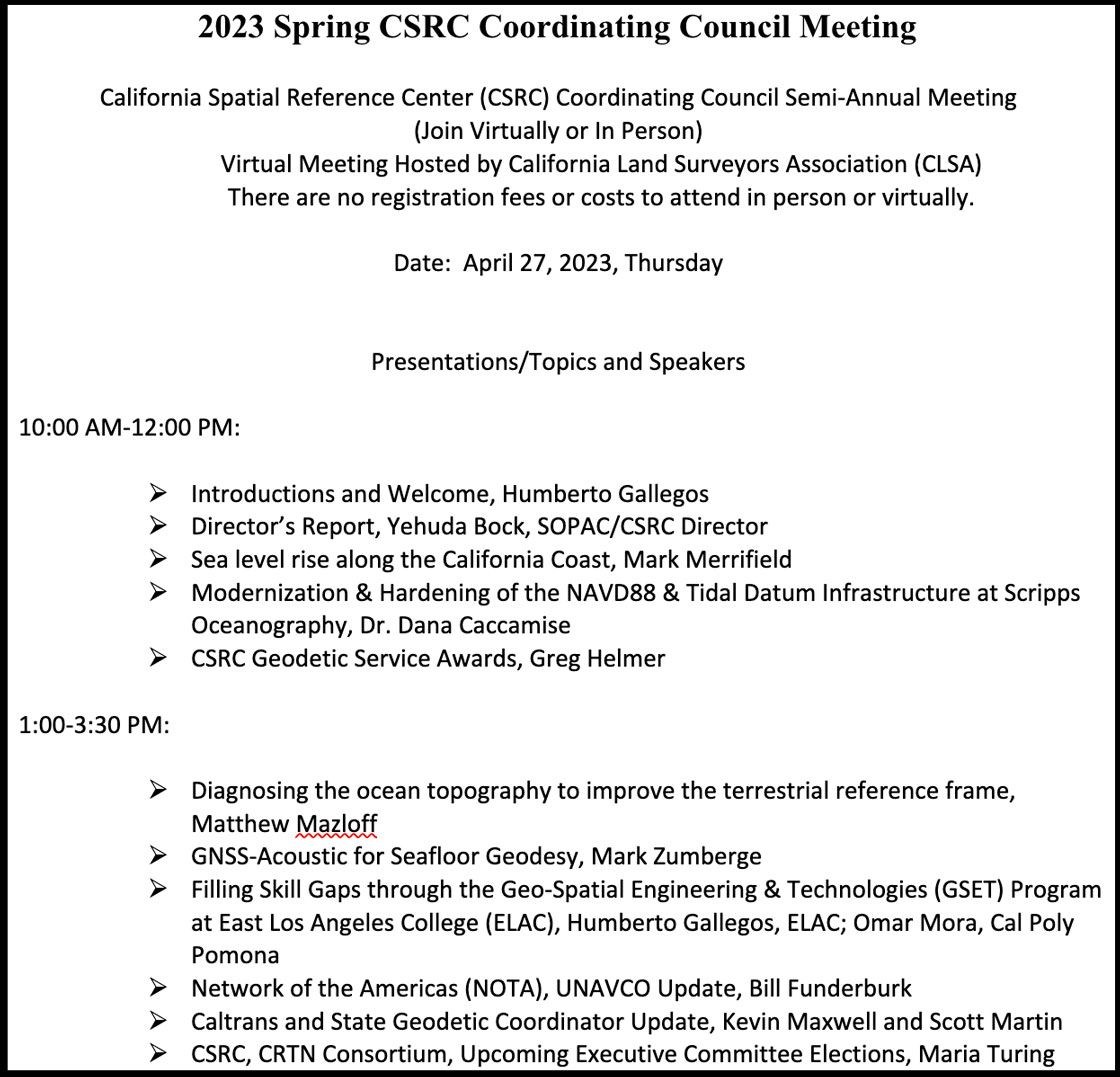
    On April 27, I attended (virtually) the spring 2023 meeting of the California Spatial Reference Center (CSRC) coordinating council. See the agenda below. This column will highlight some activities with which the CSRS is involved and how it’s advancing the science of geodesy. Anyone who has been following my latest columns knows that I am an advocate for any person or organization that promotes the advancement of geodesy and recognizes that the United States is experiencing a geodetic crisis.

    First, I would like to state that Yehuda Bock, the director of CSRS, has been instrumental in advancing accurate geodetic positioning for as long as I have known him. I first met Bock in 1978 while I was attending the Ohio State University.

    A video of the meeting is available from the CSRC here.

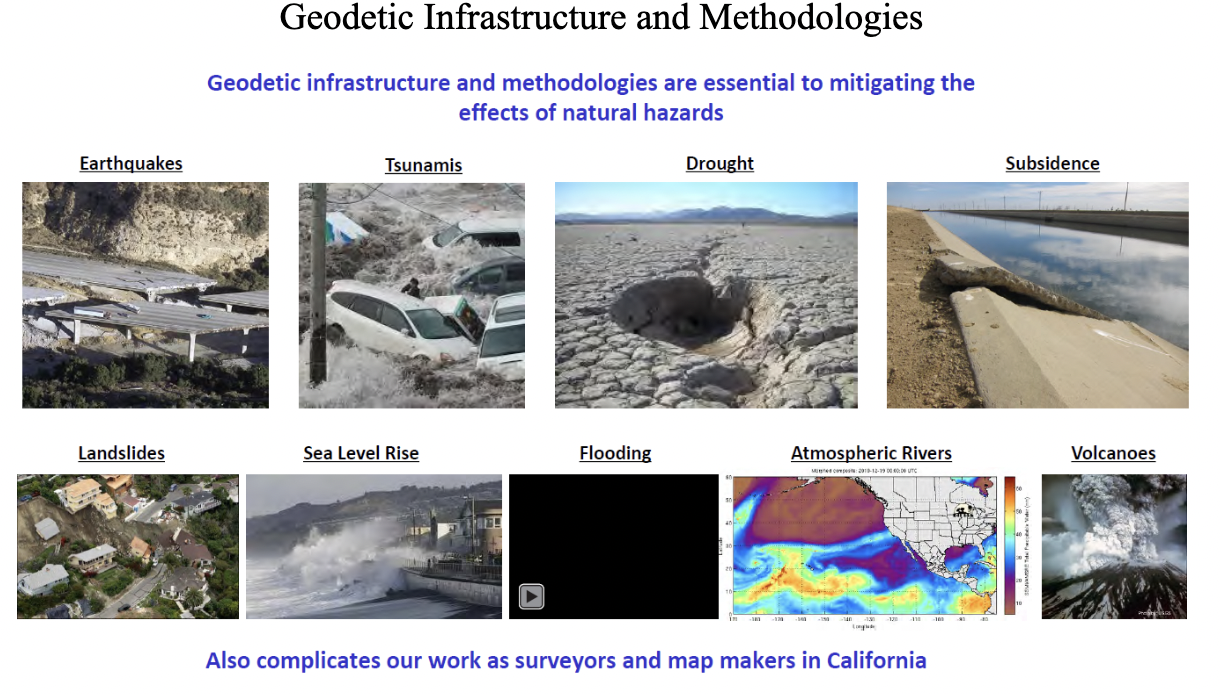
    During the meeting, Bock presented the director’s report. He started with mentioning how geodetic infrastructure and methodologies are essential to mitigating the effects of natural hazards. That is something that affects everyone in the world, especially California, and one of the reasons that I always end my email messages and presentations with the following statement: “Geodesy is the foundation for all geospatial products and services.”

    Geodetic infrastructure and methodologies. (Image: Yehuda Bock, Scripps Institution of Oceanography)
    Geodetic infrastructure and methodologies. (Image: Yehuda Bock, Scripps Institution of Oceanography)

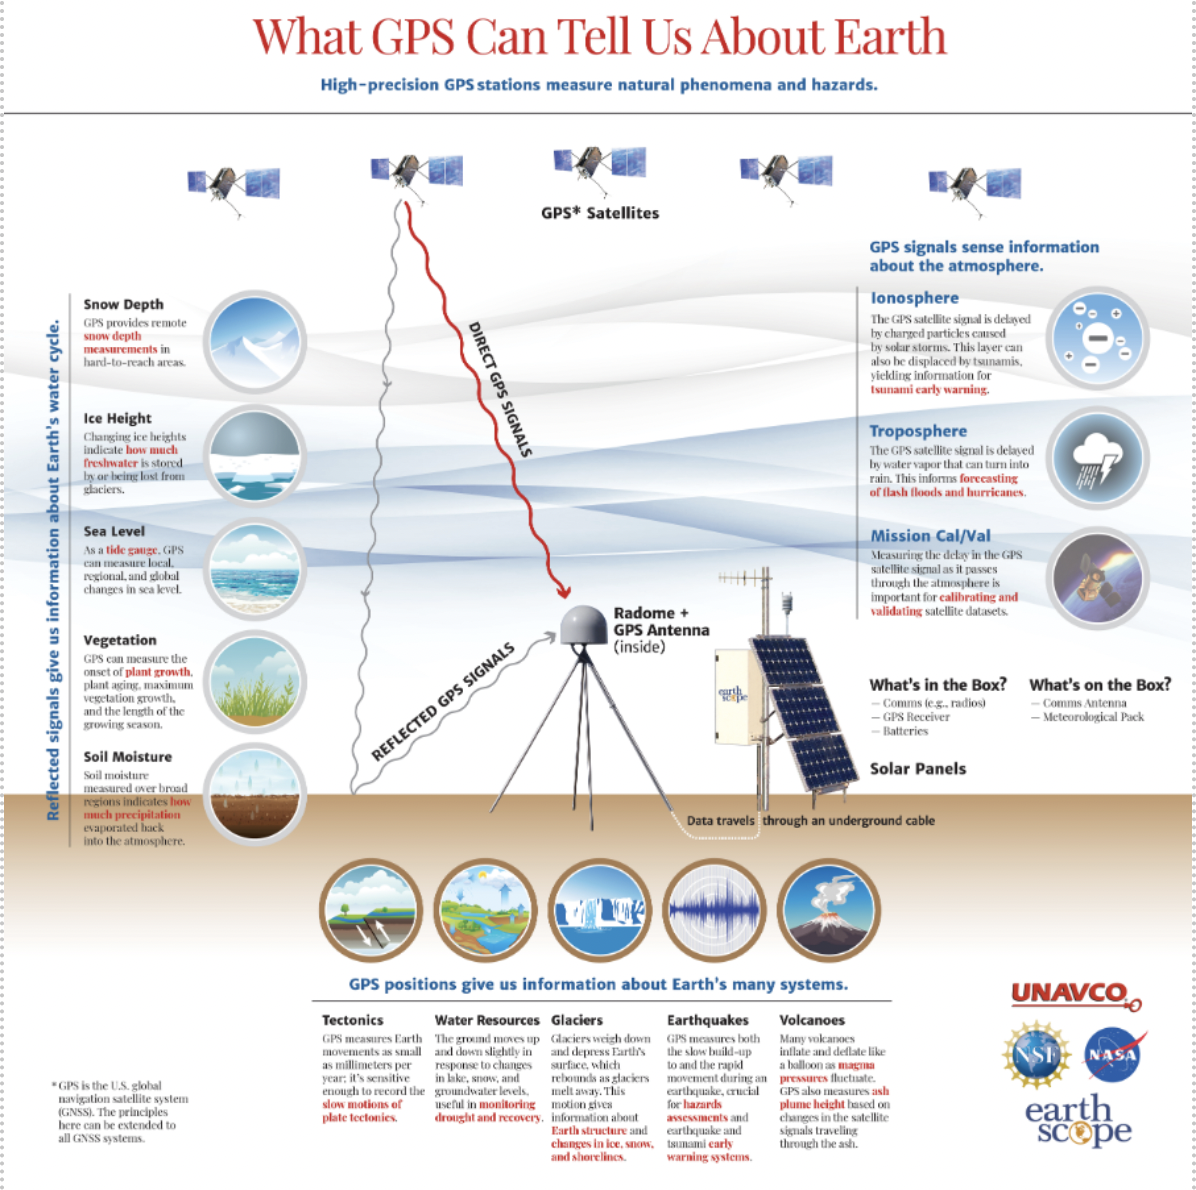
    Bock highlighted how GNSS is important to explaining natural phenomena and hazards of the Earth. Most individuals use GNSS to know where they are on a map on a phone, but GNSS (and geodesy) is so much more important to the average citizen than just knowing their location on Earth. As you can see from the image below, GNSS positioning provides information about many of Earth’s systems, such as changes in local mean sea level, the values of atmospheric parameters, the status of water resources, and the movement of the Earth’s surface due to tectonic plates, glaciers, earthquakes and volcanoes. One or more of these activities are important to every individual in the world.

    (Image: Yehuda Bock, Scripps Institution of Oceanography)
    (Image: Yehuda Bock, Scripps Institution of Oceanography)

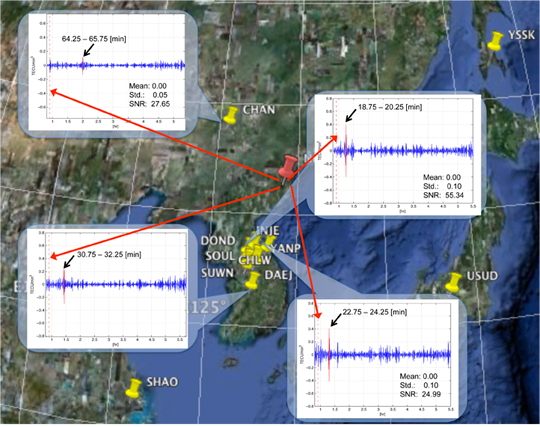
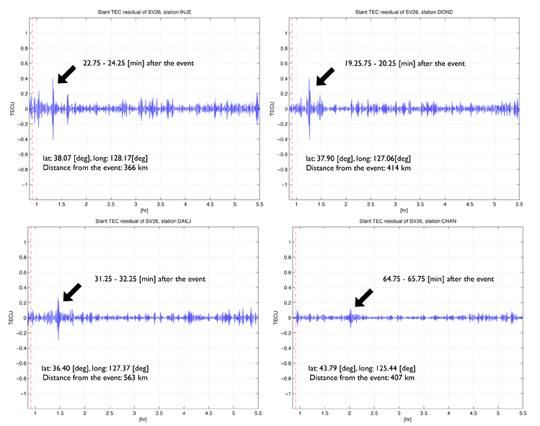
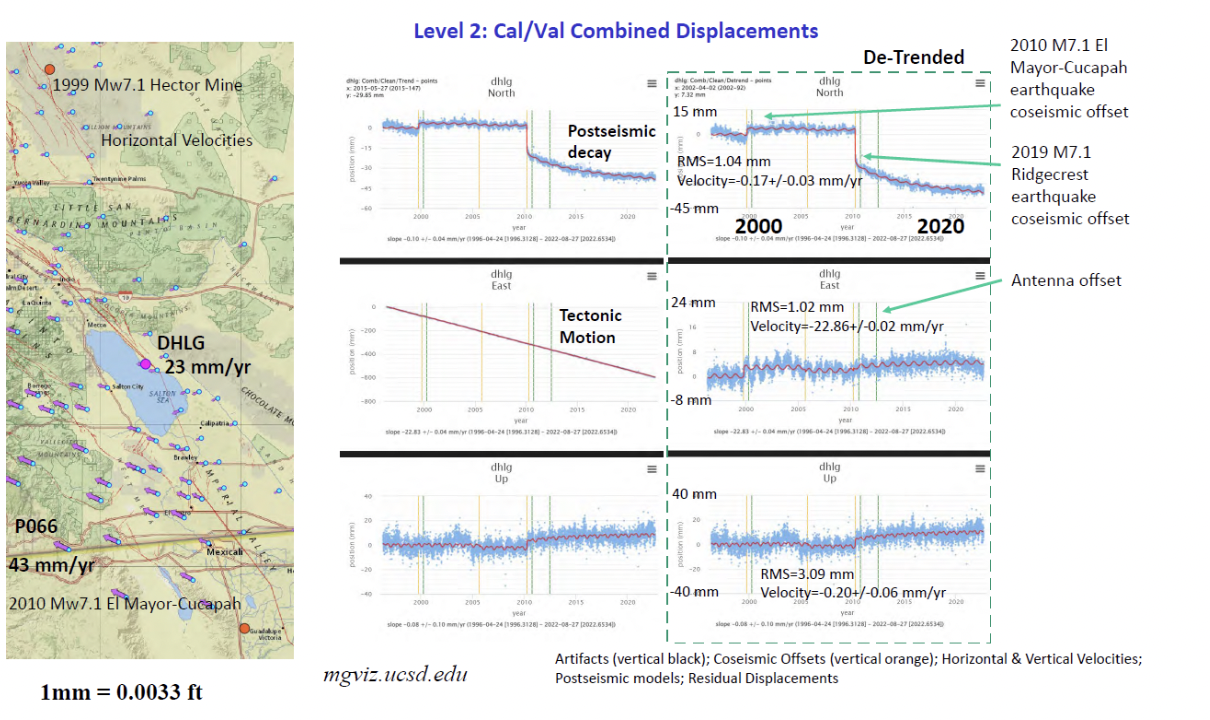
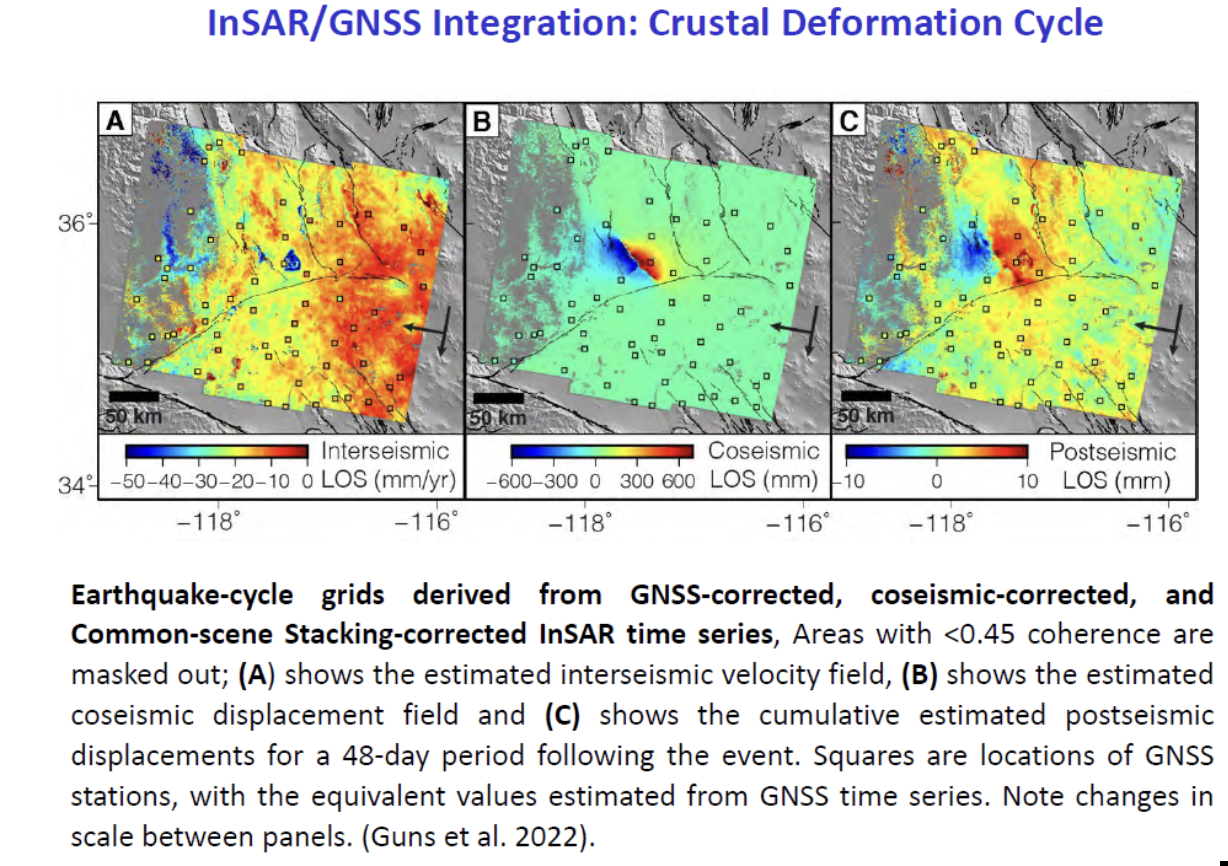
    Bock provided examples of how GNSS has been used to investigate and monitor earthquakes, which is extremely important in California. See the image below  

    Displacement due to earthquakes. (Image: Yehuda Bock, Scripps Institution of Oceanography)
    Displacement due to earthquakes. (Image: Yehuda Bock, Scripps Institution of Oceanography)

    He highlighted a methodology of a kinematic datum that uses an intra-frame velocity model to estimate positions at any location and at anytime with respect to a reference frame and epoch.  This concept is part of the National Geodetic Survey’s new, modernized, National Spatial Reference System (NSRS). Several of my previous columns have discussed NGS’ NSRS and time-dependent coordinates (for example, see my August 2022 column). 

    (Image: Yehuda Bock, Scripps Institution of Oceanography)
    (Image: Yehuda Bock, Scripps Institution of Oceanography)

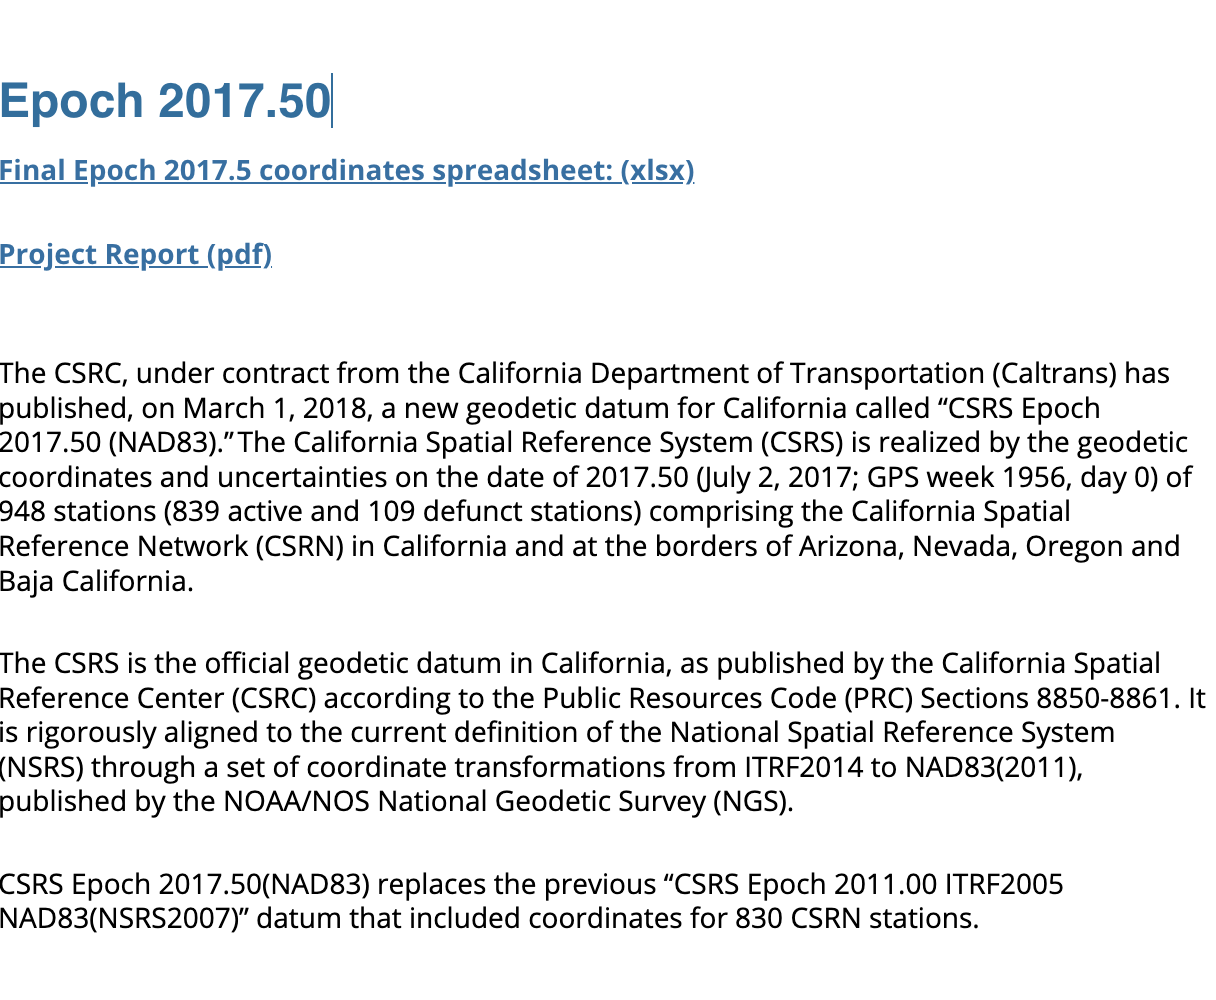
     California’s geodetic network is significantly affected by crustal movement. To help address this issue, the CSRS updated the NAD 83 coordinates. It’s denoted as CSRS epoch 2017.5 (NAD 83). See the image below for the project report on the update. This is important to anyone surveying in California because of the crustal movement affecting the coordinates of the monuments. California is well positioned to implement NGS’ NSRS. Part of the implementation of the CSRC epoch 2017.50 (NAD 83) was to have the new epoch-date coordinates transmitted with RTCM 3.0 data streams. This is something that other RTN operators from around the nation will have to do after NGS publishes the NSRS coordinates. The CSRS is a model from which others can learn. 

    Excerpt from CSRC epoch 2017.5 project report. (Image: http://sopac-csrc.ucsd.edu/index.php/epoch2017/)
    Excerpt from CSRC epoch 2017.5 project report. (Image: http://sopac-csrc.ucsd.edu/index.php/epoch2017/)

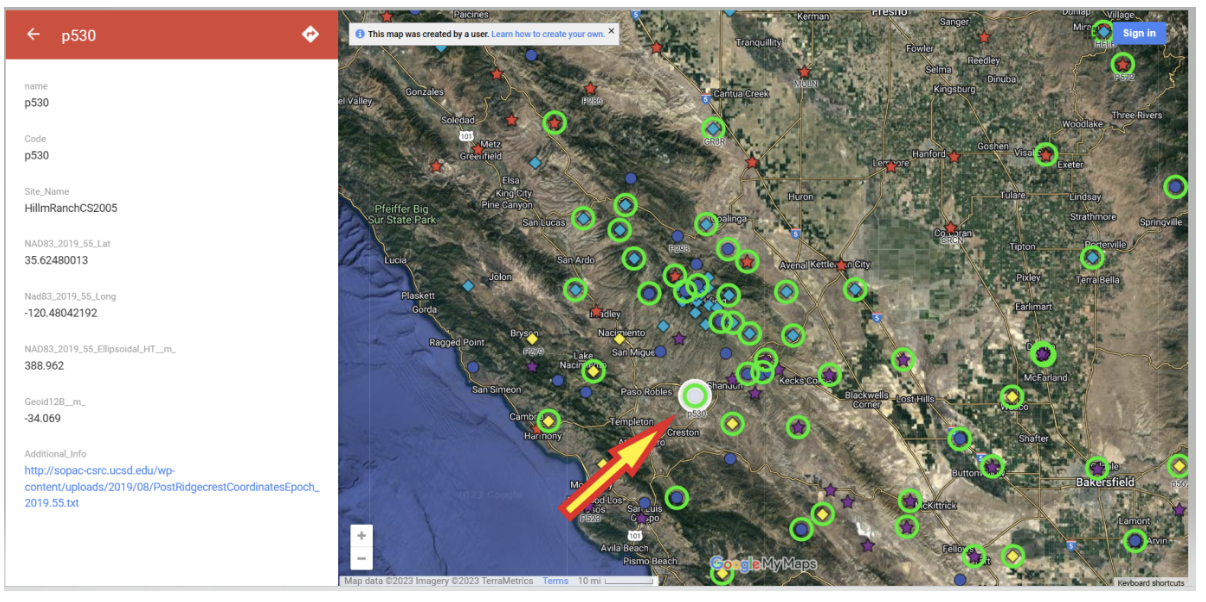
    Users that access CSRC’s epoch 2017.50 website, can find the coordinates of marks published in CSRC epoch 2017.50 (NAD83). See the image below for an example. 

    Mark p530 in CSRC epoch 2017.50 (NAD83). (Image: CSRC Website)
    Mark p530 in CSRC epoch 2017.50 (NAD83). (Image: CSRC Website)

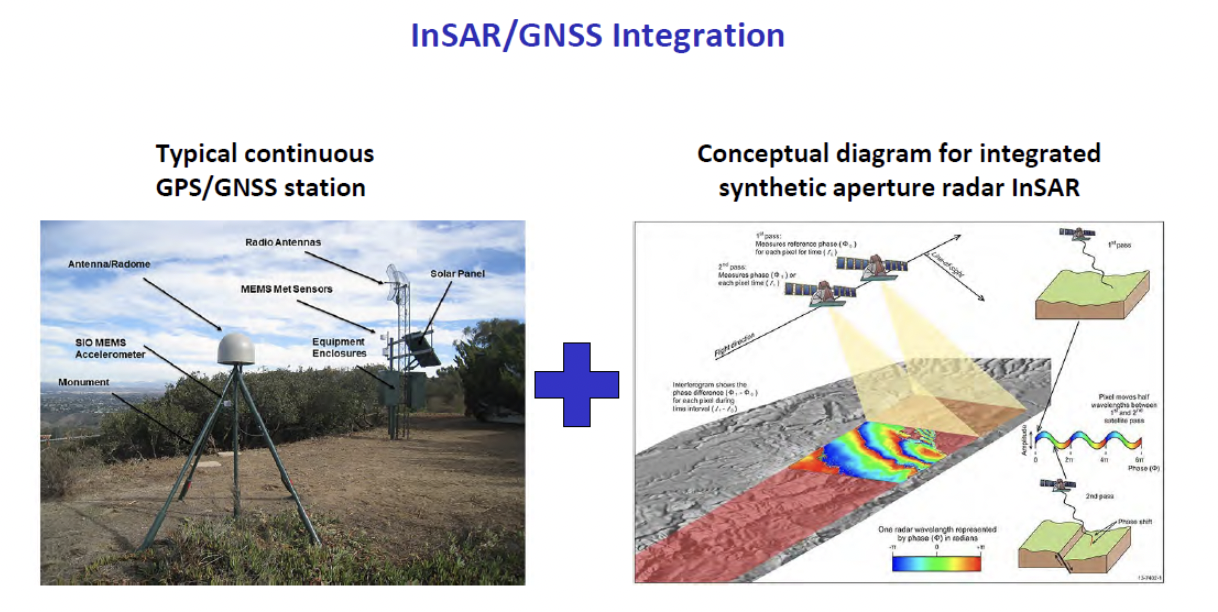
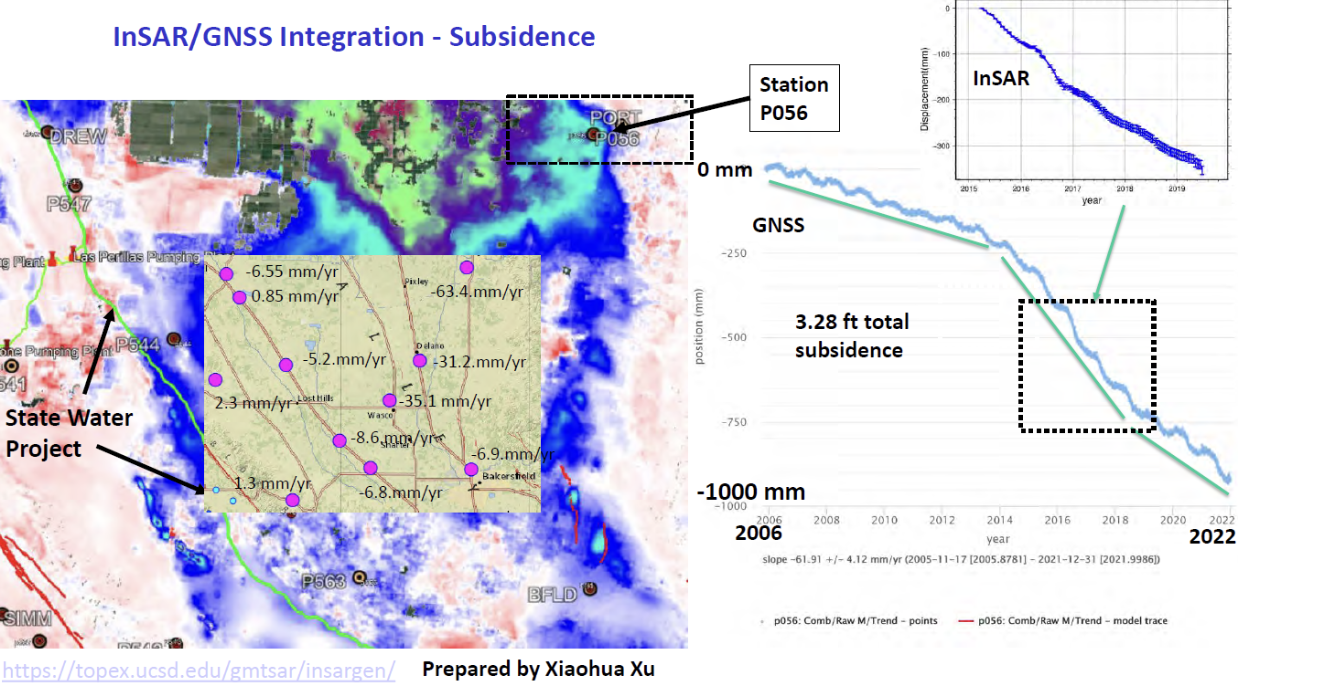
    Bock discussed the integration of InSAR and GNSS to estimate accurate land changes over large areal extents. This type of research can help in developing an accurate intraframe deformation model (IFDM) to account for movement between survey epoch coordinates (SEC) and reference epoch coordinates (REC). See my August 2022 column for more on NGS’s definition of SEC and REC coordinates.   

     (Image: Yehuda Bock, Scripps Institution of Oceanography)

    (Image: Yehuda Bock, Scripps Institution of Oceanography)
     (Image: Yehuda Bock, Scripps Institution of Oceanography)

    (Image: Yehuda Bock, Scripps Institution of Oceanography)
    (Image: Yehuda Bock, Scripps Institution of Oceanography)
    (Image: Yehuda Bock, Scripps Institution of Oceanography)

    The rest of the director’s report included the following topics: 

    • reference surfaces for unified reference frame 
    • observation systems: terrestrial and marine geoids 
    • unified reference frame 
    • GNSS-IR 
    • airborne gravity 
    • geoid model 
    • machine l;earning 
    • tracking atmospheric rivers with GNSS meteorology 
    • tracking extreme weather events with GNSS meteorology 
    • cluster analysis to unsupervised analysis of GNSS time series isolate geophysical effects 
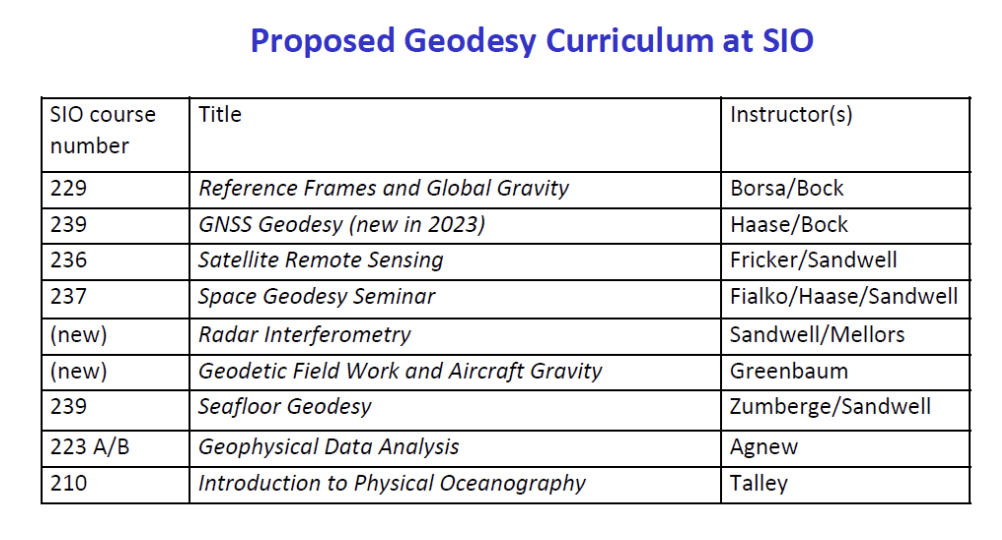
    • proposed geodesy curriculum at SIO. 

    The last one was the most important one to me because developing educational curriculums that include geodetic topics will help advance the science of geodesy.   

    (Image: Yehuda Bock, Scripps Institution of Oceanography)
    (Image: Yehuda Bock, Scripps Institution of Oceanography)


    Other speakers at the coordinating council meeting discussed the use of geodetic science in projects such as measuring sea level rise along the California coast as well as performing geodesy on the seafloor.  

    There was an interesting presentation by Humberto Gallegos discussing how to fill the skill gaps through the Geo-Spatial Engineering and Technologies (GSET) program at East Los Angeles College (ELAC). This program is helpful in developing future surveyors and geodesists. 

    (Image: EarthScope)
    (Image: EarthScope)

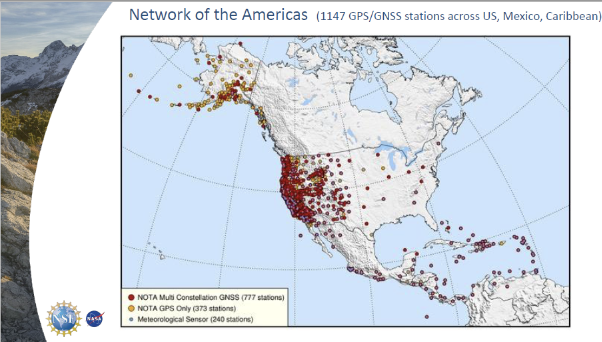
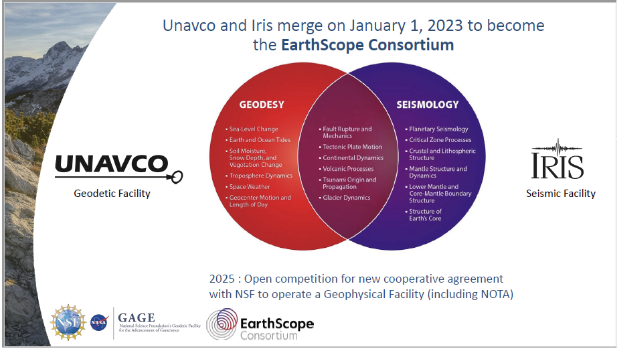
    There also was a presentation on EarthScope by Bill Funderburk. See below for a few slides from Bill’s presentation. The presentation discussed the update on the Network of the Americas (NOTA). Bill provided information on NOTA partners, NOTA network and data, NOTA in California, and the EarthScope merger. His presentation also highlighted the many partners that support the NOTA, which includes 1,147 GPS/GNSS stations across the United States, Mexico and the Caribbean. Many individuals may not know it, but UNAVCO and IRIS merged on January 1, to become the EarthScope Consortium. Readers can find more information on this new organization here

    Photo:
    (Image: EarthScope)
    (Image: EarthScope)
    (Image: EarthScope)

    I only highlighted a few items from the meeting. Please see the video of the meeting for more details.  

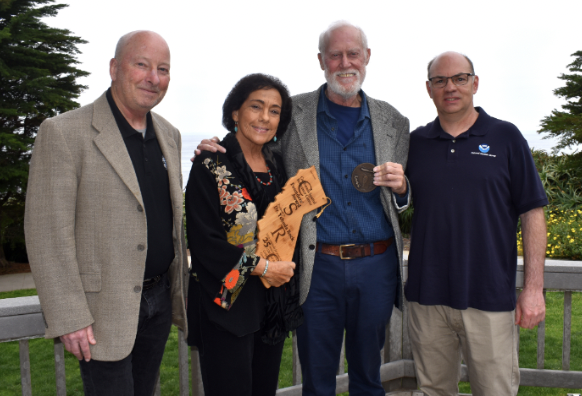
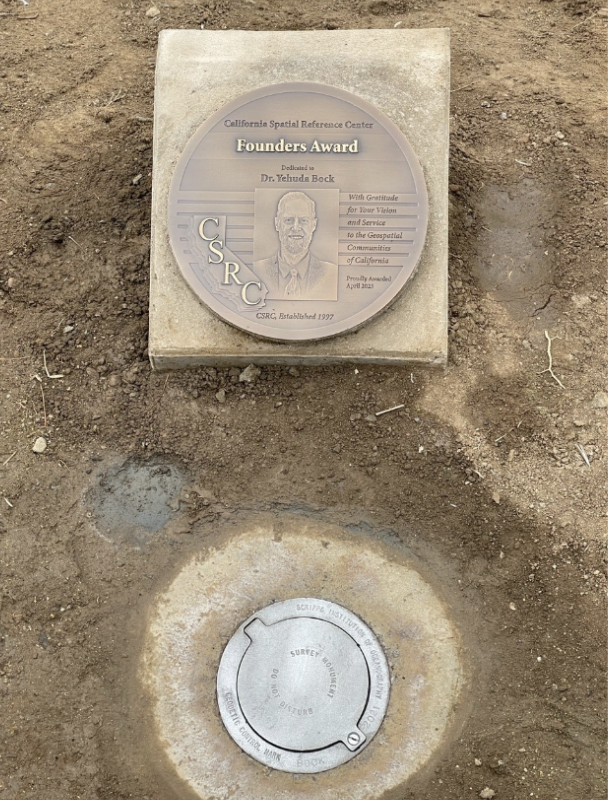
    During the meeting, Bock was also presented with the CSRC Founders Award. It was a great honor for me to say a few words recognizing the important contributions that Bock has made to the geodetic community over the past five decades. It is in large part due to his leadership that California has progressed so much in geospatial positioning services. The following are a few photos from the ceremony and a statement from the CSRS. 

    Recognition Statement from the California Spatial Reference Center

    “Distinguished Research Scientist, Yehuda Bock, was recognized by the California Spatial Reference Center (CSRC: http://sopac-csrc.ucsd.edu/index.php/csrc/) with the Founders Day Award. Presented by Dana Caccamise, Bock was honored for the “thriving science and community outreach facilitated through [his] vision and implementation of the Center for decades.” With Bock’s guidance, CSRC was established in 1997 as a partnership with surveyors, engineers, GIS professionals, the National Geodetic Survey (NGS), the California Department of Transportation (Caltrans), and the geodetic and geophysical communities, and has become of IGPP’s most successful outreach efforts.”

    (Image: Karissa Duran, Scripps Institution of Oceanography)
    From left to right: Gregory Helmer, Sharona Benami, Yehuda Bock, Dana J Caccamise II (Image: Karissa Duran, Scripps Institution of Oceanography)
    The dedicated plaque and monument. (Image: Karissa Duran, Scripps Institution of Oceanography)
    The dedicated plaque and monument. (Image: Karissa Duran, Scripps Institution of Oceanography)


    In my opinion, integrated and collaborative organizations are necessary for the successful development of geospatial products and services.  

    I would like to highlight how the Ohio State University is integrating geodesy in a geology program. The Ohio State University Geology Field Camp is a geology class that is held every year. This year, the OSU Geodetic Department is going to participate in the program to explain how the science of geodesy is helpful to geologists. The plan is to provide exercises to explain how the camp’s activities can be enhanced with geodetic techniques. 

    The 2023 geology summer field course lasts six weeks. This year, the course starts on Thursday, June 1, and ends on Friday, July 14. Students receive six semester credit hours for completion of the course. 

    The course emphasize the following: 

    • observation of stratigraphic units and their characteristics 
    • interpretation and synthesis of structures, paleoenvironments, and geologic history 
    • presentation of results by means of geologic maps and cross-sections 
    • experience with 3D visualization, GIS, GPS and computer analysis of field data 

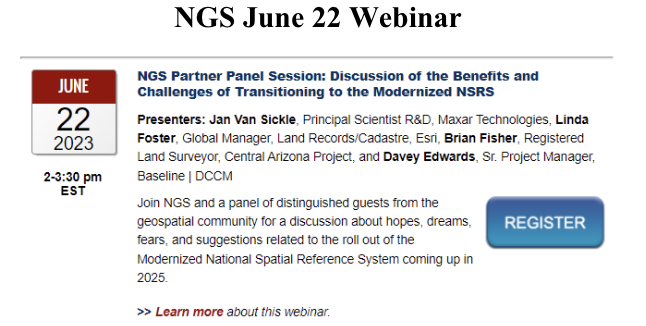
    In conclusion, on June 22, NGS is hosting a webinar that will discuss some of the benefits and challenges of transitioning to the modernized NSRS. The presenters are not NGS employees.  They are guest speakers from the geospatial community. I would encourage all users to register for this webinar. 

    (Image: NGS Website)
    (Image: NGS Website)
  • GPS reveals Antarctic bedrock rising

    The entirety of West Antarctica contains enough ice that, if it were to melt, would cause oceans to rise 10 feet. While the West Antarctic ice sheet is at risk of collapse, GPS data suggests this crisis could be averted because the bedrock supporting it is rising.

    Using GPS, an international team of researchers found that the viscosity of the mantle under the West Antarctic Ice Sheet is much lower than expected, with the crust rebounding faster than expected, possibly stabilizing against catastrophic collapse. According to the study, in 100 years, the uplift rates at the GPS sites will be 2.5 to 3.5 times more rapid than currently observed.

    Backer Islands GPS station: The small mushroom-shaped GPS antenna is supported by the nearby equipment with solar panels. (Photo: David Saddler via Colorado State University)
    Backer Islands GPS station: The small mushroom-shaped GPS antenna is supported by the nearby equipment with solar panels. (Photo: David Saddler via Colorado State University)

    Participating researchers led by scientists at the Ohio State University installed a series of GPS stations on rock outcrops around the region to measure the Earth’s rise in response to thinning ice. Measurements showed that the bedrock uplift rates near the coast of West Antarctica were as high as 1.6 inches per year, one of the fastest rates ever recorded in glacial areas.

    “This very rapid uplift may slow the runaway wasting and eventual collapse of the ice sheet,” said Rick Aster, a co-author of the study from Colorado State University. Nevertheless, Aster told the UK’s Independent, “To keep global sea levels from rising more than a few feet during this century and beyond, we must still limit greenhouse gas concentrations in the atmosphere, which can only occur through international cooperation and innovation.”

    The team also included DTU Space. Study results were published in the journal Science.

  • PNT Roundup: Columbus discovers — and implements — smart city solutions

    Visitors to the Smart Columbus Experience Center will learn how Vehicle to Everything (V2X) Technology allows cars to communicate with each other as well as with intelligent traffic infrastructure to keep mobility safe and efficient. (Image: NXP USA)
    Image: NXP USA

    Columbus, Ohio, has positioned itself smartly for an autonomous future, taking a lead role in pilot projects on infrastructure and autonomous air and road transport.

    The city will draw on up to $40 million in grants from the U.S. Department of Transportation, $10 million from Vulcan, Inc,. and $500 million in local private pledges.

    Carla Bailo, assistant vice president for mobility research and business development at Ohio State University (OSU), presented the city’s ambitious program at ION GNSS+.

    In “Position, Navigation and Timing — An Enabling Technology for Mobility and Smart Cities,” she focused on a triple-zero target: zero accidents and fatalities, zero carbon footprint and zero stress.

    Smart Columbus will put six autonomous shuttle buses in the commercial district, coordinate truck platooning, time deliveries and manage parking to reduce congestion, and undertake drone delivery of medical supplies and other critical needs. Multimodal transit apps, mobility assistance for those with disabilities and pedestrian collision avoidance will be based on real-time data on transit options and availability, as well as traffic information, road and weather conditions.

    Position, navigation and timing (PNT) technologies play a central role in smart cities: vehicle-to-vehicle and vehicle-to-infrastructure communication, autonomous navigation and collision avoidance, location-based services and smart, resilient infrastructure.

    Smart Columbus envisions the city as a center for high-tech transportation research and innovation. OSU’s partnerships with mobility companies and vehicle manufacturers, industry groups and government agencies contribute to the city’s comprehensive approach to the smart city project. Through its expertise in sensors, communication, PNT, transportation, autonomous and connected vehicles, and geospatial science and engineering, OSU will serve as the lead researcher on Smart Columbus.

    Dorota Grejner-Brzezinska, OSU professor and frequent contributor to GPS World, in her new role as associate dean for research at OSU’s College of Engineering will be a key participant in research projects on ways to integrate self-driving cars, deliver high-definition 3D maps and metadata, use sensors to better connect vehicles for safety and efficiency, and find better ways to move people around the city when they don’t have access to a car.

  • Ohio UAS Center Forwards Precision Ag, Sensor Research

    Ohio UAS Center Forwards Precision Ag, Sensor Research

    Flying at Molly Caren Agricultural Center in the Ohio State project.
    Flying at Molly Caren Agricultural Center in the Ohio State project.

    Clark State Community College in Springfield, Ohio, now includes flying unmanned aircraft systems (UAS) as part of its new precision agriculture program, according to the Ohio/Indiana UAS Center (UASC). The new program is designed to prepare students for employment with companies using geospatial technologies, including geographic information systems (GIS) and GPS applied to agricultural production or management activities, such as pest scouting, site-specific pesticide application, yield mapping, or variable-rate irrigation.

    Clark State will process and analyze the UAS-collected data. Students will learn how fly and use UAS-gathered data to determine the overall health of crops and manage a range of farming issues, including how to spot early diseases, identify specific pest infestations, and determine fertilization requirement.

    The Federal Aviation Administration (FAA) approved the Certificate of Authorization (COA) for UASC earlier this year. The center is working to expand the number of FAA-approved Certificates of Authority for research across Ohio, and operates 11 COAs in support of public entities and universities with an additional 17 COAs pending at the FAA.

    Ohio State Sensor Research

    In another UASC project, UASC and The Ohio State University initiated regular flight operations in July at Molly Caren Agricultural Center to research various types of UAS sensors to improve agricultural productivity and enhance environmental management practices through improved nutrient use efficiency.

    3D Aerial, a UAS business in Dayton, Ohio, pilots the small 1.5-lb fixed-wing aircraft for this project. Data gathered is part of a research and development effort focused on noninvasive assessment of crop health.

    “This data will be analyzed and results will be used in support of research on cropping systems and assessment of environmental factors affecting crop growth,” said Scott Shearer, professor and chair of the Food, Agricultural and Biological Engineering at Ohio State. “In addition to precision agriculture experiments, this research will help enhance water quality by better understanding how best management practices may impact surface and ground water quality.”

    The UAS market is projected to be an $82 billion industry with a potential to create approximately 100,000 jobs nationally over the next 10 years.

  • Ohio State Fans ‘Spell Out’ with GPS — and Dot the I

    Four Ohio State University football fans trekked 19 miles to create the script “Ohio” logo on a GPS tracker. Even more impressive, they used Ohio Stadium as the dot on the “i,” similar to how the tuba player dots the “i” when the Ohio State marching band performs its famous “spell out” half-time routine.

    Reddit user Orweezy and his friends used Google Maps to chart their spell out. “My coworker friends and [I] thought it would be cool to start off the football season by mapping and walking the Ohio Script this past weekend and using the stadium as the ‘I’ dotting. Would anyone be interested in doing this with us next year? Maybe even as a fund raising event for a good cause.”

    He said the project took six-and-a-half hours, including a couple of bar stops.

  • Detecting Nuclear Testing: Software Under Development by OSU Could Pinpoint Treaty Violations

    By Tracy Cozzens

    infobox_chart_2009-W Source: Tracy Cozzens
    Figure 1. Worldwide nuclear testing 1945–2009 (CTBTO website).

    Can GPS be used to detect underground nuclear explosions?

    A research team is developing a software program that uses GPS to analyze the ionospheric effect of nuclear explosions. Results would show when and where a country has conducted a secret underground nuclear test. Team members are Jihye Park, Ralph. R. B. von Frese, and Dorota A. Grejner-Brzezinska from The Ohio State University and Jade Yu Morton from Miami University.

    The Comprehensive Nuclear-Test-Ban Treaty was adopted by the United Nations General Assembly in 1996, but not all nuclear countries have ratified it, including the United States, China, Egypt, Indonesia, Iran, and Israel. Also, India, North Korea, and Pakistan have not signed the treaty.

    Park, a doctoral student in geodetic science at Ohio State, created the computer program to detect changes in the ionosphere from nuclear weapons testing.

    A previous study showed that the ionosphere was disturbed by underground nuclear testing conducted by Russia in 1990. GPS is capable of precisely measuring the total electron content (TEC) of the ionosphere along the path between satellite and receiver at a GPS station, so Park and her team decided to begin researching the use of GPS in detecting nuclear explosions.

    “Many studies have been done to monitor and model the atmosphere using GPS technology,” Park said. “Research has proven that GPS can detect natural disasters such as earthquakes or tsunamis. This study broadens those areas of study with its capability to detect underground explosions.”

    Detonation of a nuclear weapon results in a shockwave that travels through the atmosphere, changing the density of charged particles in the ionosphere. “The explosions can’t hide from the ionosphere,” said von Frese, geophysicist and project leader. “Our technology would be another nail in the structure to detect explosions.”

    “One of the arguments is ‘Well, how do you prove that a clandestine explosion occurred?’” said Grejner-Brzezinska, Park’s adviser and GPS World’s Tech Talk blog editor. “Now we can say, ‘Here, we have the data from GPS to show when and where.’”

    According to the Comprehensive Nuclear-Test-Ban Treaty Organization (CTBTO) nuclear testing has been carried out in the past by the United States, Russia, the United Kingdom, France, China, India, Pakistan, and North Korea (see Figure 1).

    Fig2_W Source: Tracy Cozzens

    Researchers, and those monitoring treaty violations, are able to target specific geographic areas that are equipped for tests, since development of a nuclear test site requires a lot of technical effort and budget. For example, the North Korean tests carried out in 2006 and 2009 were very close geographically.

    “They tend to stick to the same site and reuse their facilities for nuclear testing,” von Frese said. “So a country that has previously conducted underground nuclear testing probably will reuse the site if new testing is needed.”

    “They could be monitored using GPS as long as there are GPS stations nearby,” Park said.

    The new GPS nuclear-detection technology was presented at the Comprehensive Nuclear-Test-Ban Treaty Organization meeting held June 8–10 in Vienna, Austria, and received press coverage that drew additional interest.

    GPS Detection. The team zeroed in on a specific event to test the software, selecting a nuclear test conducted by North Korea in 2009 and using data pulled from nearby South Korean GPS stations.

    Traditional detection methods for underground nuclear tests include seismic and other sensors. The CTBTO operates an international monitoring system to detect explosions with a yield of at least one kiloton. Besides seismic sensors, monitoring includes hydroacoustic sensors to monitor for shockwaves on land and in water, infrasound to detect pressure waves, and radionuclide detectors for any gas that may have been generated, though the levels aren’t always detectable.

    “Even though there are four different systems available, they sometimes are unable to detect the underground nuclear explosions,” Park said. “GPS technology will make the detection validation stronger since each of them is based on a different theory. In the case of the nuclear test conducted by North Korea in 2009, only seismic and a few infrasound sensors detected the event because of their improved containment technique. Our study tracked down the 2009 event using GPS, and found it coincided with the seismic results.”

    Park was able to take advantage of the well-established worldwide infrastructure already in place for GPS for her software test. The team used GPS data recorded by South Korean GPS receivers of the 2009 North Korea test. “There are a few IGS (International GNSS Service) stations in South Korea, China, and Japan. Since South Korea runs their own GPS network, I requested the data so that we could obtain data from more stations located in South Korea,” Park said.

    “Since the stations we chose were permanent reference stations controlled by an international organization (IGS) and a specific country (Republic of Korea or South Korea) respectively, most of them have been running continuously except for unexpected data gaps from time to time,” Park said. Figure 2 shows the GPS stations processed for the project.

    With data in hand, Park was able to test her software. The results showed definite peaks from different stations at different times after the 2009 explosion. “We realized that the time of the detected peak was dependent on the distance between underground nuclear explosion and each GPS station,” Park said. Figure 3 shows four different stations’ TIDs (traveling ionospheric disturbances) that the team initially recognized.

    TIDs_obvious-W Source: Tracy Cozzens
    Figure 3. Traveling ionospheric disturbances (TIDs) detected at stations INJE (top left), DOND (top right), DAEJ (bottom left), and CHAN (bottom right). Click to enlarge.

    Ruling Out Quakes. One big challenge using GPS for ionospheric monitoring is determining the origin of an event. “Since earthquakes also disturb the ionosphere, distinguishing earthquakes from underground nuclear explosions are problematic even with GPS,” Park said. “Indeed, we only focused on examining and isolating TIDs from the nuclear explosions. We are now working to analyze the TIDs from earthquakes and compare them with nuclear TIDs.”

    Besides helping to distinguish between earthquakes and nuclear-test explosions, the software may eventually distinguish between nuclear plant fallout and nuclear test fallout.

    With this goal in mind, the team is analyzing the ionospheric data gathered from recent nuclear plant accidents such as the one in Japan following the earthquake and tsunami in March. “Since there were data gaps and other data issues, we have as yet nothing more to report. Hopefully, we find the earthquakes’ signature soon.”