Tag: On the Edge

  • By the Beautiful Sea

    A panorama from the GNSS tide gauge at Onsala Space Observatory. When satellites pass over the sky, the GNSS tide gauge uses signals direct from the satellite and signals reflected off the sea surface to measure the sea level. Photo: Johan Löfgren
    A panorama from the GNSS tide gauge at Onsala Space Observatory. When satellites pass over the sky, the GNSS tide gauge uses signals direct from the satellite and signals reflected off the sea surface to measure the sea level. Photo: Johan Löfgren

    New Tide Gauge Uses GNSS to Measure Sea-Level Change

    A new way of measuring and monitoring sea level — an important facet of researching climate change — has been implemented by scientists at Chalmers University of Technology in Sweden using existing coastal GPS stations.

    When satellites pass over the sky, the GNSS tide gauge uses signals direct from the satellite and signals reflected off the sea surface to measure the sea level. Photo: Johan Löfgren
    When satellites pass over the sky, the GNSS tide gauge uses signals direct from the satellite and signals reflected off the sea surface to measure the sea level. Photo: Johan Löfgren

    Measuring sea level is an increasingly important part of climate research, and a rising mean sea level is one of the most tangible consequences of climate change. Researchers at Chalmers University of Technology have studied new ways of measuring sea level that could become important tools for testing climate models and for investigating how the sea level along the world’s coasts is affected by climate change.

    Johan Löfgren and Rüdiger Haas, scientists at Chalmers Department of Earth and Space Sciences, have developed and tested an instrument that measures the sea level using a GNSS tide gauge.

    “The global mean sea level is rising because of climate change, but the change depends on where you are in the world,” said Rüdiger Haas. “We want to be able to make detailed measurements of sea level so that we can understand how coastal societies will be affected in the future.”

    The GNSS tide gauge uses GPS and GLONASS signals. BeiDou and Galileo will be added in the future.

    “We measure the sea level using the same radio signals that mobile phones and cars use in their satellite navigation systems,” said Johan Löfgren. “As the satellites pass over the sky, the instrument ‘sees’ their signals — both those that come direct and those that are reflected off the sea surface.”

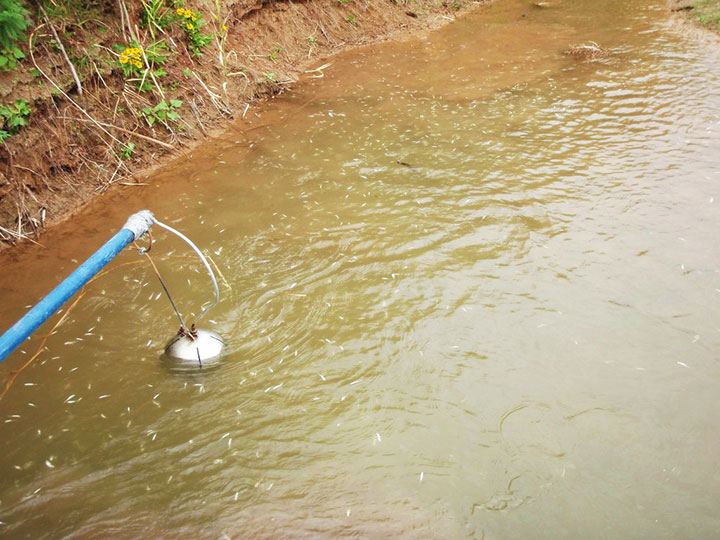
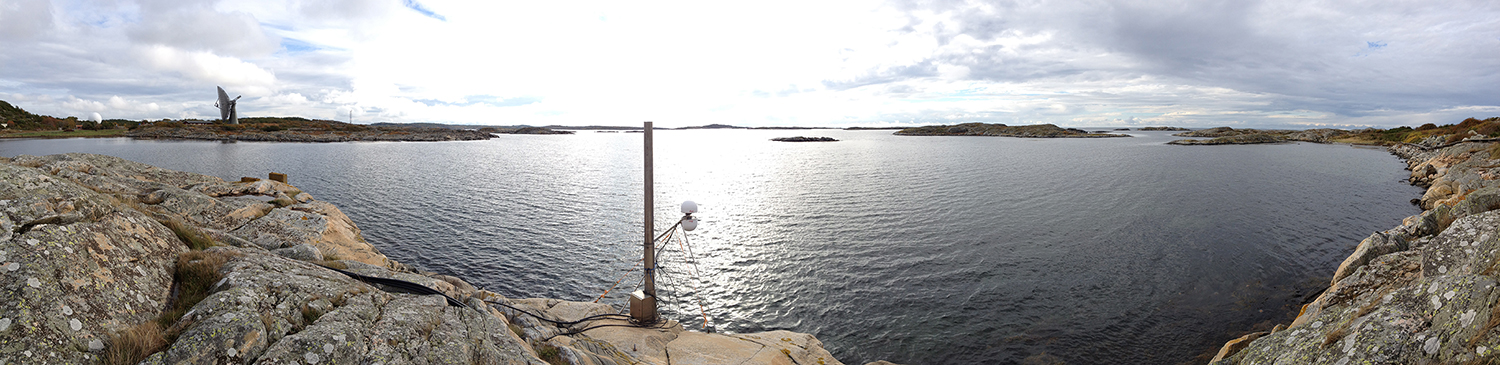
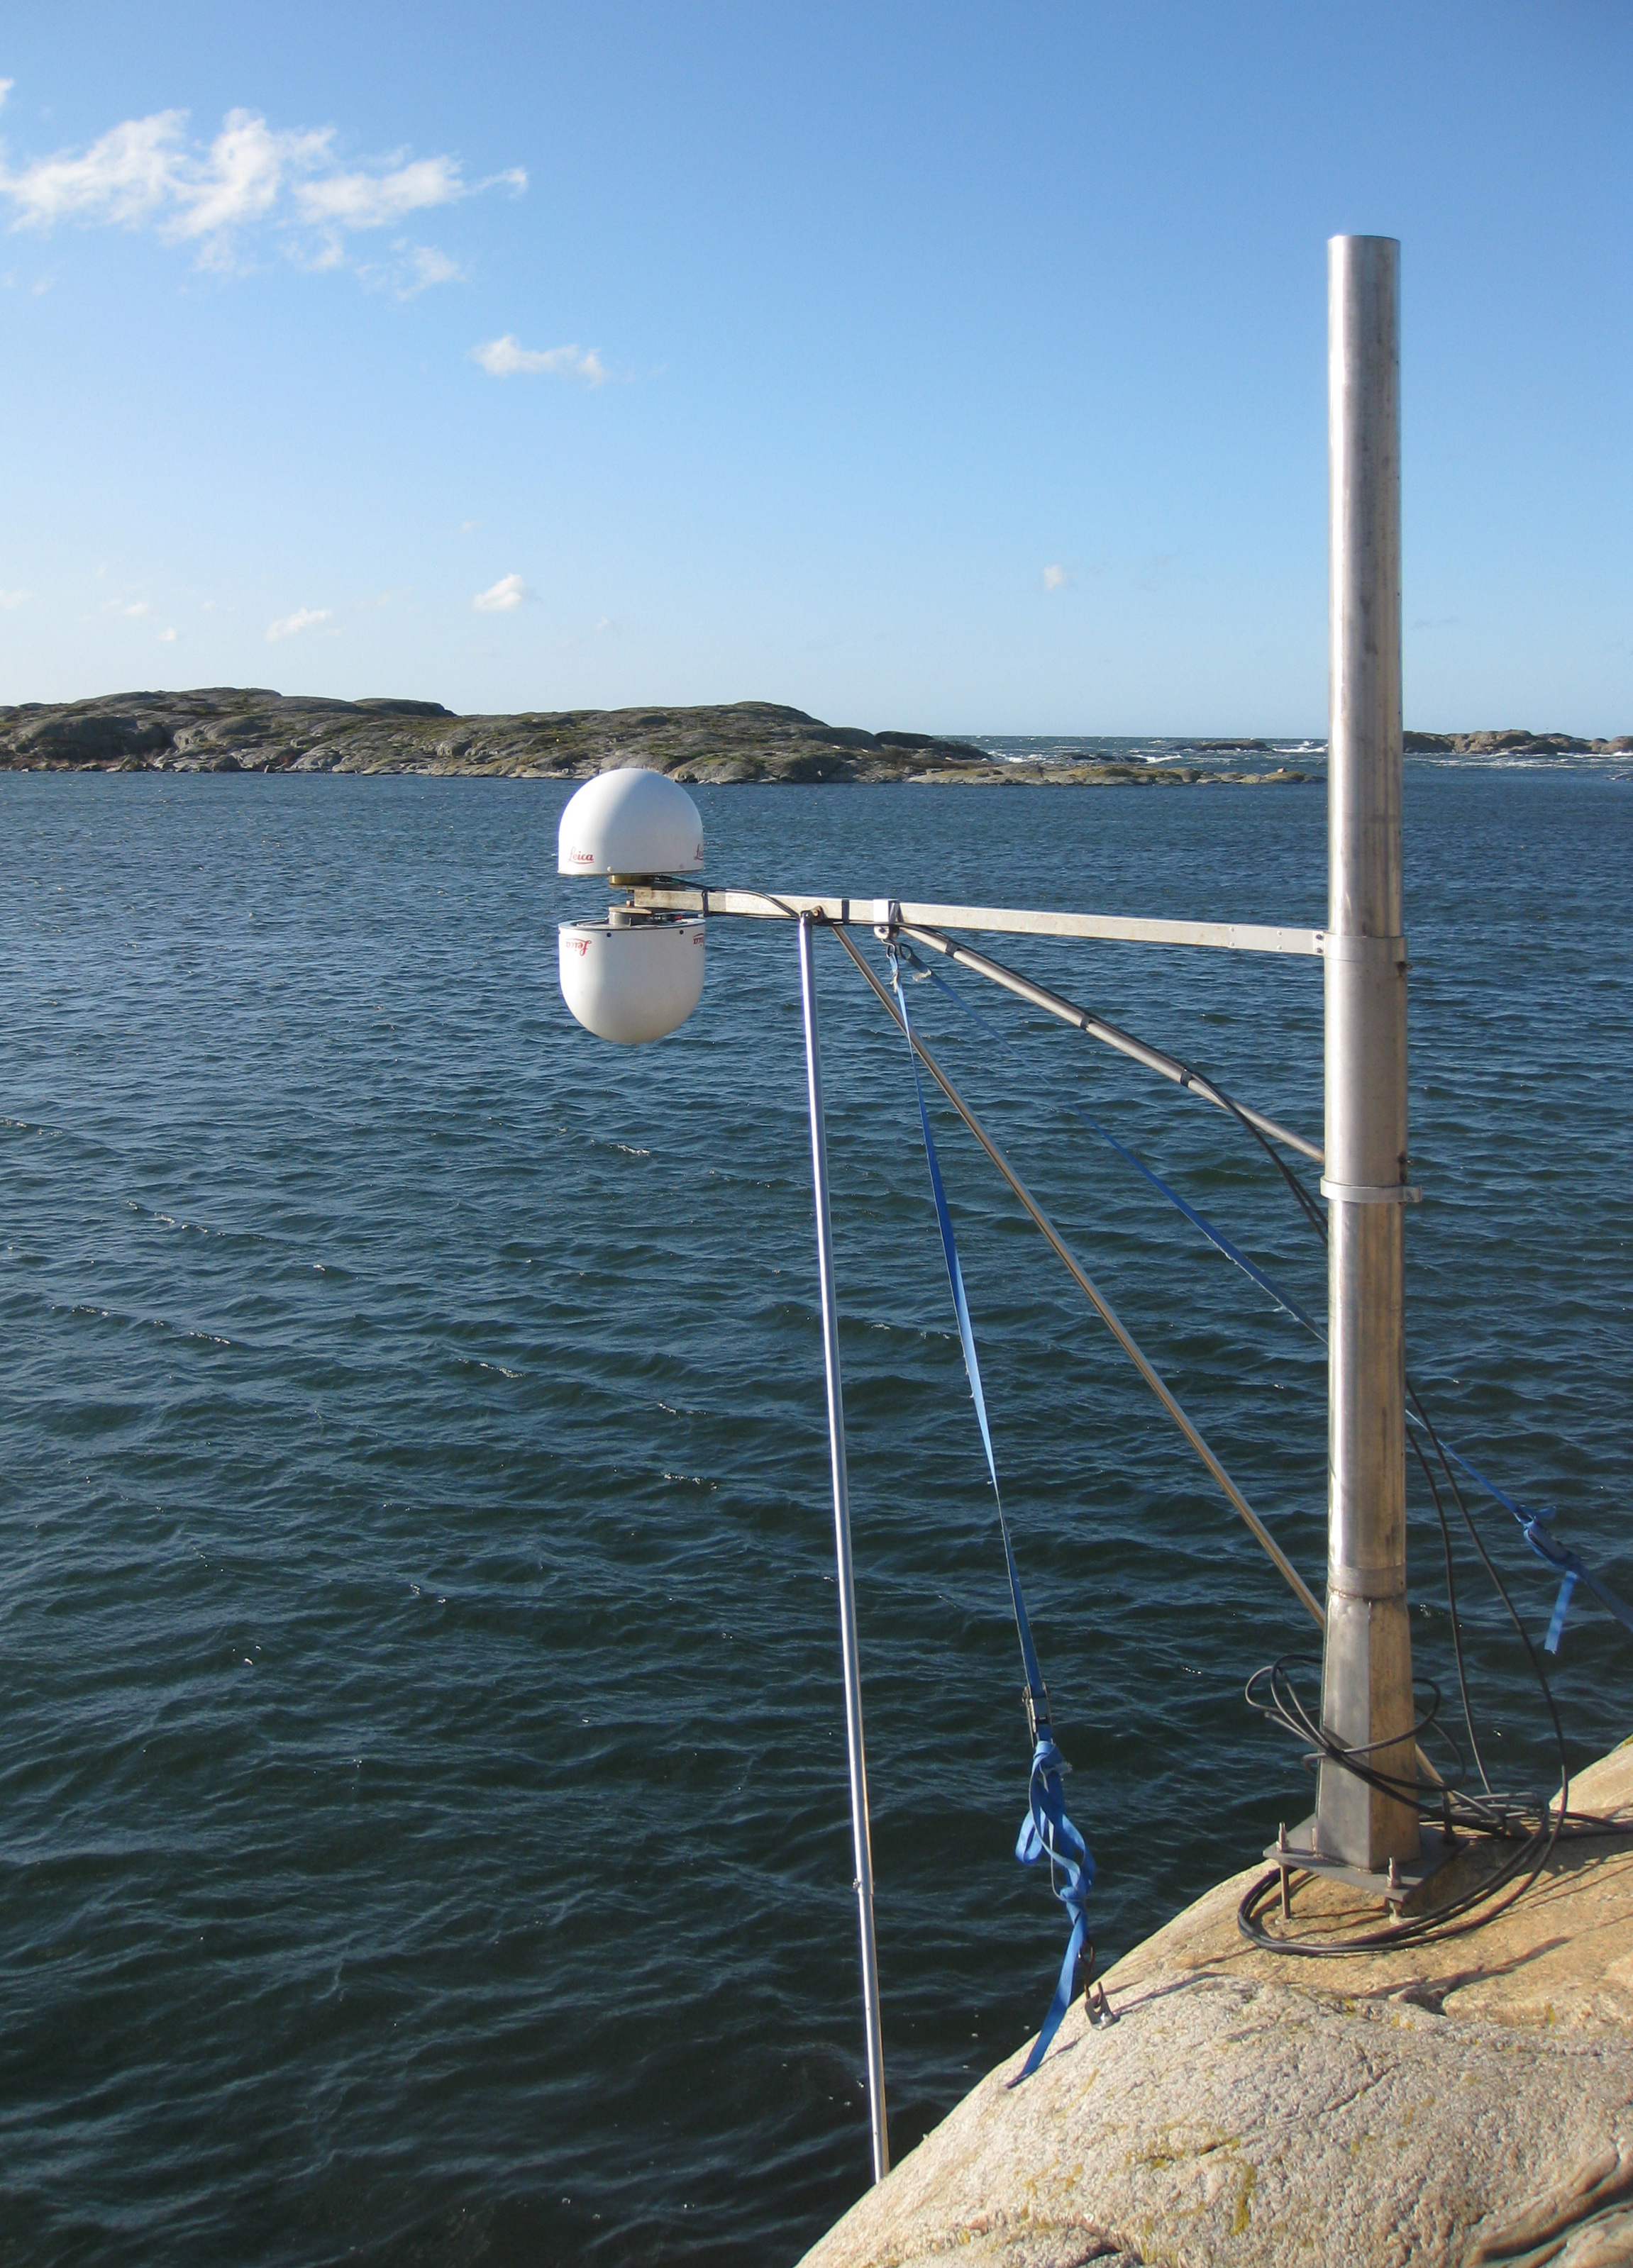
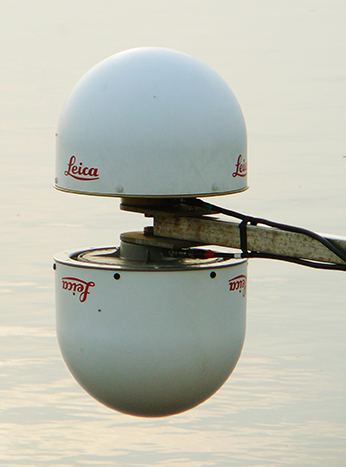
    Antenna Setup. Two antennas, covered by small white radomes, measure signals both directly from the satellites and signals reflected off the sea surface. By analyzing these signals together, the sea level and its variation can be measured up to 20 times per second. The sea-level time series is rich in physical phenomena such as tides (caused mostly by the gravitational pull of the Moon and the Sun), meteorological signals (high and low pressure), and signals from climate change. Through advanced signal processing, these signals can be studied further.

    Schematic drawing of the GNSS tide gauge for SNR analysis (left) and phase-delay analysis (right). For the SNR analysis, the satellite signal with elevation ε reflects off the sea surface and interferes with the direct satellite signal at the antenna, creating an interference pattern in the recorded SNR observable that can be related to the reflector height, hr. For the phase delay analysis, the phase delays of the direct and the reflected signals are recorded separately, and through geodetic analysis of the phase delay, the baseline between the antennas can be determined and related to the height of the nadir-looking antenna over the sea surface, ha, and the vertical distance between the antenna phase centers, d.
    Schematic drawing of the GNSS tide gauge for SNR analysis (left) and phase-delay analysis (right). For the SNR analysis, the satellite signal with elevation ε reflects off the sea surface and interferes with the direct satellite signal at the antenna, creating an interference pattern in the recorded SNR observable that can be related to the reflector height, hr. For the phase delay analysis, the phase delays of the direct and the reflected signals are recorded separately, and through geodetic analysis of the phase delay, the baseline between the antennas can be determined and related to the height of the nadir-looking antenna over the sea surface, ha, and the vertical distance between the antenna phase centers, d.

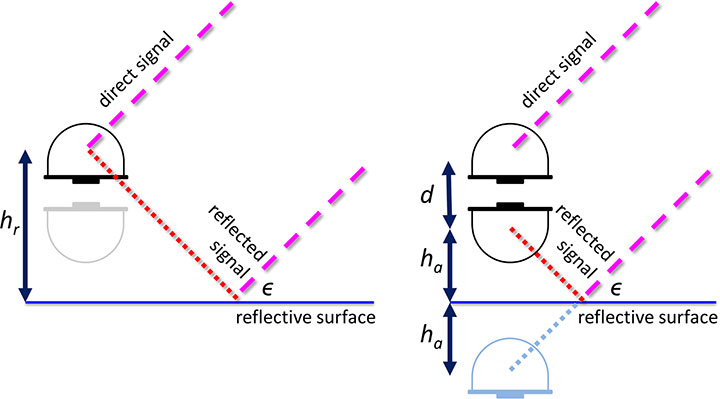
    The scientists’ initial study compared sea-level solutions from two analysis methods: signal-to-noise ratio (SNR) analysis and phase-delay analysis. The SNR analysis uses multipath signals observed with an upward-looking antenna, and the phase delay analysis uses the phase delay for both an upward- and a downward-looking antenna (see diagram).

    Both GPS and GLONASS L1 and L2 signals were recorded, and the results were compared to independent measurements of sea level from a co-located pressure tide gauge. The GNSS-derived sea level showed a high correlation with the tide-gauge sea level for both analysis methods. Correlation coefficients for the phase-delay analysis and for the SNR analysis using frequency L1 were 0.95 to 0.97, whereas the correlation coefficients for the SNR analysis using frequency L2 were 0.86 to 0.87. 

    The phase-delay analysis shows a better agreement with the independent tide gauge sea level than the sea level from SNR analysis. Expressed as RMS differences, the phase-delay analysis achieves values of 3.5 cm (GPS) and 3.3 cm (GLONASS), whereas the SNR analysis achieves 4.0 cm (GPS) and 4.7 cm (GLONASS). The scientists concluded that, for the phase-delay analysis, it is possible to use both frequency bands, and for the SNR analysis, frequency band L2 should be avoided if other signals are available.

    The GNSS tide gauge at Onsala Space Observatory uses signals from satellite navigation systems like GPS to measure the sea level. Photo: Johan Löfgren
    The GNSS tide gauge at Onsala Space Observatory uses signals from satellite navigation systems like GPS to measure the sea level. Photo: Johan Löfgren

    Land and Sea. Unlike traditional tide gauges, the new GNSS tide gauge can measure changes in both land and sea at the same time, in the same location. That means both long-term and short-term land movements (post-glacial rebound and earthquakes) can be taken into consideration.

    “Now we can measure the sea level both relative to the coast and relative to the center of the Earth, which means we can clearly tell the difference between changes in the water level and changes in the land,” said Johan Löfgren.

    This summer, other high-precision instruments are being installed to work with the Onsala GNSS tide gauge, in collaboration with SMHI, the Swedish Meteorological and Hydrological Institute.

    “Our tide gauge station will become part of a network of stations along the coast of Sweden that will be able to monitor changes in the water level to millimeter precision well into the future,” said Gunnar Elgered, professor at Chalmers Department of Earth and Space Sciences.

    The scientists have also shown that existing coastal GNSS stations, installed primarily for the purpose of measuring land movements, can be used to make sea-level measurements.

    “We’ve successfully tested a method where only one of the antennas is used to receive the radio signals. That means that existing coastal GNSS stations — there are hundreds of them all over the world — can also be used to measure the sea level,” said Johan Löfgren.


    This work was previously reported in these publications: Larson, K.M., J. Lofgren, and R. Haas, “Coastal Sea Level Measurements Using A Single Geodetic GPS Receiver,” Adv. Space Res., Vol. 51(8), 1301-1310, 2013, doi:10.1016/j.asr.2012.04.017, 2013; and Larson, K.M., R. Ray, F. Nievinski, and J. Freymueller, “The Accidental Tide Gauge: A Case Study of GPS Reflections from Kachemak Bay, Alaska,” IEEE GRSL, Vol 10(5), 1200-1205, doi:10.1109/LGRS.2012.2236075, 2013.

  • Fishy Business: Handhelds Help Remove Invasive Species from Utah River

    Fishy Business: Handhelds Help Remove Invasive Species from Utah River

    A Utah DWR field crew rides along in an electrofishing boat.
    A Utah DWR field crew rides along in an electrofishing boat.

    The Utah Division of Wildlife Resources (DWR)  is using rugged Juniper Systems handhelds in an innovative way: to remove an invasive fish species from the Green River so that native fish can flourish.

    A DWR field crew first used the Allegro MX handheld, loaded with custom fisheries software, to monitor native fish species and remove invasive fish in a 2013 project along the Green River, located near Dinosaur National Monument in Utah’s northeast corner.

    The field crew’s work involved boat electrofishing, in which the researchers ride along in a boat with electrodes protruding into the water. The electrodes send out an electrical current, temporarily stunning the fish.The fish float to the surface, where they are netted and inspected. 

    Invasive fish are collected and removed from the river. Invasive species can degrade fisheries habitats and harm the ecosystem. Right, the Allegro MX handheld.
    Invasive fish are collected and removed from the river. Invasive species can degrade fisheries habitats and harm the ecosystem. Right, the Allegro MX handheld.

    Every five miles, the crew stopped the boat and collected data on the fish. In a single day on a 12-mile stretch of the Green River, the crew caught 2,800 fish. 

    When a native species was caught, the fish was given a passive integrated transponder tag. Data was collected about the fish, and then it was released. When an invasive species was netted, however, it was kept for later data collection, and then removed from the river. Invasive species — fish transplanted from another location — can outcompete native fish, degrade fisheries habitats, and harm the ecosystem.

    With high-value native fish, the team took a GPS point and collected data on the species, length, weight, sex, ripeness, and more, explained Juniper Systems’ natural resources market manager Trevor Brown, who accompanied a crew.

    Brown explained that understanding the location of native fish helps fisheries biologists determine the effectiveness of previous removal efforts: Are native fish prospering in areas where invasive species were previously removed? Location also helps biologists associate where native fish are caught with habitat characteristics, which helps guide more targeted invasive removal efforts.

    Allegro MX handheld.
    Allegro MX handheld.

    Because the Green River is a a major tributary of the Colorado River, the boat crews submit their data to a central database that supports a larger effort to understand the status and health of fisheries systems of the entire Colorado River watershed. The information is used to guide management and policy decisions, fish regulations, and fisheries research.

    “Location-specific data can help biologists understand population and dispersal of both native and non-native fish at a macro level,” Brown said.

    The Utah DWR made the switch to the Allegro MX after seeing its benefits, including its full alpha-numeric keyboard, which allowed for rapid, accurate data entry, as well as its extreme ruggedness, sunlight-readable display, integrated GPS, and RFID compatibility. 

    The team even found the Allegro MX, rated IP67, could float — an additional bonus when working along a river in a shallow craft.

    Brown customized the fisheries software for the Utah DWR field crews. The crews previously collected data using pen and paper, and then manually entering it into Microsoft Excel, a time-consuming and error-prone process. The custom fisheries software, available through Juniper Systems, reflects the data that needs to be collected, with required data fields and streamlined data entry. Because many of the Utah DWR crews are made up of seasonal workers, Brown designed the fisheries app to be easy to learn and use.

    Biologists use the Allegro MX to collect data on the fish, including this endangered razorback sucker.
    Biologists use the Allegro MX to collect data on the fish, including this endangered razorback sucker.

    Northern Pike. Besides boat electrofishing, the fisheries software can be used for other applications, including an invasive fish removal application called fyke netting. Shaped like a bag with several hoops forming its structure, a fyke net acts as a funnel to trap swimming fish. The Utah DWR uses fyke nets primarily in the spring to trap invasive northern pike while they are spawning. After setting the fyke nets, crews return to check them and collect data on the trapped pike.

    The fisheries software is also used for tributary electrofishing data collection, in which wader-clad crews walk along tributaries with electrofishing backpacks, shocking the water. As in boat electrofishing, the crews collect the invasive fish for later data collection, and they tag and collect data on native fish before releasing them.

    The team experienced significant improvement with the new data collection process. “[The fisheries software] greatly reduced the data-entry time to the point where it has already paid for itself,” said Joe Skorupski, Native Aquatics Biologist at the Utah DWR. “Last year with three people, we took over 200 hours to enter, verify, and manipulate data. This year, it took one person 20 hours and errors were nonexistent due to the software and new data-collection process. I could go on and on about all the great improvements due to the handheld and the software.”

    Since 2013, the Utah DWR has expanded its use of the Allegro MX and software for parallel projects, such as native fish sampling on fast-moving sections (Flaming Gorge) of the Green River, where fewer invasive fish are present.

    Electrofishing probes temporarily stun the fish.
    Electrofishing probes temporarily stun the fish.
  • On the Edge: Find Yourself in Vegas

    On the Edge: Find Yourself in Vegas

    The Bellagio Hotel & Casino in Las Vegas, Nevada. Photo credit: Photographersnature.
    The Bellagio Hotel & Casino in Las Vegas, Nevada. Photo credit: Photographersnature.

    Qualcomm and Cisco Collaborate to Improve Indoor Navigation

    Las Vegas — home of gambling, shows, and massive hotel/entertainment/resort complexes. It’s not always easy to find what you’re looking for amid miles and miles of indoor floorspace.

    PropertyMap-W
    Previous Bellagio visitors had to rely on a static map to find their way around the massive Bellagio resort.

    In May, Qualcomm Atheros and Cisco showcased its collaboration to enhance indoor location services at a customer deployment at the Bellagio Resort and Casino in Las Vegas. The event took place in cooperation with MGM Resorts International during the Interop information technology conference. Participants had the opportunity to try out Qualcomm and Cisco’s approach to indoor location services, which uses the Qualcomm IZat indoor location platform with Cisco’s Connected Mobile Experience. According to the companies, the combination improves location accuracy and allows users to discover services with context awareness in sprawling retail, travel, and hospitality venues, such as Las Vegas resorts.

    The companies began their collaboration in November 2012. The Bellagio mobile app, available for iOS and Android, is now offered as a free download for guests using their smartphones, tablets, and other mobile devices.

    At the Interop event, participants were given Samsung devices with Qualcomm IZat software, which tracked their position within the Bellagio on a map as they moved through the hotel — a definite advantage over less-advanced apps which only provide a static map.

    Based on the person’s location, the mobile app provides recommendations of nearby services such as restaurants, shows, spa services, and bars and lounges on the property. Guests can become a loyalty member and be alerted to discounts at local restaurants, shops, and wine bars. “This creates a truly unique mobile experience for guests and visitors, putting all the amenities of indoor-location-enabled spaces at their fingertips,” according to Cisco.

    Event participants pick up Samsung phones equipped with the Bellagio app.
    Event participants pick up Samsung phones equipped with the Bellagio app.

    Qualcomm Atheros, which is Qualcomm Technologies’ networking and connectivity subsidiary, recently enhanced its IZat location platform to enable more precise positioning (within 3–5 meters) inside buildings to make indoor positioning more useful to consumers.

    The Cisco Connected Mobile Experience offers a Wi-Fi Passpoint (HotSpot 2.0) solution to integrate indoor location and real-time analytic technologies to deliver personalized mobile services and content. The solution is built upon the Cisco Mobility Services Engine, which uses the Bellagio’s existing wireless access-point infrastructure to determine indoor location for mobile devices. Cisco worked with MGM Resorts’ service provider Mobilitie and its partner Meridian to link the mobile app, context-aware services, and wireless connectivity experience together.

    The solution is designed to help app developers deploy mobile applications and services that engage the customer more effectively, the companies said.

  • On the Edge: Southwest Shakes

    By Tracy Cozzens

    Using a large network of GPS stations, a team of researchers has found that the Rio Valley Rift in the Southwest United States — previously suspected to be dead — is slowly expanding, at a rate of about 0.1 millimeter per year.

    The Rio Grande Rift extends from Colorado’s central Rocky Mountains to Mexico.

    The study was conducted by scientists at the Cooperative Institute for Research in the Environmental Sciences (CIRES) at the University of Colorado at Boulder, in collaboration with the University of New Mexico, New Mexico Tech, Utah State University, and UNAVCO.

    “We don’t expect to see a lot of earthquakes, or big ones, but we will have some earthquakes,” said study author Anne Sheehan, CIRES Fellow and associate director of CIRES Solid Earth Sciences Division. “We use continuous measurements of GPS sites from across the Rio Grande Rift, Great Plains, and Colorado Plateau to estimate present-day surface velocities and strain rates,” Sheehan said.

    Using GPS instruments at 25 sites in Colorado and New Mexico, the team tracked the rift’s miniscule movements from 2006 to 2011. The team found an average strain rate of 1.2 nanostrain each year across the experimental area. A nanostrain is a change in length of one part per billion, thus 1.2 nanostrain per year is equivalent to 1.2 millimeter per year extension over a 1000-kilometer length.“If you picked two points in New Mexico, and one of them lies 100 kilometers to the west of the other, then they would be moving apart at a rate of 0.1 millimeter per year,” explained researcher Henry Berglund.

     Researchers used data from 25 continuous GPS stations installed as part of the EarthScope Rio Grande Rift GPS experiment, supplemented by data from other GPS monuments in the southwestern U.S., resulting in a data set of daily position estimates of 284 GPS monuments for the years 2006 through 2010.  Credit: Tracy Cozzens
    Researchers used data from 25 continuous GPS stations installed as part of the EarthScope Rio Grande Rift GPS experiment, supplemented by data from other GPS monuments in the southwestern U.S., resulting in a data set of daily position estimates of 284 GPS monuments for the years 2006 through 2010.

    “It is lower than we thought but it does exist,” Sheehan said. “Some people thought it was zero but we are seeing things are extending slowly.”

    The slow rates of motion made previous attempts to determine tectonic activity difficult. Previously, geologists had estimated the rift had spread apart by up to 5 millimeters each year but the errors introduced by the measuring instrumentations were significant. “The GPS has reduced the uncertainty dramatically,” Sheehan said. “This is the most comprehensive and accurate set of geodetic measurements in this area to date.”

    The extensional deformation is not concentrated in a narrow zone centered on the Rio Grande Rift. Instead, it is distributed broadly from the western edge of the Colorado Plateau into the western Great Plains — a span of more than 370 miles. “This unexpected pattern of broadly distributed deformation at the surface has important implications for our understanding of how low strain-rate deformation within continental interiors is accommodated,” Sheehan said. “Questions we wanted to answer are: how is the Rio Grande Rift deforming? Is it alive or dead? Is it opening or not?”

    Along the rift, spreading motion in the crust has caused magma to rise to the surface, creating long basins susceptible to earthquakes. “The rift is still active,” Sheehan said.

    The team plans to continue monitoring the Rio Grande Rift, and may attempt to determine vertical as well as horizontal activity to determine whether the Rocky Mountains are still uplifting.

     University of Colorado (Boulder) student Henry Berglund services GPS site RG20 west of Silverton, Colorado.  Credit: Tracy Cozzens
    University of Colorado (Boulder) student Henry Berglund services GPS site RG20 west of Silverton, Colorado.

    The study’s findings shed light on how continents deform away from plate boundaries, Sheehan said. At plate boundaries scientists can clearly see what is going on. “Things move past each other and crash into each other. At active plate boundaries, the rates of motion detected by GPS can be centimeters per year. Compare that with the fraction of a millimeter per year that we have measured for the Rio Grande Rift.”

    “Present day measurements of deformation within continental interiors have been difficult to capture due to the typically slow rates of deformation within them,” Berglund said. “Now, with the recent advances in space geodesy, we are finding some very surprising results in these previously unresolved areas.”

    The National Science Foundation funded the study. EarthScope and UNAVCO provided instruments, equipment, and engineering services. Results of the study were published in the January 2012 issue of Geology magazine.

     GPS monuments in the vicinity of the Rio Grande Rift and southern Rocky Mountains. The study included construction of 25 GPS monuments (blue circles) in Colorado and New Mexico in 2006 and 2007. Regional EarthScope Plate Boundary Observatory and Continuously Operating Reference Station monuments are shown by gray triangles. Credit: Tracy Cozzens
    GPS monuments in the vicinity of the Rio Grande Rift and southern Rocky Mountains. The study included construction of 25 GPS monuments (blue circles) in Colorado and New Mexico in 2006 and 2007. Regional EarthScope Plate Boundary Observatory and Continuously Operating Reference Station monuments are shown by gray triangles.
  • On the Edge: Driving Reality Home

    By Tracy Cozzens

    A new navigation system looks to make driving safer by removing the need for drivers to look away from the road at their navigation device. With Wikitude Drive, as a driver moves down the road, the route is “drawn” onto the live video screen of an Android smartphone.

    How is this possible? Augmented reality.

    Augmented reality (AR) is a term for a live direct or indirect view of a physical real-world environment whose elements are augmented by virtual computer-generated imagery. The idea to blend augmented reality with navigation struck Philipp Breuss-Schneeweis, founder of Mobilizy, in 2008 when he was developing the Wikitude World Browser for the first Android Developer Challenge. Considering the awards Wikiude Drive has received so far, including being named Global Champion in the 2010 Navteq Challenge, it could be considered the next big advance in consumer navigation.

    Wikitude Drive, which launched at the end of 2010, works by attaching a mobile phone on top of a dashboard looking at the road. The application then overlays video captured through the camera with driving instructions. This allows users to drive through their phone, watching the road even while they are looking at directions.

    “With Wikitude Drive I don’t find myself looking for directions; the device itself guides me along the way,” said Nicola Radacher, product manager at Mobilizy.

    According to Breuss-Schneeweis, Wikitude Drive distinguishes itself from other navigation systems in two ways: First, due to the overlaying of the route onto the live video stream of the surroundings, the driver can easily recognize and follow the suggested route. Instead of looking at an abstract map, the driver is looking at the real world. The navigation system leads the driver through unfamiliar territory in a natural, real, and easy way.

    Second, Wikitude Drive solves a key problem that all other navigation systems have. These systems require the driver to take his eyes off the road to look at the abstract navigation map. Just by looking at the map screen for one second when driving at 100 km/h (62 mph), the driver is actually “blind” for 28 meters (92 feet).

    “Think about how much can happen in those precious meters. Since Wikitude Drive provides you with driving directions on top of the live video stream, you still see what is happening in front of you when looking at the display of your mobile AR navigation system,” Breuss-Schneeweis said.

    The AR system uses data from a smartphone’s GPS, compass, and movement sensors, retrieves information from its database, then displays the information over the camera feed. The company says millions of points of interest will also be displayed when a future version is integrated with Wikitude World Browser, the company’s AR browser for smartphone users.

    Wikitude Drive still can be used the traditional way. In some driving conditions — for example when driving in the dark — a drawn map is advantageous, and a driver can switch to the 3D map view by tapping the screen. Voice commands are also provided.

  • On the Edge: Galileo to the Rescue

    By Lars Holstein

    The alarm operations center for the state of Bavaria receives this message from the accident location, and swiftly moves into coordinating activity, gathering and distributing real-time geospatial data and other key information to all emergency teams and medical facilities in the area. A demonstration of large-scale rescue operations showed how Galileo-based positioning signals in the Galileo test-bed in Berchtesgaden, Germany can more efficiently organize complex and costly rescue work through use of GNSS-supported mobile navigation devices.

    Current decision-making aids in the field of search-and-rescue offer only a limited IT-supported common operational picture (COP). Many components for a full solution are still lacking. Heterogeneity in sensor networks and proprietary system designs limit interoperability and flexibility, hampering the creation of a full COP across collaborating organizations.

    OnEdge-W
    “E
mergency Alert: Bus collision in Berchtesgaden, parking area Salzbergwerk. Many injured. Bus overturned, some thrown from vehicle, some trapped inside. Local temperature below freezing, snow falling. All crews respond immediately.”

    An extensive training exercise (photo above) performed by the Fire Brigade, Bavarian Red Cross, and German Federal Agency for Technical Relief focused on challenges and advantages in this framework.
The ERA-Star Project G2Real integrates real-time Earth-observation data and onsite measurements, leveraging existing and emerging open geospatial consortia. Spanish, Austrian, and Bavarian research institutes and enterprises collaborated to prepare and upgrade a COP based on integrated live information, satellite-navigation, and remote sensing. The overall aim is utilization of GNSS-enabled tools and Global Monitoring for Environment and Security (GMES) services to support search-and-rescue operations. The specific goal is a common, real-time COP that can be used by the local primary control unit/service command vehicle and by higher ranking administrations.

    screen-W
    The common operational picture (COP).

    Mission control, decision, and guidance was coordinated from a remote control room, where the mission leader, through the COP, knew everything about the position of accident vehicles, victims, rescue vehicles, and rescue team personnel, and could track their status and locations in real time. Local team chiefs on the ground also had access to this data through their mobile devices.

    The mission leader could plan resources for the ensuing phases of transport and treatment, and teams on the ground could communicate with each other via a simple mobile phone application, which replaced existing calls and radio voice signals and facilitated operations and coordination.

    GNSS receivers were installed in a fire engine using Galileo, GPS, and GLONASS signals to achieve best practice across all phases of emergency management. The Galileo signals were furnished by the Galileo Test and Development Environment (GATE), provided by eight transmitters atop the Alpine ridges surrounding Berchtesgaden.


Lars Holstein is project manager for Initiative Satellite Navigation Berchtesgadener Land.