“Seen & Heard” is a monthly feature of GPS World magazine, traveling the world to capture interesting and unusual news stories involving the GNSS/PNT industry.
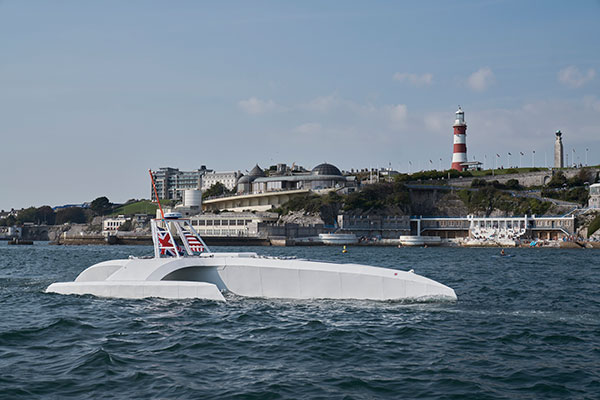
The Mayflower autonomous ship. (Photo: Tom Barnes for IBM)
No pilgrims needed aboard
The autonomous Mayflower trimaran launched Sept. 16 from Plymouth, England, on a mission to traverse oceans and gather vital environmental data, guided by Veripos GNSS and inertial measurement units from iXBlue and Silicon Sensing. Ocean research non-profit ProMare joined with IBM on the Mayflower Autonomous Ship — an artificial intelligence and solar-powered marine research vessel, two years in the making. Designed to provide a safe, flexible and cost-effective way of gathering data about the ocean, the Mayflower works in tandem with scientists and other autonomous vessels to help understand critical issues such as global warming, micro-plastic pollution and marine mammal conservation.
Photo: nycshooter/E+/Getty Images
A Guardian on the Bus
A school bus app aims to help monitor students’ exposure to others. App developer CalAmp’s Bus Guardian uses the same technology from its Here Comes the Bus app with an added layer of contact tracing. With Bus Guardian, parents can opt-in and invite their student to check on and off the bus. It uses telematics to convert a school bus into a contact tracing solution. Schools can deliver instant and actionable reports of ridership based on contact tracing — important if a student or driver becomes ill.
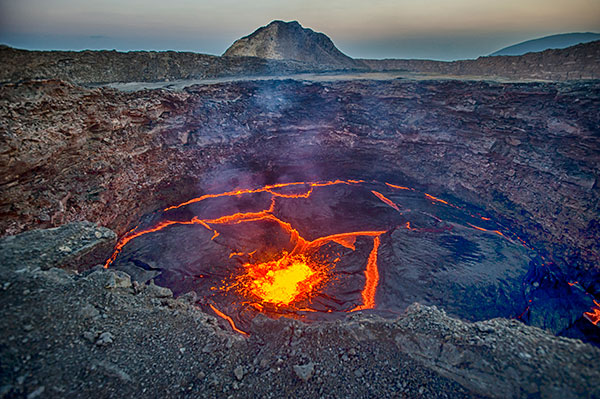
The Erta Ale volcano. (Photo: guenterguni/E+/Getty Image)
Rift splits Africa in two…eventually
GPS data is refining predictions of when Africa will split into two continents. In 5 to 10 million years , the Gulf of Aden and the Red Sea will flood the Afar region and the East African Rift Valley, creating a new ocean and continent. GPS data is precisely measuring ground movement as three tectonic plates peel away from each other at a triple junction, said Ken Macdonald, professor emeritus, University of California, Santa Barbara. “With GPS measurements, you can measure rates of movement down to a few millimeters per year,” Macdonald said. “As we get more and more measurements from GPS, we can get a much greater sense of what’s going on.”
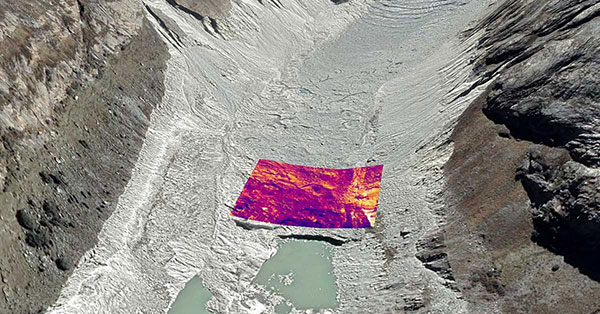
Image: Rosie Bisset
Dangerous Retreat
In a first for mapping glacier retreat in the Peruvian Andes, the CASCADA UK + Peru glacier project used a drone fitted with a FLIR Vue Pro R 640 thermal-imaging camera for insight. A thicker layer acts as insulation. Researcher Rosie Bisset, Edinburgh University, is building a mosaic of the images to better understand how surface cover is affecting the melt rate. The glaciers have shrunk by about 30% in the past few decades, and pose a serious threat to the water supply of in the Ancash region.
Why abandon well-worn mapping methods in current use?
It has to be for one or more forms of gain: time, money or staffpower. UAV-borne lidar can save a lot of field time, eliminate the need for site revisits, capture more data than previously possible, and provide a better product using more automated extraction tools.
Surveyors and other mappers must frequently develop a reliable surface model of an area about to undergo major construction. If it is new construction over native soil, then the area is often covered with vegetation ranging from short grass to very tall trees. By far the majority of these areas are surveyed using GPS, total stations, levels or some combination thereof, depending on the project. In any case, at least one trained individual, more often two or even three individuals, must walk the area collecting the necessary data with some form of survey equipment.
This is the tried-and-true methodology. It is easy to schedule, easy to estimate, and barring any field or office mistakes, absolutely reliable. Manually visiting a point in the field on return visits should yield similar, though not exact, results, at least within the tolerances of the equipment. It doesn’t matter if the temperatures are near freezing or over 100 degrees. It doesn’t matter if it is raining or sunny. It doesn’t matter if the grass is cut or if the leaves are on and in full glory. This is a very reliable method in all respects, assuming the proper tools and techniques are used.
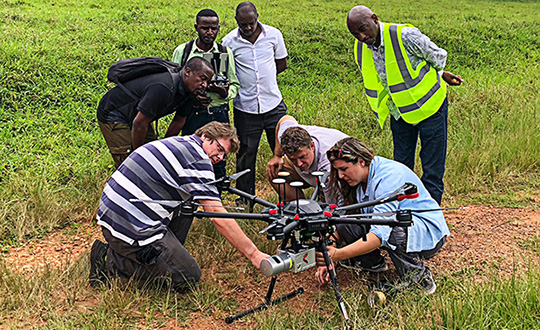
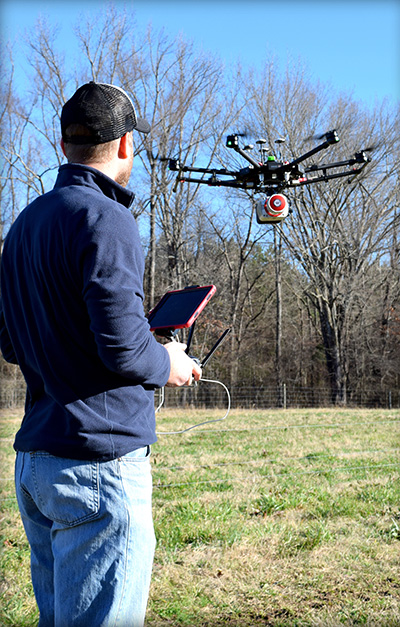
Piloting a lidar-equipped drone. (Photo: Bailie McRae)
How can this type of field survey be improved upon? First, is the product sufficient? Does the field crew reliably capture all the pertinent features? Did they get the location of the trees, buildings, poles and so on?
How many site visits are usually required to complete the average project?
What about the elevation data? Did they capture the drainage and breaklines sufficiently?
As always, the driving question is: Why change? Why abandon well-worn methods in current use?
It has to be for one or more forms of gain: time, money or manpower — which often equates to one or both of the first two terms.
When surveying with conventional equipment such as total stations, levels, and even GPS equipment, the likelihood of failure of a tried and true system is not very great. Comparatively, when using a UAV lidar system, not only are the stakes higher (as the equipment costs more), but the likelihood of an all-out failure is more likely and is definitely more devastating. There is no quick fix if your UAV crashes. It is more likely that the UAV will crash (usually due to operator error) than the lidar system itself will fail.
Facing these concerns, does one embrace a UAV lidar solution or hold to the tried and true?
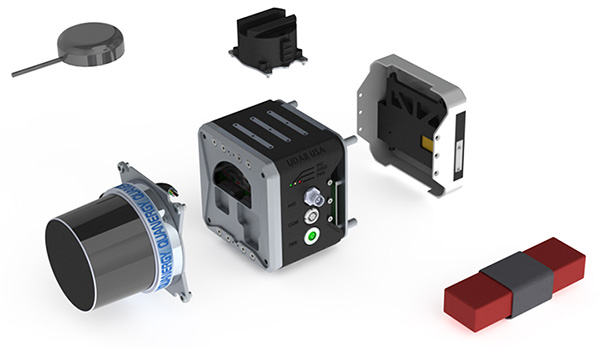
EQUIPMENT: Left to right, from top down: GPS antenna, laser head (Quanergy M8), detachable mount (car & UAV), computer and INS (GNSS receiver + IMU), interface plate, battery. (Photo: Lidar USA)
If it is important to get a heavily wooded 40- to 100-acre job collected and delivered as a surface at 1-foot contour accuracy (or maybe even 0.5 foot) in a single day, then UAV lidar is the tool for the job. UAV lidar can save a lot of field time, eliminate the need for site revisits, capture more data than previously possible, and allow for a better product using more automated extraction tools.
Accuracy. Often the client wants a 3D point cloud, or digital elevation model (DEM), which is not necessarily derived from lidar. If the site has no vegetation present, then an image-based solution should be sufficient.
However, most sites are initially covered with vegetation. In that case, an image solution from some sort of aerial camera will only provide a surface on the top of the vegetation — not what the client wants. While lidar may not be perfect, it can get to within 0.1 to 0.2 feet of the ground surface, in spite of grass or trees. For most initial design surveys, this is all that is required.
Money. Cost is perhaps the topic of greatest persuasion against lidar and in favor of an image-only solution. A lidar system is more expensive than most camera systems, but again the camera system simply cannot collect viable ground data in vegetated areas.
Time. Another factor is the time required to become profitable with the system, and the longevity of the system. In a good economy, it doesn’t take many 40-acre topo jobs to completely pay for a UAV lidar system. Once more, it is about time.
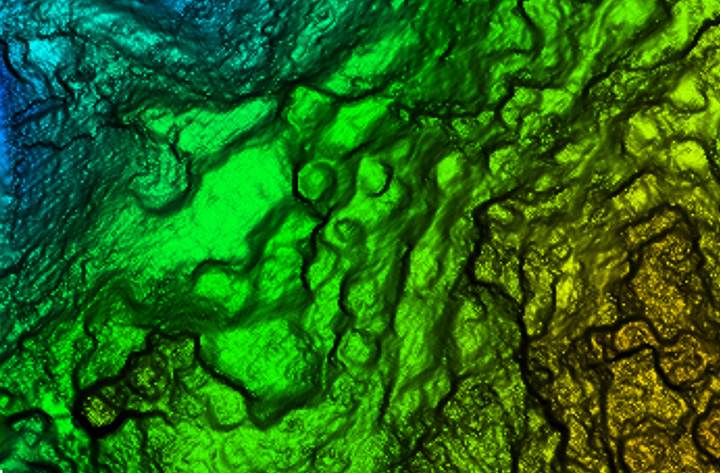
Broad overflight area of the cloud forest. (Image: Lidar USA)
As to product longevity, any new UAV product released today should be just as functional in five years. You may have to upgrade your UAV, but the lidar system will still be good for the jobs we’re discussing.
Lidar collects XYZ and intensity. It does not collect RGB values. This is a strike against lidar. While lidar data can be colorized with imagery captured from a camera on the same system as the lidar, or separately, this is generally discounted as being imprecise (not well aligned). Lidar does not inherently or directly capture color. However, imagery is 2D in nature and does not capture XYZ data.
Imagery can align with the lidar nearly perfectly; it is a matter of a good boresight.
UAV photogrammetry, or image-only solutions are amazing. They provide a wealth of information. They are complementary to and synergistic with UAV lidar.
The advantages of including a UAV lidar solution along with a UAV photogrammetry solution include:
the ability to measure at any time, day or night, in bright light or no light;
rapid surface generation (not instant, but fast);
flat surfaces, vertical walls, overhead structures — everything is collected without difficulty;
power lines, guy wires and so on are all collected directly,
bare-earth collection (multi-echoes and direct collection to ground, not just top of vegetation) is possible;
generally a much wider collection width and fewer flight lines.
Further, lidar can often penetrate dust, fog and mists.
Sensors and Their Issues
Bare earth classified surface of small site. (Image: Lidar USA)
Lidar does require an inertial navigation system (INS) and all of the controlling software. This generally makes the system more expensive. It also makes it able to more rapidly generate the final product.
Inertial Use with Lidar. An INS combines a GNSS receiver with an inertial measurement unit (IMU) and a lot of software and specialized filtering algorithms. It is essentially the central nervous system of a lidar system. The GNSS receiver provides universal timing such that every instrument including the IMU, scanner, cameras and others are all precisely time-stamped. This is key to proper data fusion. The GNSS receiver also provides positioning. The IMU is essential for determining proper orientation (roll, pitch, heading) as well as positioning at an extremely high data rate (2000 Hz) between the recorded GNSS epochs. If a GNSS event is missed (which shouldn’t happen on a UAV) the IMU bridges the gap between epochs. Large gaps can lead to positional drift, but shouldn’t happen on a UAV.
The real-time software maintains satellite lock (coupling with the IMU as necessary), while the post-processing software, using a post-process kinematic (PPK) process, provides the best possible solution of the trajectory. It solves the trajectory forward, backward and over and over with different parameters until it reaches an optimum solution. So it’s not just the hardware that makes the system more expensive, it’s also the software.
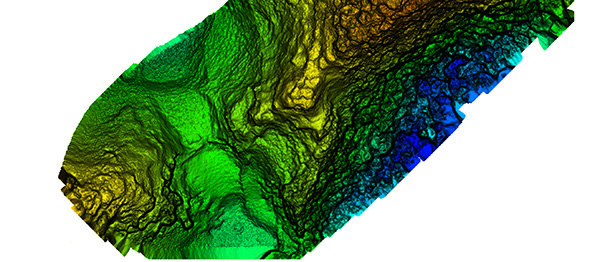
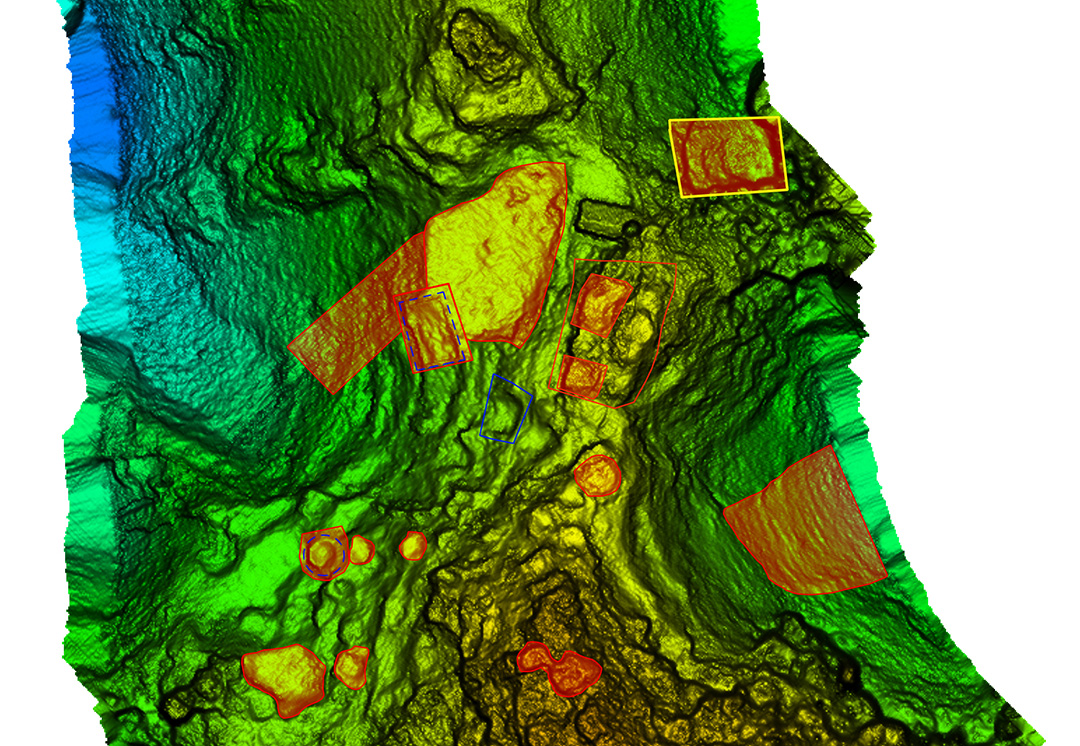
Closer site inspection — notice non-natural occurring mounds. (Image: Lidar USA)
Double Duty? There is some confusion as to the INS on a UAV. Can the INS used to navigate the drone be used for the lidar system as well, to save money? Yes, and no. Yes it can, with the proper integration — however, the INS to navigate the drone is usually far, far inferior to that required by a lidar system. So, No. Also, the lidar system really should be portable from the UAV to a car to maximize use. So the systems need to remain separate, for the most part.
Height and Width. Another UAV sensor issue concerning lidar is often very confusing. Some sensors are only good for 40- to 60-meter flying heights; some are useful to 200 or more meters. Depending upon where you work, this may be of no concern. In the U.S., we are limited to 120 meters above ground level (AGL) in any case. In most areas, being able to fly at 80 to 100 meters AGL is sufficient as long as accuracy and point density are not compromised.
Scan width varies a lot as well. The scan width of the shorter range systems is typically no more than 150 meters of usable area, whereas others can scan 500 meters wide. Consider that most surveys are 40 acres, maybe up to 100 acres, and we find that one flight is all that is necessary even with the least-expensive system. Do you need 500 meters wide? The answer depends upon your business model. If you are doing miles and miles of transmission corridor work, you probably need the greater width.
Ground Accuracy. What matters here is not so much positioning accuracy but point-cloud thickness. This can be difficult to understand and is a worthy subject by itself. The question is whether you can deliver the product you most often are required to deliver with the system. If you deliver 1-foot contour projects, can you achieve this with a 6-centimeter system or do you have to have a much more costly 1-centimeter system? Clearly the 1-centimeter system is much better, but what do you need to deliver?
Intensity is another concern. Most of the less expensive systems don’t do a very good job delivering a “b+w image-like” point cloud; that is, their intensity falls off dramatically with distance. Others do an amazing job. Is this important? Can it be overcome with colorization? If you were doing your work conventionally, would you be delivering an image-like surface? I doubt it. Certainly the intensity is nice to have and the information can be very useful in automated processing, but is it worth the price difference?
Ultimate Test: the Jungle
Recently we undertook an adventure with some explorers in South America, near the city of Jaen, Peru. A crew filming a new TV show for the Travel Channel sought to understand more about the ancient civilization of Chachapoyas, Warriors of the Clouds. Little is known about this race of people because they were conquered by the Incas in the 16th century and shortly thereafter by the Spanish conquistadores.
Our team was to help identify structures in an area called Leymebamba, about four hours’ drive from Jaen, hidden beneath the deep Amazon cloud forests — definitely not a typical North American forest. These forests are not only very dense with vegetation but with cloud cover that is generally at the level of the canopy.
Many centuries after the Chachapoyas have vanished, structural remains are concealed not only by the clouds and the canopy, but buried beneath several feet of dirt and a lot of living and long-since-dead organic matter. Only the most pronounced features can be found by the naked eye or a traditional survey.
Lidar brings a huge advantage in that it can get a much better approximation of the ground as well as any other hard surface such as walls, fences, trails, buildings and towers. By blanketing an area with dozens if not hundreds of points per square meter, post-processing software can “peel” the living vegetation away from the ground surface. This ground-classified data can then be analyzed by a trained scientist to determine if there are in fact any revelations to be had.
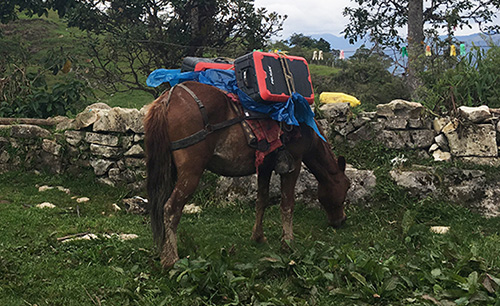
In our case, we were using an A-series high-definition lidar system, best flown at 40 to 60 meters and, in extremely dense vegetation, at 5 to 6 meters/second. Collecting 700,000 points per second enables us to potentially capture more than 400 points per square meter in a single pass. The area we were to scan varied considerably in terrain and had very little to offer that was flat and open. In fact, to get to the site, we had to pack several mountain horses with the UAV, several sets of batteries, and the scanner as they traveled down very steep terrain about 900 feet to the base of the hill to be scanned.
We’ve said we can scan from nearly anything moving, but we’ve never done it from a horse. Well, we weren’t actually scanning, but it was pretty close.
UAV and lidar, bound for the cloud forest. (Photo: Forrest Briggs)
Finding a suitable take-off and landing area posed a challenge. Due to vegetation and terrain, only small areas could be scanned in a single flight, as the vehicle would quickly leave line-of-sight (LOS). While LOS may not be an issue legally in this area, it remains a real concern: we always want our equipment to come home at the end of the mission.
We learned something we hadn’t anticipated along this journey regarding weather. The day would start out around 80° F; around 2 p.m. it would rain, and the rest of the day would close out much cooler. Does this matter? Yes, if you are now wet and cold with several hours ahead of you. It seems there is always some new surprise.
As the area was remote, with no internet access, the existing map data for mission planning had to be downloaded prior to visiting the site. Each lidar mission was preceded by a scout flight using a small UAV to help ensure safety and appropriate flying height per flight line.
Situating the Base. Projects like this always pose dilemmas. Finding a good place for a GPS base station in a cloud forest is no small task. Normally we would put the base station on a known reference point so we can easily join the data with other projects. In this case we didn’t have any such concern. We simply needed an area with a clear view of the sky; usually this means no obstructions 12 degrees above the horizon. However, in a forest and in the mountains, you take what you can get. In our case, we found a rock outcropping and placed the unit on it with no tripod. It didn’t give us the best solution, but it worked.
Ideally we leave the base running for hours to get a good solution. Since we had multiple sites to scan, this wasn’t a problem. All sites were within walking distance of the base, so there was no concern about being too far away and adding more problems to the project. In PPK mode we can easily be 10 or 20 kilometers from the base with no concern.
Other Forest Challenges. In-field processing, far from internet or electrical supply, requires very judicious battery and especially laptop usage. The lack of many things we take for granted can quickly be a show-stopper if necessary (maybe even a phone call).
Even back at the hotel where power was available — don’t count on it. While the film crew and archeologists are eager to see results, everybody has to wait. No power.
Supposedly this is common and only lasts an hour. Three hours pass and everybody goes to bed but the lidar crew.
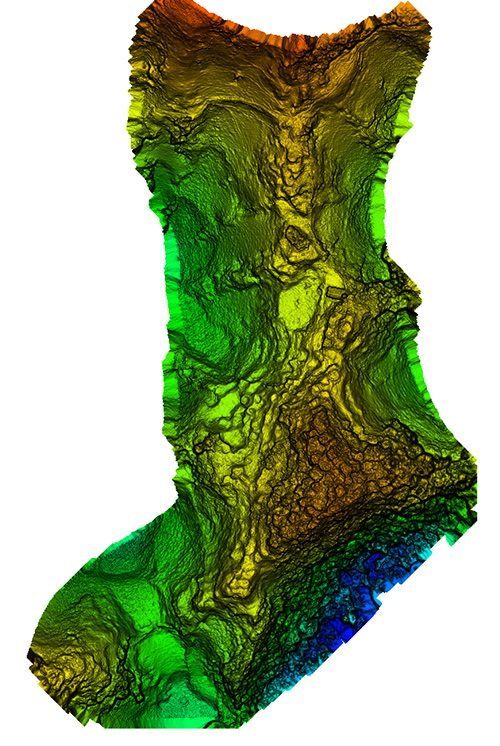
Areas of interest to archeologist — lots of them. (Image: Lidar USA)
Finding the ground should be easy, but a new version of software has been installed. There’s a kink in our plans. Finally after some internet help (a call back home), the right settings are found and the software begins peeling away the vegetation to reveal the ground. The top of each hill (several were scanned) looked like a primitive fortress with 20 to 30 cylindrical structures clearly spread over the top of each site. On one site we identified a tower at least 3 meters in height.
While areas like this could be scanned with a conventional aerial system, collecting much larger areas, the UAV lidar solution offers several distinct advantages. One of these is just a quick recon of the area. Physically being on the ground at the site makes the team much more aware of what is going on. Secondly is the far, far greater density of points and the ability to collect much more off-nadir, allowing for more of the vertical structure to be captured.
In the end, our mission was successful. The UAVs were ported by horseback up and down precarious trails. The lidar worked great. None of the batteries failed. The drones didn’t crash. The archeologists were thrilled with the results, having found several new structures and a tower unknown to them. Once again, UAV lidar proved to be the best tool for the job. Indiana Jones out!
Manufacturers
As both INS sensors and lidar scanners continue to change, this allows us to make quite a variety of configurable systems. For this particular project, we used our Snoopy INS (OEM) with a Quanergy M8 Ultra scanner. The Snoopy INS uses a NovAtel OEM719 GNSS receiver to ensure best performance with GNSS collection. Other options for the INS include the NovAtel STIM300 (Sensonor IMU), VectorNav VN-300 and Trimble Applanix AP family. For scanners we support all Velodyne scanners including the latest AlphaPuck, Quanergy, Riegl and several more. Of course, for cameras there are the ever-popular FLIR, Sentera, PhaseOne and DJI. GPS base stations are not all equal, but most will work as long as they log at least L1/L2 GPS at 1Hz.
JEFF FAGERMAN is a a professional surveyor and certified photogrammetrist. He has a master’s degree in photogrammetry from Purdue University and worked as a photogrammetric software developer at Intergraph before starting Fagerman Technologies. Now known as Lidar USA, the company focuses on mobile lidar aboard UAVs.
Two flights were conducted at 120 meters and 100 meters to gather data to help the Peruvian government protect the site from erosion and wear from tourism. (Photo: Trimble)
High up in the Peruvian Andes Mountains lies Machu Picchu, an Incan citadel built in the 15th century, now a UNESCO World Heritage Site.
In the fall of 2014, Trimble demonstrated its UX5 Unmanned Aircraft System (UAS) — along with the Trimble Business Center and Inpho UASMaster processing software — at the famed archaeological site.
Machu Picchu is under the threat of landslides and erosion — plus the site experiences heavy rains known to wash away roads. It has also seen an increase in tourism over the years.
As a consequence, the preservation of the landmark is a growing concern for the Peruvian government. Data captured by a fixed-wing UAS is expected to help the many organizations that govern and preserve the site to visualize and monitor the location.
Getting to Machu Picchu is a challenge in itself. A 3.5-hour train ride from the city of Cusco takes visitors almost 8,000 feet above sea level. When a Trimble team visited the site, access to Machu Picchu was arranged well in advance by its distribution partner Geosystems and the Peruvian Ministry of Culture.
Orthophoto of the Macchu Pichu site. (Image: Trimble)
The day of the flight, a small area on one of the terraces was cleared of tourists (but not local llamas) for the flight. Two flights were conducted at 120 meters and 100 meters for enhanced data. Along with Trimble and Geosystems representatives, local archaeologists and surveyors from the Ministry of Culture attended the flight, which went off without any challenges.
With the flight complete, Trimble and Geosystems went to work processing the data immediately in Trimble Business Center and Inpho UASMaster. Trimble Business Center allowed the data to be quickly processed into high-quality point clouds and orthophotos while Inpho UASMaster offers feature-rich photogrammetry workflows.
The following day, Trimble and Geosystems presented government officials with orthophotos and a 3D point cloud model.