Tag: plate tectonics

  • Geodesy without math equations: Is that possible?

    Geodesy without math equations: Is that possible?

    Geodesy without math equations: Is that possible? The answer is no, but basic geodetic concepts can be described without using complex math equations.

    My previous column addressed the geodesy crisis in the United States. (See also this.) The newsletter was highlighted on LinkedIn (thanks, Jay); more than 235 individuals reacted to the post and there were 25 reposts.

    I’m pleased so many people are interested in highlighting the discussion of the inverted pyramid. One reader of my column asked for material for non-geodesists to obtain a better understanding of geodetic concepts.

    Geodesy does involve advanced mathematics that may not be familiar to some people. That said, there are various online lessons and tutorials that describe the basic concepts without using complex math equations.

    As mentioned in my previous column, geodesy is involved with anything related to positioning. For example, have you ever wondered how your phone appears to know where you are on a digital map while you’re walking or driving down the street? Geodesy provides the foundation for all geospatial products and services.

    Image: Dave Zilkoski
    Image: Dave Zilkoski

    Location on a Map

    A goal of mine has always been to get individuals (young and old) interested in obtaining a better understanding of geodesy. In my opinion, high schools and colleges should include courses that explain to students how their phones know where they are, why the Earth is not a sphere, how the movement of tectonic plates are measured and why, basic concepts of how satellites orbit the earth, and how geographic coordinates are important to making maps and their use in establishing an accurate geographic information system (GIS).

    A good first step is to get high school teachers interested in the topic. When I was employed by the National Geodetic Survey (NGS), a group of us worked with local high school students to map their football field using GPS. They acquired observations in the field, and then downloaded the coordinates into their GIS. The teacher was instrumental in integrating the application into the students’ curriculum.

    A reader of my last column suggested I provide concrete, meaningful things to lower the barrier of entry. I’m not exactly sure how to lower the barrier of entry — geodesy does require an individual to have a certain level of mathematical knowledge.

    Since I retired from NGS, I have helped homeschool my eight grandkids. The one thing that I’ve found is that young students apparently either “like” math or they “hate” math. At least with my grandkids, there doesn’t seem to be an in between.

    At this moment, I don’t believe any of my grandkids will become geodesists; well, actually, there’s still a possibility that one may have a “love for mathematics.” It appears that most students don’t really see a reason to learn math. They can use their phones or calculators to do what they need.

    The reader suggested that the geodesy community could publish free, high-quality, web-based resources for the public. The reader made the following suggestions:

    • A set of 3D-printable designs for rudimentary survey tools; alternatively, how to acquire/build the tools in the most economical way possible. Even something that would be considered a “toy” that can be given to a child would be good.
    • A list of software tools (preferably open source) relevant to the subject and how to use them in this context.
    • Introductory material intended for young audiences.

    This column will provide some free online lessons and tutorials that describe the concepts associated with geodesy and surveying. Some of the online videos are at a level for young audiences, and some are aimed at individuals with more advanced education. Let’s start with the young audience.

    Lessons for Kids

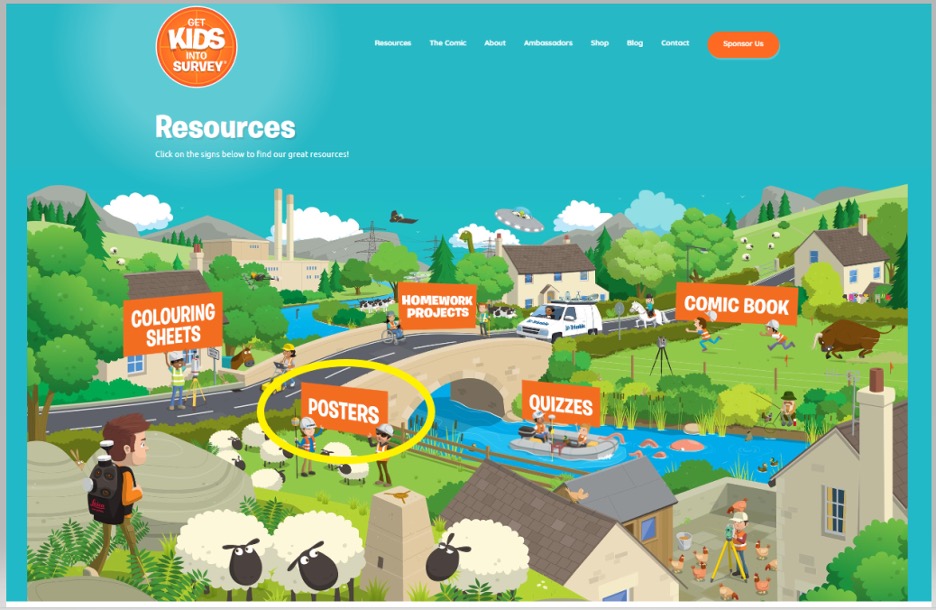
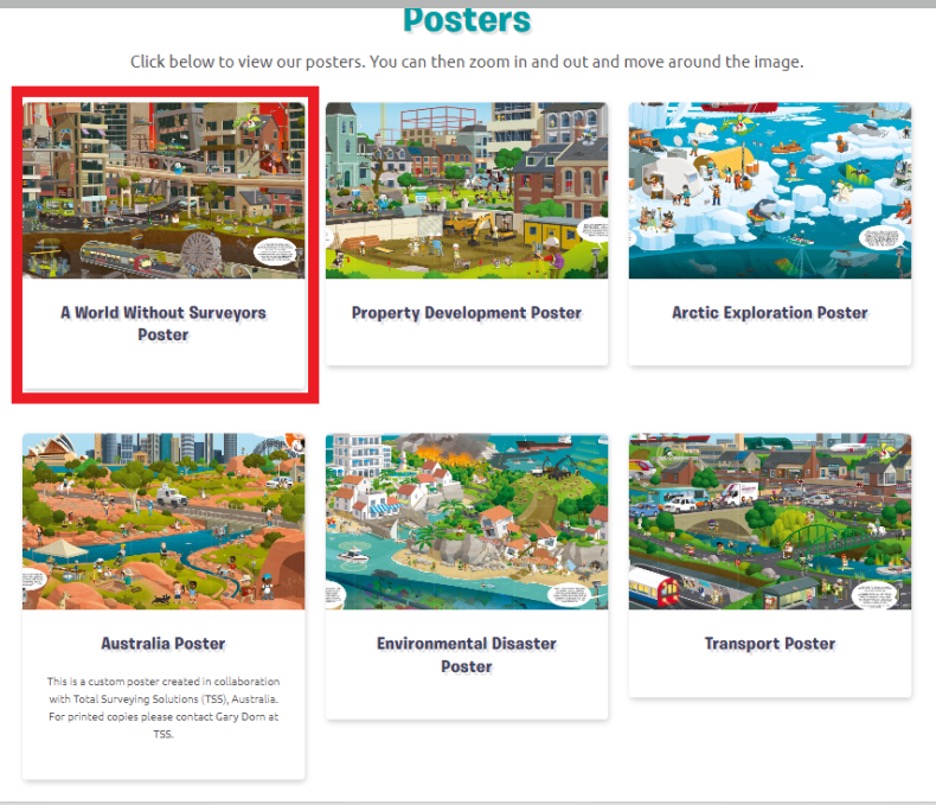
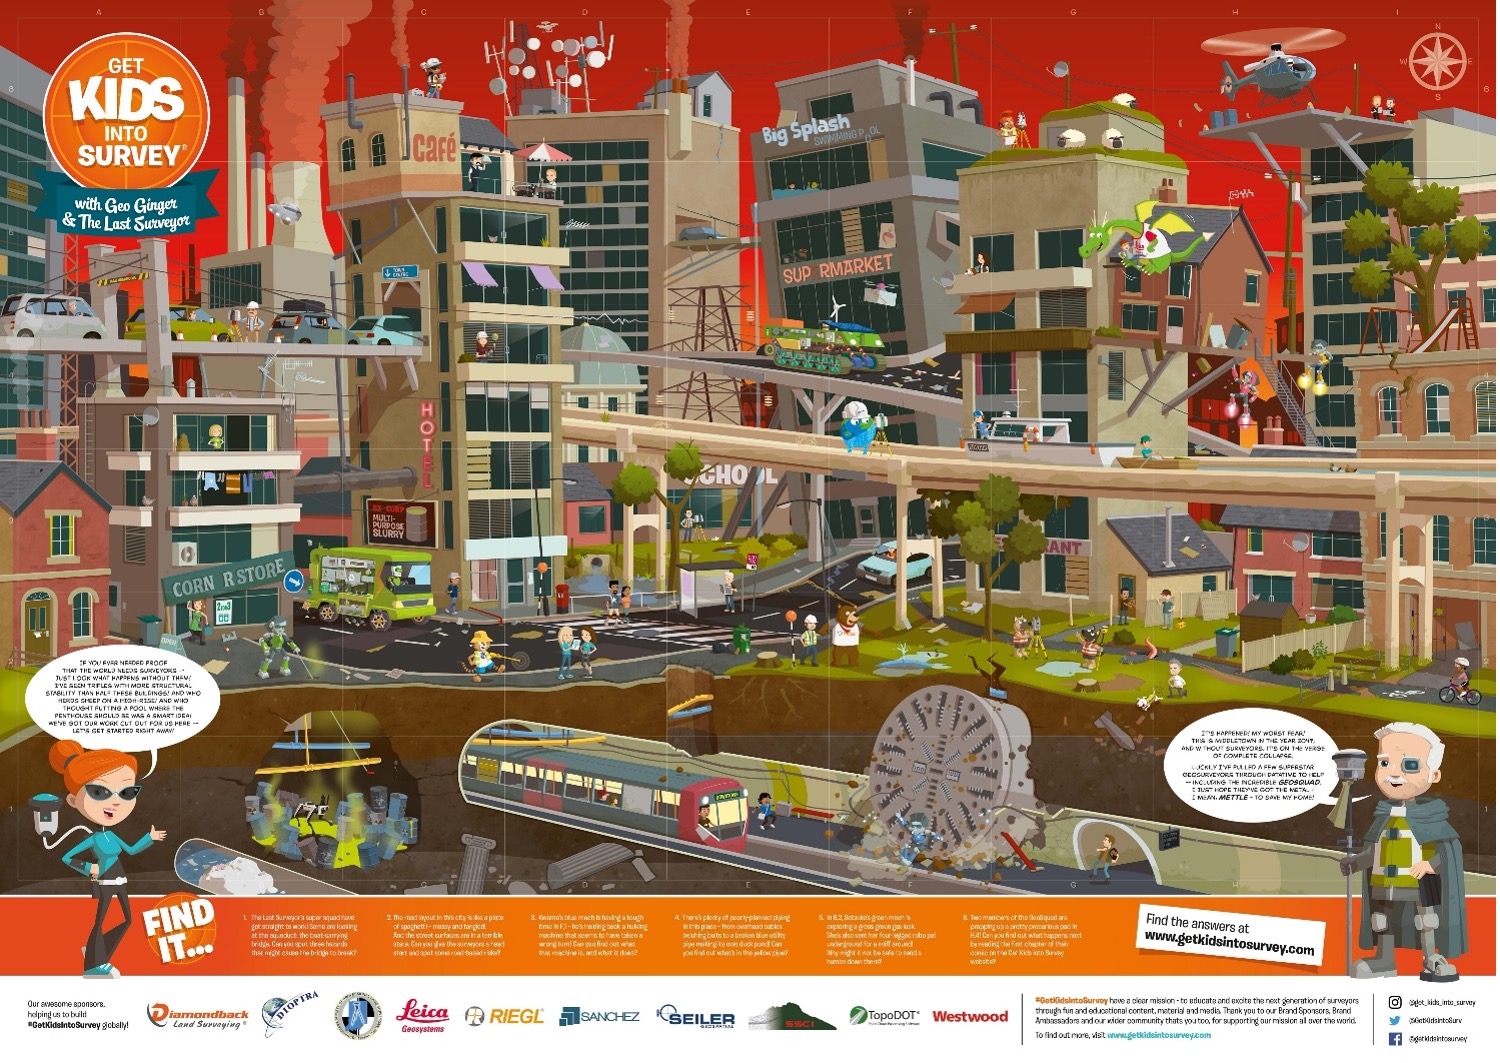
    The website “Get Kids into Survey” provides materials focused on kids. The website states: “Bringing young people into the exciting world of survey through pioneering content and engaging experiences.” See the boxes titled “Get Kids into Survey Website,” “Get Kids into Survey Website – Poster Page,” and “Get Kids into Survey Website – World Without Surveyors Poster.”

    Get Kids into Survey Website

    Photo:
    Screenshot: Get Kids lnto Survey

    Get Kids into Survey Website – Poster Page

    Screenshot: Get Kids into Survey
    Screenshot: Get Kids into Survey

    Get Kids into Survey Website – World Without Surveyors Poster

    Screenshot: Get Kids into Survey
    Screenshot: Get Kids into Survey

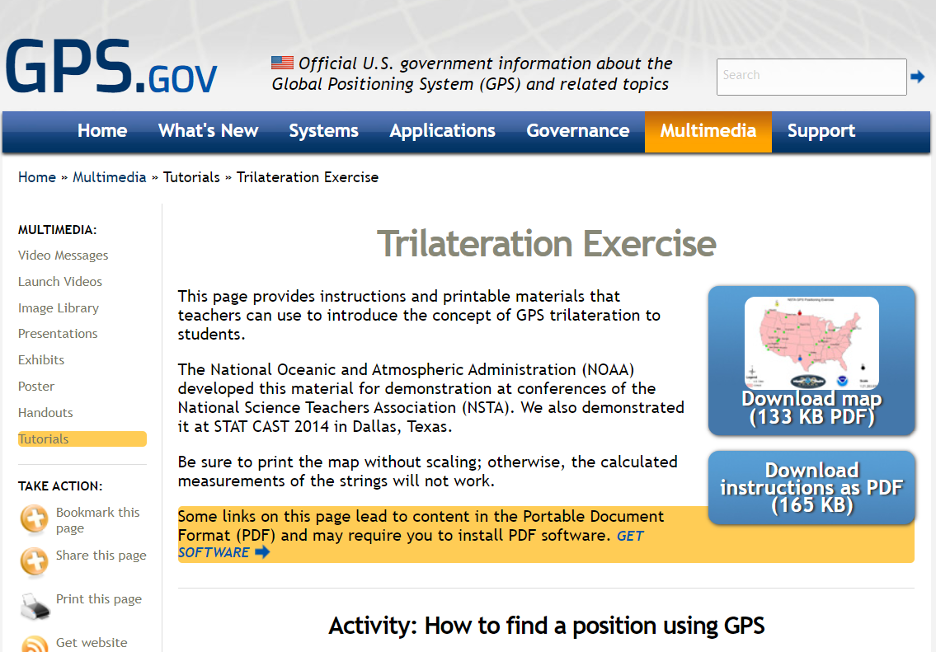
    The GPS.gov website has lessons describing GPS that are designed for kids. One lesson introduces the concept of GPS trilateration. The lesson explains how GPS positioning works on two basic mathematical concepts:

    1. trilateration, which literally means positioning from three distances, and
    2. the relationship between distance traveled, rate (speed) of travel, and amount of time spent traveling.

    This was developed by NGS for a National Science Teachers Association Conference. You can download both the instructions and map.’

    GPS Trilateration Lesson

    Photo:
    Screenshot: GPS.gov website

    The following are several videos that describe the concept of trilateration.

    This video explains trilateration and how the GPS ranges (distances from the satellite to the receiver) are computed.

    This video uses distances on a map to describe trilateration.

    Here is a detailed description of trilateration and why you need the fourth satellite.

    Here is a detailed description of how GPS works.

    Now, let’s look at some free online lessons and tutorials that describe the concepts associated with geodesy. As previously stated, some of the online videos are at a level for young audiences, and some are aimed at individuals with more advanced education. Most of them describe the concepts using diagrams with narratives, and without complex math equations. NGS provides a number of videos that can be downloaded here.

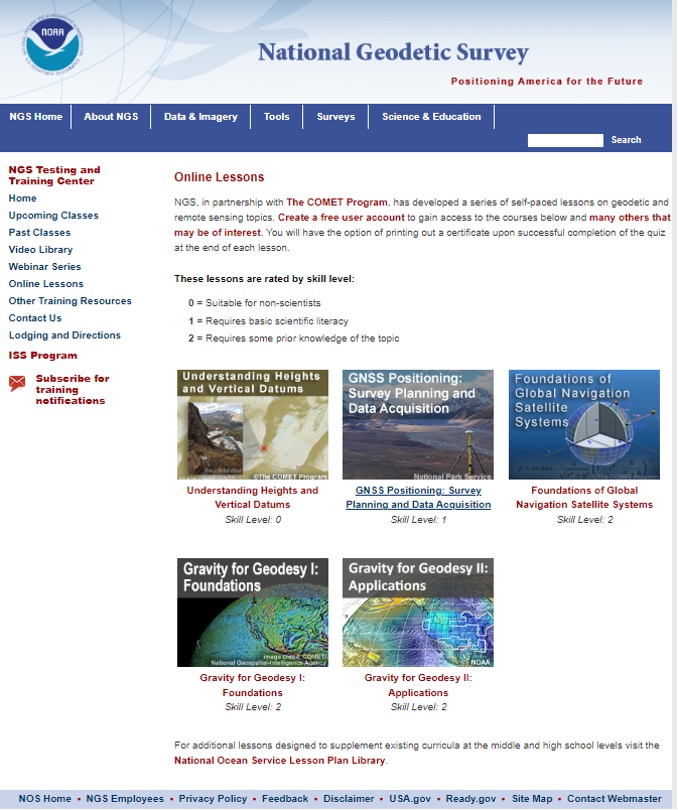
    NGS, in partnership with the COMET program, has developed a series of self-paced lessons on geodetic and remote sensing topics. Users have to create a free user account to gain access to the courses. Users will have the option of printing out a certificate upon successful completion of a quiz at the end of each lesson.

    The lessons are rated by skill level ranging from “Suitable for Non-Scientists” to “Requires some Prior Knowledge of the Topic.”

    The COMET program provides teaching and training resources for the geoscience community. All of the content is completely free, but an account does need to be created. The COMET program is part of the University Corporation for Atmospheric Research (UCAR) Community Programs.

    NGS Online Lessons

    Screenshot: NGS Website
    Screenshot: NGS Website

    NGS and COMET Educational Videos

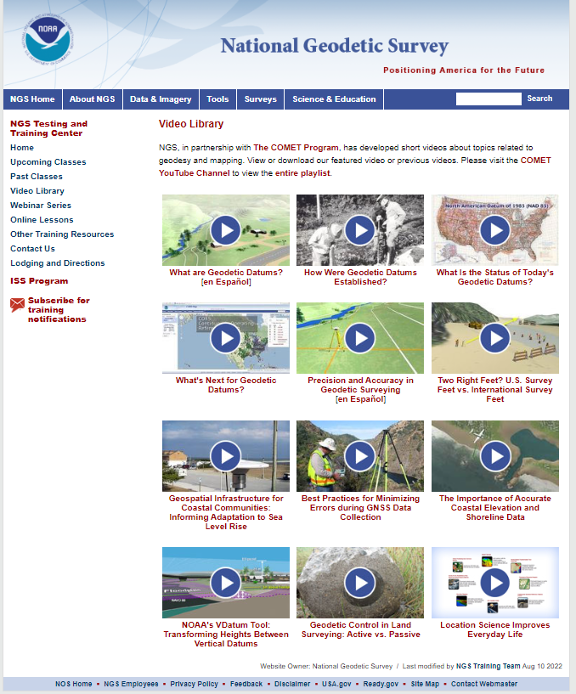
    NGS also has a website that contains educational videos. Again, NGS, in partnership with the COMET Program, has developed short videos on topics related to geodesy and mapping.

    NGS Educational Videos

    Screenshot: NGS Website
    Screenshot: NGS Website

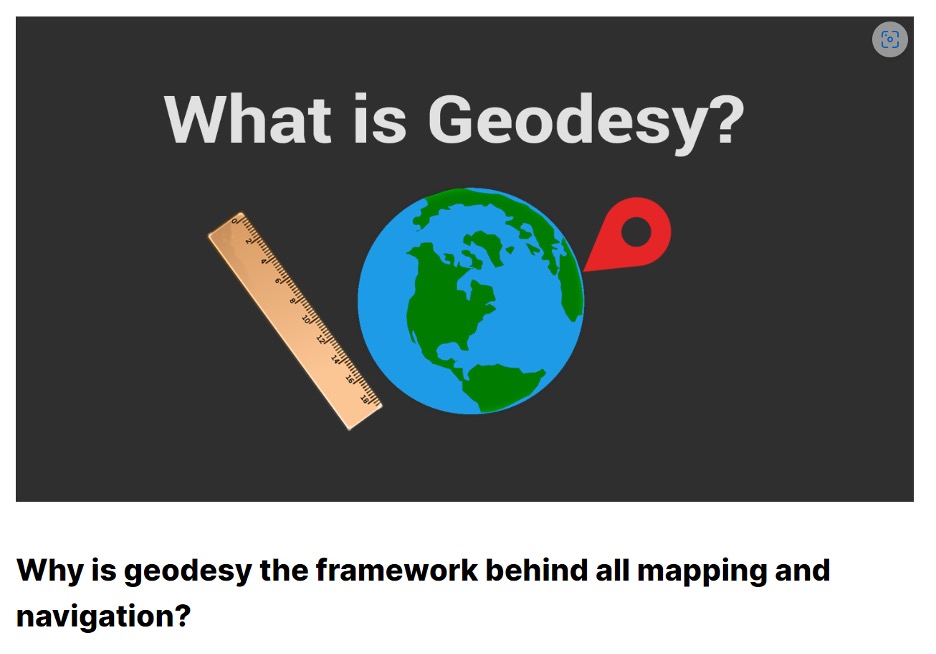
    This link provides a tutorial on “Why is geodesy the framework behind all mapping and navigation?” The article states. “If you think about it, the whole field of geomatics lies on the shoulders of geodesists. Because it’s really geodesy that is the framework behind all surveying, mapping and navigation.”

    What Is Geodesy?

    Screenshot: Gisgeography Website
    Screenshot: Gisgeography Website

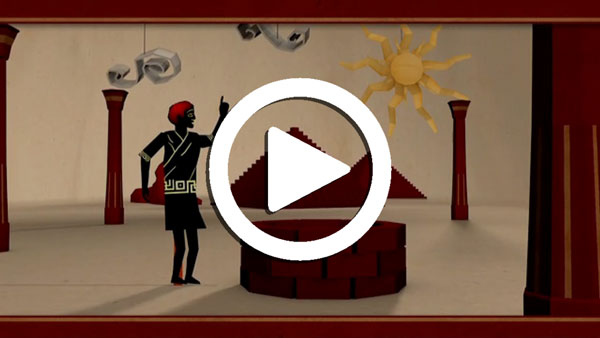
    NASA’s Eratosthenes Estimating the Circumference of the Earth by Looking Down a Well

    NASA offers a video titled “Looking Down a Well: A Brief History of Geodesy.” This video explains how it all started when Eratosthenes estimated the circumference of the Earth by looking down a well. It highlights how, over time, the field of geodesy has expanded and evolved dramatically, and how NASA uses technology such as radio telescopes, ground surveys, and satellites to contribute.

    NASA’s Video on Looking Down a Well

    Photo:

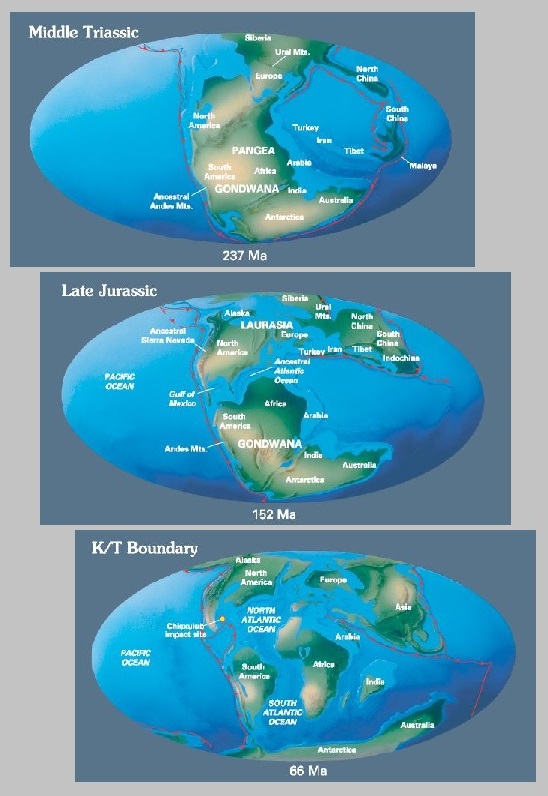
    UNAVCO Measures Plate Tectonics with Geodesy

    UNAVCO, a non-profit university-governed consortium, facilitates geoscience research and education using geodesy. UNAVCO has a video that describes the tectonic plates and how geodesists measure their movements. Another UNAVCO video describes what geodesy actually is, as well as geodesy’s application in our everyday lives (UNAVCO’s 2017 USIP geoscience video production). Visit UNAVCO’s website to learn more about its mission.

    Geodetic Software Tools

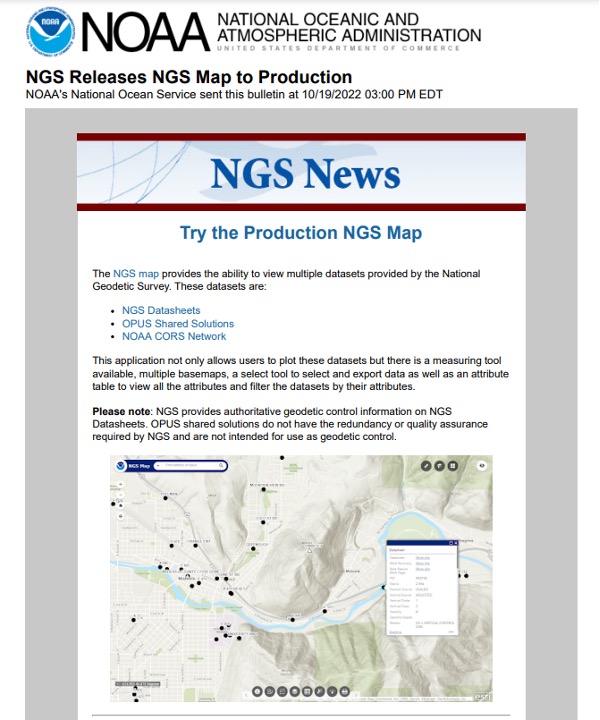
    NGS provides tools that focused on meeting the needs of the surveying and mapping community. A few may be of interest to non-geodetic individuals. A map tool can be used to locate marks near someone’s location.

    Production NGS Map

    Screenshot: NGS Website
    Screenshot: NGS Website

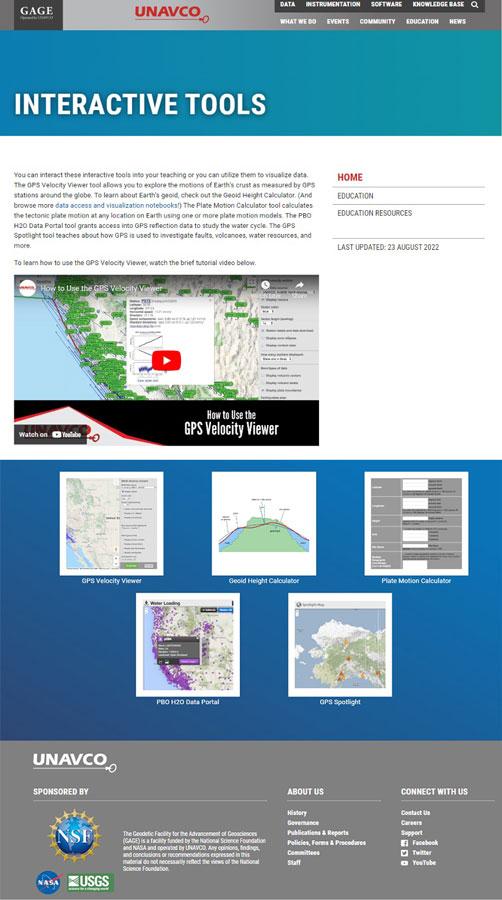
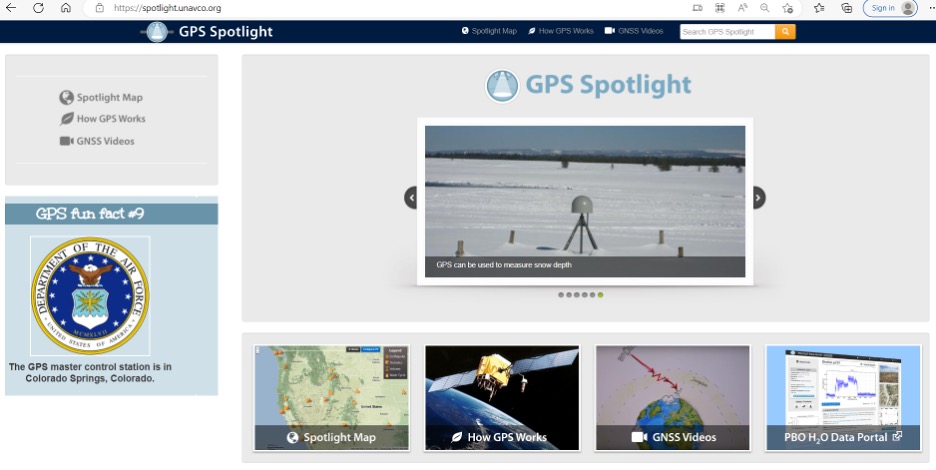
    UNAVCO also has interactive tools that may be of interest to geospatial users. See the boxes below titled “UNAVCO Interactive Tools” and “UNAVCO Spotlight.”

    Screenshot: UNAVCO Website
    Screenshot: UNAVCO Website
    Screenshot: UNAVCO Website
    Screenshot: UNAVCO Website

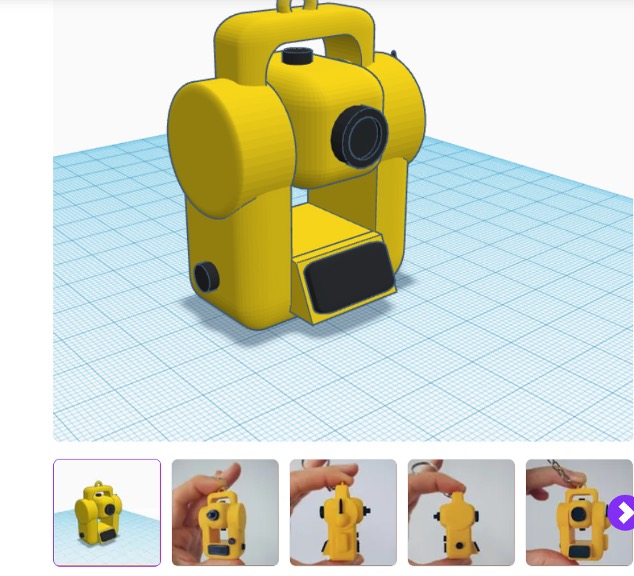
    3D Printer of Surveying Equipment

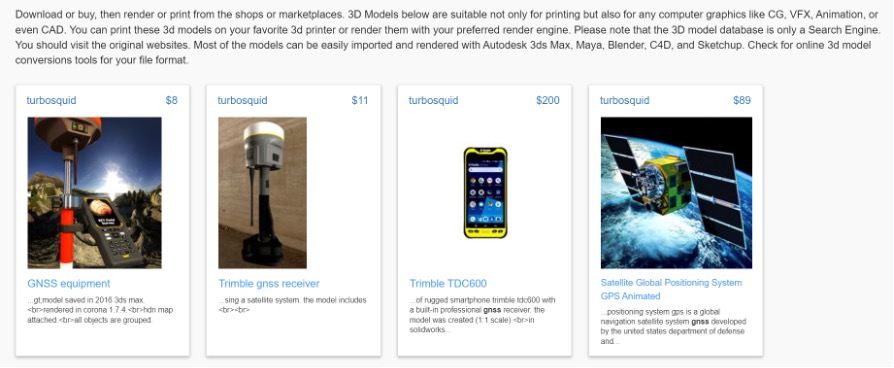
    Now, let’s address the 3D printing of surveying equipment and tools. I’m not familiar with using a 3D printer, but I found several websites that provide information on surveying equipment. Some of the sites provide free information and others charge for their services. See the websites 3D Printer of Total Station and 3D Printer of GNSS Equipment.

    3D Printer of Total Station

    Screenshot: CULTS Website
    Screenshot: CULTS Website

    3D Printer of GNSS Equipment

    Screenshot: 3dmdb Website
    Screenshot: 3dmdb Website

    I’m pleased a lot of people are interested in highlighting the discussion of the inverted pyramid. As commented by several individuals in the LinkedIn responses, the surveying and remote sensing (which includes photogrammetry) communities are experiencing the same crisis as geodesy. In my opinion, they are all related, because the surveying and mapping community provides tools other disciplines use.

    As stated in my last column, the surveying and mapping community can do the following to help:

    • actively market geodesy in high schools as a rewarding career for the math stars before college entry
    • build back, support and sponsor geodesy programs at select universities; this support needs to be strategic with backing from the highest levels of the U.S. government
    • encourage U.S. government support in the form of grants, professional development of staff, and research collaborations/affiliations.

    As previously mentioned, one of my goals has always been to get individuals (young and old) interested in obtaining a better understanding of geodesy. I hope this column helps to whet the appetite of some individuals to obtain a better knowledge of geodesy. Maybe even some high school and college teachers will introduce geodetic concepts in their lectures.

    Writing about the geodesy crisis is a good first step, but we need to find champions that can influence high school and university teachers and administrators, federal and state government program managers, and congressional representatives.

    Please feel free to email me at [email protected] if you have suggestions on how to lower the barrier of entry into the world of geodesy.

  • Coordinating surveyors on where we draw the lines

    Coordinating surveyors on where we draw the lines

    Technology changes the rules of the game, and surveying may be more in its crosshairs than the profession will admit

    Maps have existed for centuries. The lines on maps indicating the boundaries of political and administrative units — cities, counties, states, and countries — are graphic representations of the limits of those entities. These lines don’t, however, typically exist in real life. There isn’t a large line between the United States and Canada stretching from the Pacific Ocean, through the Great Lakes, and onto the Atlantic Ocean.

    The same goes for latitude and longitude lines on maps and globes. The public generally accepts the various delineations on maps as being somewhat accurate with an unwritten level of trust in those who have produced these maps.


    Definition

    trust: assured reliance on the character, ability, strength, or truth of someone or something.


    Here are the guidelines surveyors use for determining surveys.

    1. lines physically verified in the field and proven from evidence
    2. monuments and/or boundaries set and called for within legal descriptions
      • natural monuments
      • artificial monuments
    3. adjoiners (to determine junior/senior rights)
    4. courses
      • bearings, then distances (metes and bounds states)
      • distances, then bearings (public land survey states)
    5. recitation of area
      • controlling description
      • evidentiary description
    6. coordinates: local and/or geodetic

    Surveyors rely on physical monuments, title documents and evidence of occupation to assist with the establishment of not just major dividing lines, but all lines of property, public or private. Finding, setting and honoring physical monuments has been a significant character trait of the surveyor for as long as maps have existed.

    Monuments are placed to determine the endpoints of these lines as depicted on maps or plats, but what happens when technology introduces new ways to re-establish these lines? What will happen to our monuments when technology — more specifically those who utilize them — deems them obsolete?

    The guidelines above are known as “priority of calls” or “rules of construction” by the surveying community. These items have provided the instructions for surveyors to follow in retracement of lines for many years. However, like nearly everything else in our modern world, technology has a hand in modernizing even this time-honored “surveyor’s code of retracement.”

    Who would have guessed that the rotary phone dial would give way to touch-tone buttons, that the system would jump from landlines to cellular and satellite signals to remote handsets, then progress to receivers evolving away from physical buttons to touchscreens?

    Technology changes the rules of the game, and surveying may be more in its crosshairs than the profession will admit.

    Here come the numbers

    Note that the last entry in the above guidelines for survey retracement is “coordinates.” In accordance with most accepted lists, coordinates can be local or geodetic. These coordinate values are generated by surveyors, geodesists and public agencies; they can be found on plats, and in records and websites kept by government agencies.

    Now that we are more than two decades into the 21st century, it would be safe to say that most of the surveying profession uses an established geodetic coordinate system. The use of GNSS receivers is widely accepted as normal practice by many surveyors because these systems are much more user friendly than in years past. Additional constellations have added to the availability and accuracy of GNSS positional values, so utilizing state plane coordinates has become the norm.

    We are now surrounded by something that has an incredible impact on our profession and the world around us. We are placing trust in a georeferenced coordinate system that cannot be identified by any of our senses, like we can with a physical monument.

    A coordinate cannot be seen, touched, tasted, heard or smelled.

    We are placing our full trust in a reliable position on Earth as determined by our GNSS receiver working within a published coordinate system. Because of these advancements in technology, a new generation of geospatialists is insisting we should revise the way we survey, because technology provides much higher precision and accuracy.

    Just like lines on a map or plat, coordinates only exist as a calculation of a position on the face of Earth. So why is there animosity in trusting coordinates over the more traditional items on the list of retracement guidelines? It may have to do with the fact that the ground we are surveying is not in the same place it was a short time ago. Depending on where you live, it may have moved more than you think. For more information on the shifting ground we live on, let us dig into some research about our continents.

    Pangea: Description of moving land masses

    (Text from USGS.gov)

    From about 300-200 million years ago (late Paleozoic Era until the very late Triassic), the continent we now know as North America was continuous with Africa, South America and Europe. They all existed as a single continent called Pangea. Pangea first began to be torn apart when a three-pronged fissure grew between Africa, South America and North America. Rifting began as magma welled up through the weakness in the crust, creating a volcanic rift zone. Volcanic eruptions spewed ash and volcanic debris across the landscape as these severed continent-sized fragments of Pangea diverged. The gash between the spreading continents gradually grew to form a new ocean basin, the Atlantic. The rift zone known as the mid-Atlantic ridge continued to provide the raw volcanic materials for the expanding ocean basin.

    Meanwhile, North America was slowly pushed westward away from the rift zone. The thick continental crust that made up the new east coast collapsed into a series of down-dropped fault blocks that roughly parallel today’s coastline. At first, the hot, faulted edge of the continent was high and buoyant relative to the new ocean basin. As the edge of North America moved away from the hot rift zone, it began to cool and subside beneath the new Atlantic Ocean. This once-active divergent plate boundary became the passive, trailing edge of westward moving North America. In plate tectonic terms, the Atlantic Plain is known as a classic example of a passive continental margin.

    Today, the Mesozoic and Cenozoic sedimentary rock layers that lie beneath much of the coastal plain and fringing continental shelf remain nearly horizontal.

    Image: USGS
    Image: USGS

    In geologic terms, a plate is a large, rigid slab of solid rock. The word tectonics comes from the Greek root “to build.” Putting these two words together, we get the term plate tectonics, which refers to how the Earth’s surface is built of plates.

    The theory of plate tectonics states that the Earth’s outermost layer is fragmented into a dozen or more large and small plates that are moving relative to one another as they ride atop hotter, more mobile material. Before the advent of plate tectonics, however, some people already believed that the present-day continents were the fragmented pieces of pre-existing larger landmasses (“supercontinents”).

    The diagrams below show the break-up of the supercontinent Pangaea (meaning “all lands” in Greek), which figured prominently in the theory of continental drift — the forerunner to the theory of plate tectonics.

    Image: USGS
    Image: USGS

    Continental drift, plate tectonics and prime meridians

    Historians and other scientists have theorized about Pangea for centuries. Common soil types, fossils, and other evidence found on different continents help to solidify the concept of Pangea. Items discovered on the west coast of Africa have many similarities with those found on eastern South America. The physical evidence is quite convincing that an earlier supercontinent existed millions of years ago.

    Now, let’s apply a fixed measurement system with lines upon Earth that defines latitude and longitude. In the past, geodesists, geographers and mathematicians established various “prime meridians” around the world to serve as a basis for maps. Locations and cities used included Amsterdam, Antwerp, the Bering Strait, Bern, Brussels, Copenhagen, Florence, Giza, Jerusalem, Kyoto, Lisbon, Madrid, Naples, Oslo, Paris, Philadelphia, Pisa, Rio de Janeiro, Rome, Stockholm, Warsaw and Washington, D.C. (in four different places!), just to name a few.

    Thankfully, scientists gathered in the 19th century to agree upon a singular “initial meridian” that would pass through Greenwich, England, and was based upon several centuries of astronomical observations at the nearby Royal Observatory.

    For approximately 100 years, mapmakers (and geodesists) used the new Prime Meridian at Greenwich as the beginning baseline for longitude determination around the world. After all, it was based upon years of astronomical observations and solved the age-old problem of where longitude starts. (Latitude was a much easier calculation for astronomers and geodesists, but that story is for another day.)

    Photo: majaiva/iStock/Getty Images Plus/Getty Images
    Photo: majaiva/iStock/Getty Images Plus/Getty Images

    The late 20th century and the fourth industrial revolution

    Technology, once again, provides us with conflicting results. While most technological advancements are game-changing improvements to mankind, they also tend to shake up information and standards that have existed for many generations. Like the previously discussed advancements in telephones, technology makes us change the way we look at things and how we go about our lives.

    Mapping has become a central part of our everyday lives. Georeferenced positions for literally everything is now a standard characteristic of many functions within our environment, especially in our surveying world. Most of these improvements are due to GPS, which was originally developed for the U.S. military to guide and assist with positional location of our defense systems in relation to our enemies. We use this same precise technology to establish positional locations for boundary points, infrastructure and topographic information.

    Image: Burch
    Image: Tim Burch

    We have also used GPS to learn much about our tectonic plates and varying movement of the continents.The first thing we learned is that the Prime Meridian established in 1884 does not fall in the same place as our 0° latitude designation as determined by GPS/GNSS calculations.

    This finding, however, is not the telling item within our adaptation of GPS data; it came when various agencies established the continuously operating reference system (CORS), composed of static GPS base stations. CORS stations, while used to help establish new survey positions in relation to a known reference location, also measure a continuous drift of latitude and longitude positions over time.

    The National Geodetic Survey (NGS) is in the process of finalizing a new reference framework for establishing coordinate values that utilize time as a core component. Future implementation of the new National Spatial Reference System (NSRS) will require the additional attribute of time within the metadata of any new values.

    Read more in David Zilkoski’s Survey Scene column.

    The reality of ‘moving’ monuments

    So how does this affect surveying and the monuments we surveyors hold on such a high pedestal? The answer varies depending on who one asks. Most surveyors will continue to hold the “priority of calls” as listed above. Several practitioners, however, want to move coordinates higher up the list because of technology, and the ability to retrace a published point because of the increase in technology and the higher accuracy and precision of today’s GNSS.

    This is possible if the user of the technology follows the procedures as established by NGS with metadata and accurate timing, but there are still several variables in the setting and retracing methodologies. When was the last time the equipment was calibrated? Was adequate research performed to minimize environmental errors? Was there any interference due to solar storms or multipath? There are many potential issues a surveyor can face, but few are checking all the boxes when performing highly accurate and precise positional measurements.

    Technology has brought surveying into the 21st century with GPS/GNSS and ever-increasing accuracy and precision. It should also be the profession’s goal that the technology does not override what the general public can see. They can see monuments, fence lines, buildings and other improvements, but they cannot see coordinates, which remain invisible to the naked eye. Technology may change that in the future, too, but until that time, we must rely on what we can see.