By Fabio Dovis, A. Minetto, A. Nardin, Politecnico di Torino Department of Electronics and Telecommunications, E. Falletti, D. Margaria, M. Nicola, M. Vannucchi, LINKS foundation
Following the issue by the Galileo Service Center of the Notice Advisory to Galileo Users (NAGU) reporting Service Outage for all the Galileo satellites, as curious Galileo users our team of researchers of the NavSAS group started an independent investigation of the received signals in space (SISs).
In fact, we observed that a commercial ublox EVK-M8T receiver, forced to use Galileo-only satellites, provided a “no-fix” indication. Three Galileo-enabled smartphones, the Xiaomi MI 8, Huawei P 10 and Samsung Galaxy S8, which use assistance from the cellular network, were also not providing a Galileo-based position solution, considering the Galileo satellites as “not usable.”
However, the investigation started exploiting our in-house developed software receiver NGene, that was used in the past for similar monitoring of the GNSS signals, for example at the time of the transmission of the first IOV Galileo satellites in 2012, and the transmission of anomalous GPS signals from SVN49 in 2009. Monitoring the Galileo SISs, which were usable until the day before, we found that they were still correctly trackable, with normal power levels and Doppler profiles within feasible limits.
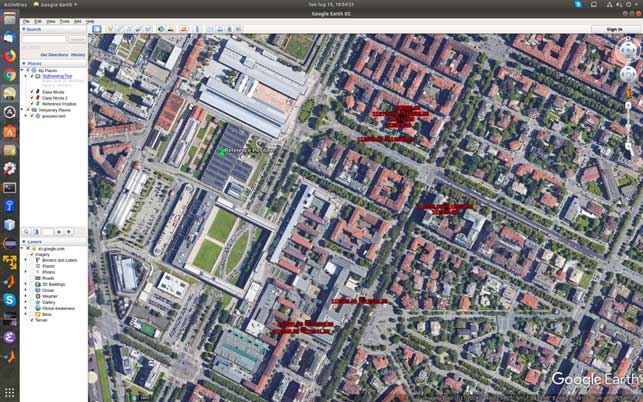
At the time of the first analysis, seven satellites were visible in the sky over Torino, Italy. Figure 1 reports a screenshot of the positions computed by means of NGene between 07:14:54 and 07:24:54 UTC on July 15, plotted on Google Earth. The position estimated using the Galileo-only satellite or hybrid GPS-Galileo solutions (red dots) showed errors on the order of 500 meters or even more. The georeferenced antenna position is depicted by the green pin.
Figure 1. Misplaced Galileo and GPS+Galileo solutions. (Screenshot: Politecnico di Torino and LINKS Foundation)
The monitoring of the status flags taken from the Galileo E1B I/NAV message showed that the SIS was marked as “healthy” for all the visible PRNs apart the number 14, which is known to be “not usable” for a long time. The Signal in Space Accuracy Index (SISA) was set to 109, which is an acceptable prediction of the minimum standard deviation of an overbound of the SIS error.
According to the Galileo Open Service, Service Definition Document (OS SDD, issued 1.1, May 2019), a SIS “Healthy” means that the SIS is expected to meet the Minimum Performance Level and “a navigation solution obtained with Galileo SIS is expected to meet the Minimum Performance Levels reported in the Galileo OS SDD only if receivers comply with the assumptions reported in Section 2.4, including the use of navigation parameters within their broadcast period.”
In fact, the document specifies that “The navigation solution is expected to meet the Minimum Performance Levels only if receivers do not use navigation parameters beyond their broadcast period. The maximum nominal broadcast period of a healthy navigation message data set is currently 4 hours.”
The check of the nominal broadcast period was bypassed in our software receiver, which is indented as a research tool and not a commercial product as the one mentioned above, so that we were still able to obtain a GPS + Galileo PVT solution, since this check looked to be the only discrimination factor to validate and thus exclude the computed solution.
On July 17, the SISA flag was changed to 255: according to the OS SDD, the accuracy status was “No Accuracy Prediction Available (NAPA).” This means that the status of the broadcast SIS must be intended as “Marginal.” In this condition the EVK-M8T restarted to provide Galileo-based fixes, while the Xiaomi Mi8 Pro smartphone still excluded the Galileo satellites from its PVT fix.
The analysis of the decoded Galileo navigation message led to the conclusion that ephemerides and clock correction data were last updated around 19:00 UTC of 1July 16. For example, PRN 3 and 15 changed Issue Of Data (IOD) from 958 to 17 at Galileo Signal Time TOW 241855, which corresponds to 19:01:25.
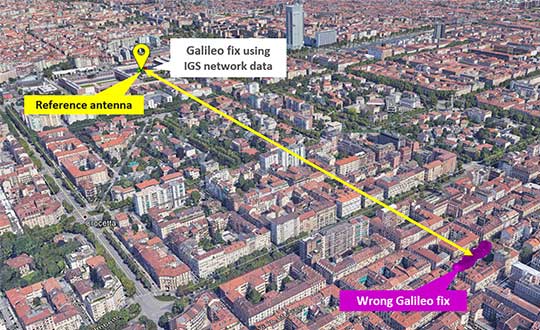
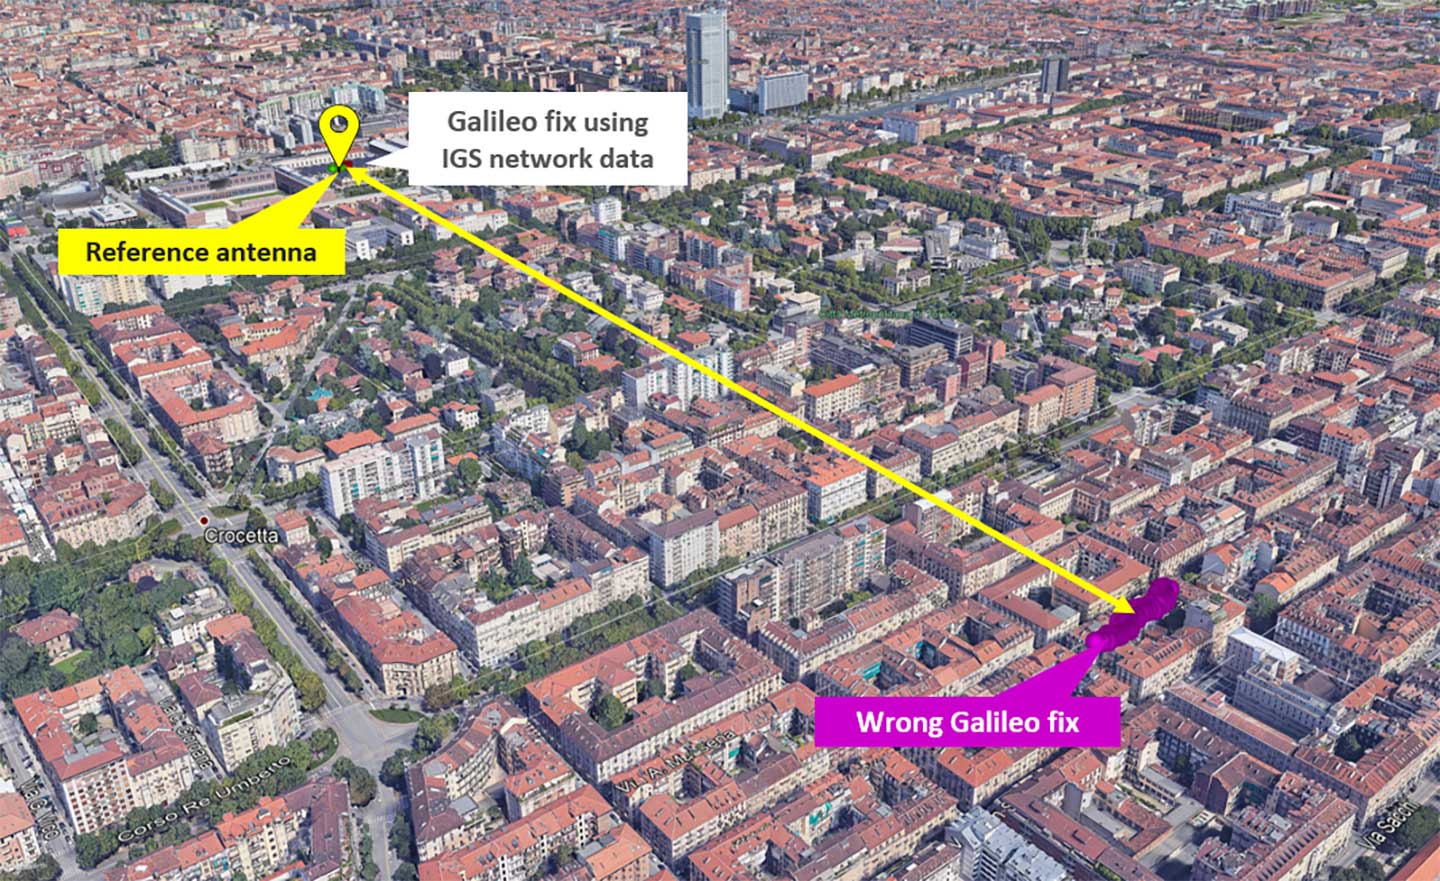
As a final check, we used external ephemerides to process the Galileo signals during the “system outage.” Figure 2 and Figure 3 show different navigation solutions obtained by processing a data collection taken on July 12 at 10.00 UTC (12.00 Local time). The purple dots indicate few fixes obtained by demodulating the navigation message transmitted by the Galileo satellites and show a remarkable bias with regard to the reference antenna location.
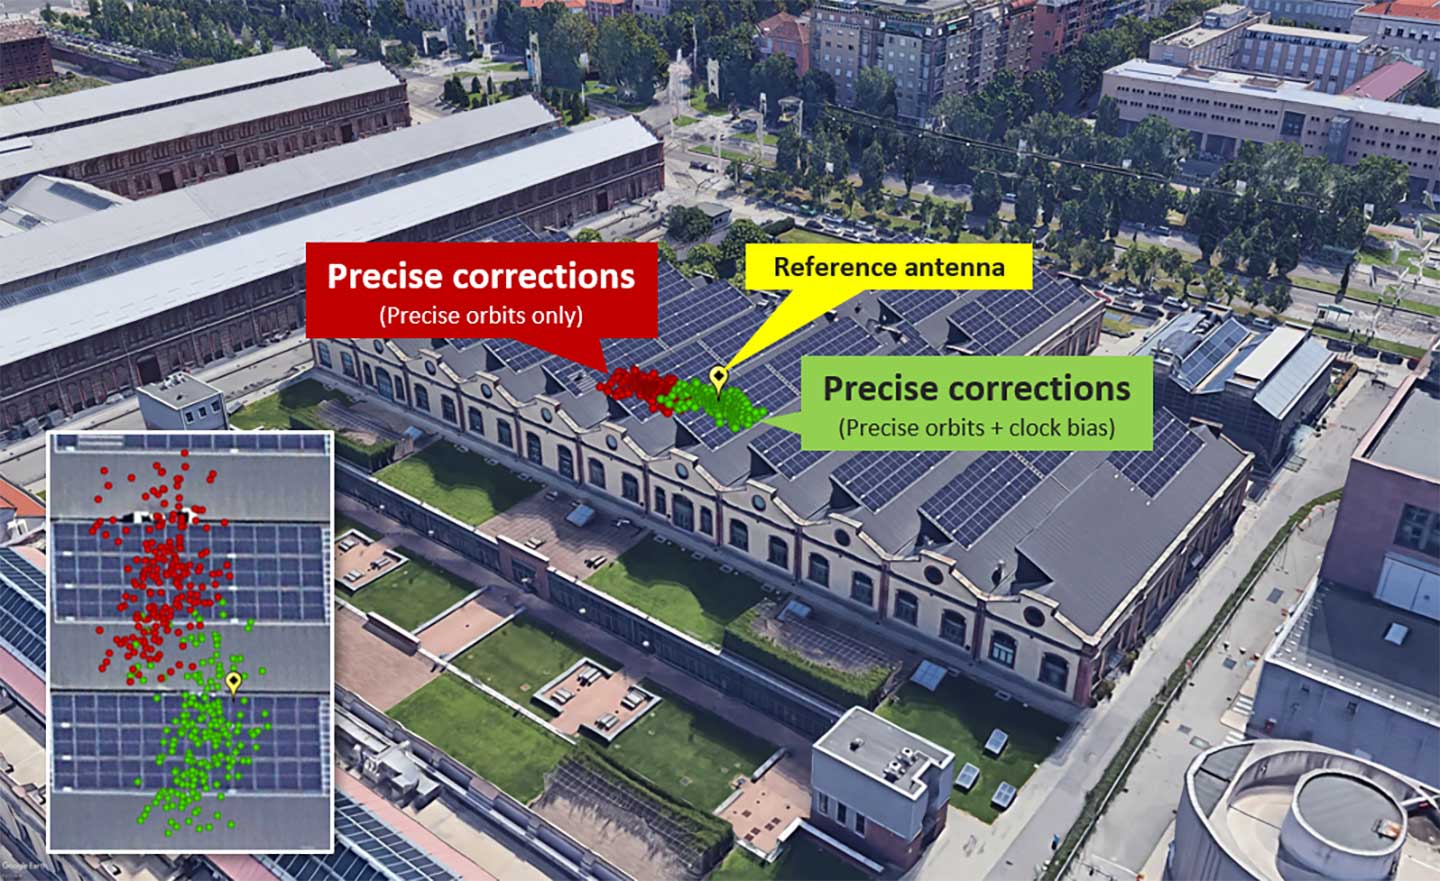
Figure 2. Comparison of Galileo-only solutions using Navigation message ephemeris data and IGS ephemeris. (Image: Politecnico di Torino and LINKS Foundation)Figure 3. Zoom on the Galileo-only positions obtained by using IGS data.(Image: Politecnico di Torino and LINKS Foundation)
In Figure 3, the green dots are the navigation solution obtained correcting the satellites positions according to precise orbits data and clock drift provided by the IGS network. The fix is a simple code based Least Mean Square solution without smoothing of the pseudoranges.
The two results were obtained by processing the same satellites signals, thus proving that their quality was still sufficient to get an acceptable positioning solution during the Galileo service outage period. This brought us to the conclusion that, during the outage, only the ephemerides updates were affected by problems, while the other SIS components appeared sound and usable.
Detection of anomalous harmonics in the L1 spectrum
Interfering signals are one of the most well-known nuisance for GNSS receivers. A number of terrestrial systems and devices can generate various types of interference, either intentionally or not, but one would not expect interfering signals to arrive from space. On May 17, researchers of the Navigation Signal Analysis and Simulation (NavSAS) Group at the Politecnico di Torino detected the presence of anomalous spikes in the L1 signal spectrum. The origin of the spikes was identified to be the transmission of non-standard codes from a non-operational GPS satellite (GPS IIF-9, SVN49). In this article, we report on some of the most significant signal observations we performed in an effort to identify and localize the source of the interference and we address the possible impact it could have on GNSS signal processing.
By Fabio Dovis, Nicola Linty, Mattia Berardo, Calogero Cristodaro, Alex Minetto, Lam Nguyen Hong, Marco Pini, Gianluca Falco, Emanuela Falletti, Davide Margaria, Gianluca Marucco, Beatrice Motella, Mario Nicola and Micaela Troglia Gamba
On the afternoon of May 17, 2017, during an outdoor data collection experiment, researchers of the NavSAS Group detected the presence of two spikes in the L1 spectrum, with sufficient power to be clearly visible on a display of the spectrum obtained by processing the raw digital samples at the receiver’s intermediate frequency. The initial check looked for a possible interfering source in the experimental set-up, since it was quite complex and included multiple GNSS receivers, PCs, a video camera and a couple of car batteries. But the likelihood of this source was soon dispelled as the same kind of spectrum was visible on a spectrum analyzer (SA) connected to an active, survey-grade GNSS antenna mounted on the lab roof, as displayed in FIGURE 1. The spectrum is centered at 1575.42 MHz, with the SA set to a frequency span of 5 MHz. Connecting the SA to a different survey-grade antennas on the lab roof, we saw no remarkable differences.
The spikes also appeared on subsequent days, becoming clearly visible at about 13:00 UTC and disappearing at about 19:00 UTC, as illustrated in FIGURE 2. The main lobe of the GPS signal spectrum is visible, along with two spikes, at approximately ±0.5 MHz above and below the L1 carrier frequency. Weaker harmonics are also visible at ±1.5 MHz from the central frequency.
Figure 1. L1 Spectrum of the received signal at 16:51 (Central European Summer Time; 14:51 UTC) on May 19, 2017, at the NavSAS Lab, Torino (located at 45°03’54.98767″ N, 7°39’32.28920″ E, 311.9667 meters).Figure 2. Spectrogram of the received signal. Power spectral density (PSD) is color coded.
Response from the U.S. Air Force about the anomaly
The 2nd Space Operations Squadron is performing maintenance on a presently non-operational satellite. SVN49 is broadcasting non-standard C/A and non-standard Y codes as described in IS-GPS-200. Space professionals continue to conduct safe and responsible command and control of the constellation to continue to provide accuracy that exceeds established system requirements.
As always, GPS users who experience issues should address them through the appropriate channels: military users should contact DSN 560-2541, commercial 719-567-2541 while civilian users should contact the U.S. Coast Guard Navigation Center at 703-313-5900.
Very Respectfully,
NICHOLAS J. MERCURIO, Capt, USAF Director, 14th Air Force (Air Forces Strategic)/JFCC SPACE Public Affairs
Exclusion of terrestrial sources
The 24-hour repetition period of the phenomenon, along with the shape of the spectrum, could indicate the presence of a signal anomaly from a GNSS satellite. However, we could not exclude the hypothesis of unintentional interference generated by a nearby terrestrial communication system, since the area is crowded with research labs belonging to the Instituto Superiore Mario Boella and the Department of Electronics and Telecommunications of Politecnico di Torino. Nevertheless, we probed the L1 spectrum in a wider area using a simple setup, consisting of a patch antenna and a narrow-band front end. We analyzed the spectrum at the output of the front-end’s analog-to-digital converter, plotting the results on a smartphone running our software receiver in real time.
FIGURE 3 shows the L1 spectrum observed several kilometers from the NavSAS Lab. The shape of the spectrum is different than that in Figure 1 because of the narrow-band filter of the front end, but again, the presence of the two spikes is clearly visible at ±0.5 MHz from the central frequency, approximately with the same power strength. In addition, during a dynamic data collection experiment, we recognized that the interfering signals disappeared when the western part of the sky was obscured by buildings, as demonstrated in Figure 3. This was further investigated (and confirmed) when we processed the collected set of data in the lab. At that time (May 19), the hypothesis of an interfering signal from space became more plausible.
Figure 3. L1 Spectrum of the received signal observed on the afternoon of May 19 in Torino, 6.7 kilometers away from the NavSAS Lab: (left) in open sky conditions, (right) with the western portion of the sky obscured by a nearby building.
Meanwhile, the presence of suspicious spikes was confirmed by colleagues at the European Commission Joint Research Centre located in Ispra, Italy, and also from researchers of the Finnish Geodetic Institute in Helsinki, Finland, and by the South African National Space Agency at the station of the South African National Antarctic Expedition IV. These multiple observations definitely excluded the possibility that the interference it could be coming from terrestrial sources or from within the receiving equipment.
Checking the satellites in view during the presence of the spikes in the spectrum (that is, from about 13:00 to about 19:00 UTC) and bearing in mind the periodicity of the event over consecutive days, we excluded the possibility that a Galileo satellite could be the source of interference. It is indeed known that, due to an orbital period of approximately 14 hours for observers on the ground, the constellation geometry repeats only every 10 days.
Figure 4. Visible operational GPS, Galileo and BeiDou satellites over Turin for the full time window between 13:00 and 19:00 UTC on May 20, 2017.
FIGURE 4 shows the visibility of operational satellites over the full time window of interest for the GPS, Galileo and BeiDou constellations.
Considering the duration of the satellites’ visibility, the search for the source of interference was restricted to SVN71 (PRN26), SVN45 (PRN21) and the C11 BeiDou satellite. However, considering the previous tests, the satellite should have been in the western portion of the sky with respect to our location, and the only operational satellite of this set is SVN71, which we initially identified as the possible source of the interfering signal.
GPS SVN71 (PRN 26) or SVN 49?
The frequency of the harmonics could be measured over time. The first peak at approximately 0.5 MHz above the central frequency was analyzed by post-processing a set of digital samples collected with an Universal Software Radio Peripheral, which was slaved to a 10-MHz rubidium standard and which converted the RF signal to baseband, sampling it at 5 MHz. The frequency was measured exploiting a Welch periodogram, based on a 102,400-point discrete Fourier transform, with rectangular windowing and no window overlaps.
FIGURE 5 (a) shows the trend of the measured frequency versus time, from 12:43 to 18:38 UTC, on May 21. The frequency profile reveals that it is not constant and has a trend similar to the typical Doppler frequency shift of a GPS satellite. FIGURE 5 (b) shows the derivative of the frequency, with a minimum around 16:22 UTC. At that time, we expected to have a null Doppler shift from GPS PRN26, whereas the frequency of the peak was equal to 510.449 kHz. This is the inverse of 1.959056 microseconds, which is close to the inverse of twice the chip length, 2/Rc = 1.955034 microseconds. This indicates that the interfering signal could be a square wave with the same rate as the C/A spreading code.
Figure 5(a). Measured frequency of the first upper harmonic versus time.Figure 5(b). Measured frequency of the first upper harmonic versus corresponding frequency rate.
FIGURE 6 shows the Doppler frequency of PRN26 (blue line), as estimated by the tracking loop of a GNSS software receiver, and compares the Doppler shift to the frequency of the first upper peak (orange line), measured on the spectrum. It is possible to note that the two curves almost overlap, with a significant difference at the beginning and at the end of the observation. Thus, although the frequency of the peak follows the Doppler trend of a GPS satellite, it does not exactly match the Doppler curve of PRN26. This result weakened the hypothesis indicating that PRN26 was the source of the interference.
Furthermore, since it was still possible to acquire and track the L1 C/A-code signal from PRN26, this satellite was unlikely to be the source of the interfering components. Thus, also motivated by the mismatch in the Doppler shift of PRN26 (as previously highlighted in Figure 6), we started to think that the source of the interference could be another satellite broadcasting a GPS-like signal.
The search then focused on potential sources of interference coming from a non-operational satellite. The non-operational GPS satellite SVN49, launched on March 24, 2009 (also known as NAVSTAR 63 with NORAD ID 34661), has an orbit similar to that of SVN71 (see FIGURE 7). The previous remarks, let us guess that the transmission of a non-standard code (NSC) from such a satellite was the origin of the problem in the L1 spectrum. Such a case, could be similar to what has been previously reported in by Zhu et al. [1,2] when discussing the effects of the transmission of an NSC on Nov. 28, 2006.
Figure 6. Doppler shift of GPS PRN26 estimated by a tracking loop (blue line) and comparison with the measured frequency of the first upper harmonic versus time (orange line).Figure 7. Skyplot illustrating the path of SVN71 (PRN26) and SVN49 over the time window of interest.
Transmission of NSCs for testing purposes is foreseen in the GPS Interface Specification, IS-GPS-200 [3]. GPS satellites can switch off regular broadcasts of the C/A code and the P/Y code and transmit a non-standard C/A code and non-standard Y code. Such operation is intended to protect users from receiving and utilizing erroneous satellite signals in case of unhealthy conditions on the spacecraft. Strictly speaking, this case cannot be formally considered as an “anomaly,” because the transmission of non-standard codes is documented in the IS-GPS-200. Therefore, the transmission of an NSC can be considered a normal operation in itself, even though it may reflect a problem with the transmitting satellite.
However, in this case the choice of the spreading sequence, which is likely a square wave, allowed the total power of the signal to be concentrated in just a few spectral components, thus originating continuous-wave-like in-band signals.
The distribution of the harmonics, the main components of which are at ±500 kHz, and the presence of the odd harmonics only, matches the case recalled by Zhu et al. [1,2], of a transmission of an NSC modulated as a binary-phase-shift-keying (BPSK) sequence with alternating logical 0s and 1s, transmitted at the C/A code chipping rate (Rc=1.023 megachips per second). The spectrum of this “square wave” with period used as a spreading signal is in fact know to be (1)
where δ is the Dirac-δ function. Zhu et al. [1,2] considered this specific case of a “non-standard code” to be especially remarkable, because it can affect the L1 spectrum, introducing multiple harmonic components similar to those previously illustrated in Figure 1 and Figure 3 (a).
Figure 8. Spectrum of the simulated NSC for different C/N0 values.
The hypothesis of the BPSK with Rc=1.023 megachips per second spreading signal has been verified by simulation. Figure 8. shows how the tested case of a received signal from SVN49 with a C/N0=55 dB-Hz best matches the measured spectrum when SVN49 is at its maximum elevation angle and the power of the received signal is the strongest.
However, it has to be remarked that according to Zhu et al. [1,2], the NSC is designed to have negligible effect on tracking other healthy GPS satellite signals. Nonetheless, their analyses showed that an NSC transmission (as occurred on Nov. 28, 2006) can have a non-negligible impact in the performance on user equipment. In detail, when a GPS satellite is switched to NSC mode, a receiver immediately loses its capability to track that satellite signal. This is not the case with SVN49 as it is currently declared non-operational. However, due to the modified code sequence, an even worse effect is possible. In fact, the NSC introduces irregular components at a sustained level in the GPS signal spectrum.
As a final confirmation of the transmission of the NSC from SVN49, we have used the technique of averaging and summing over the code period as described by Mitelman [6]. Considering a time window during which the Doppler shift of the signal is negligible, we have extracted the spreading code, confirming the square wave hypothesis (see FIGURE 9).
Figure 9. Square wave code obtained by averaging and summing.
According to the Notice Advisory to Navstar Users (NANU) 2001701, SVN49 was broadcasting standard signals as PRN04 (although set unhealthy) since the beginning of the year, but NANU 2017042 announced that PRN04 was to be re-allocated to SVN38 starting from May 18. This switch actually matches the dates when we started to see the spikes in the spectrum, since, probably, the SVN49 started that day to use the “square wave” for the spreading.
Implementing the square wave local code, it has been possible to successfully acquire and track the NSC, as shown in FIGURE 10.
Figure 10. Acquisition and tracking of the NSC. Source: GPS World
Source: GPS World
The real-time software receiver N-Gene, documented by Molino et al. [5],has been forced to acquire and track in real time the signal coming from SVN49. FIGURE 11 shows a screenshot of the N-Gene graphical interface while processing this signal.
Figure 11. N-Gene software receiver processing the SVN49 signal.
The receiver was able to perform the decoding of the navigation message transmitted by SVN49, which exhibits a regular format, even if marked with an unhealthy flag (see FIGURE 12).
Figure 12. Decoded navigation message.
Impact on receiver signal processing
It is well known that the spectrum of GNSS signals is basically a line spectrum in the frequency domain, which is susceptible to interference (see, for example, the book edited by Davis [4]).
Interference with harmonic components such as those generated by the use of a square wave could strongly impact a GNSS receiver in the acquisition and tracking blocks because the interference power is dispersed over the whole search space by the correlation with the local code, compromising the acquisition accuracy and impacting other functional blocks. The impact of interference spectral lines strongly depends on their location within the frequency band. This is due to the almost periodic nature of the GNSS signals. In fact, the spectrum of a GNSS signal has components spaced at multiples of the inverse of the code period (for example, 1 kHz for GPS C/A code) with different power allocated to each component depending on the shape of the code spectrum. The effect is larger in case of matching of the interference spectral components with the ones of the GNSS signal. Furthermore, in the present case, the strongest harmonics are close to the L1 carrier frequency and are not mitigated by the front-end filter since they fall within its narrow bandwidth.
As opposed to the case discussed by Zhu et al. [1,2] when GPS was virtually the only code-division-multiple-access system occupying the bandwidth around L1, the overall GNSS scenario has changed a lot recently. Galileo and BeiDou are also present, and the signals of the Galileo system, due to the different structure and code periods, have spectral lines spaced at 0.25 kHz. The frequency modulation of the interfering signal due to the variable Doppler shift is then even more likely to hit some of the spectral components of these signals.
We are performing further investigations are being performed to assess the impact of the interfering signal from SVN49 on Galileo-based high accuracy applications.
Acknowledgments
The NavSAS Group thanks Dr. Matteo Paonni (EC Joint Research Centre) for the support given in the analysis of the L1 signal spectrum and Dr. Laura Ruotsalainen (Finnish Geospatial Institute) and Danielle Taljaard (South African National Space Agency), who performed the data collection in Antarctica.
Bios
Fabio Dovis, Nicola Linty, Mattia Berardo, Calogero Cristodaro, Alex Minetto and Lam Nguyen Hong are with the Navigation Signal Analysis and Simulation (NavSAS) Group, Politecnico di Torino, Torino, Italy.
Marco Pini, Gianluca Falco, Emanuela Falletti, Davide Margaria, Gianluca Marucco, Beatrice Motella, Mario Nicola and Micaela Troglia Gamba are with the Navigation Technologies Research Area of Istituto Superiore Mario Boella, Torino.
[2] “Satellite Anomaly and Interference Detection Using the GPS Anomalous Event Monitor” by Z. Zhu, S. Gunawardena, M. Uijt de Haag and F. van Graas in Proceedings of the 63rd Annual Meeting of The Institute of Navigation, Cambridge, Massachusetts, April 23–25, 2007, pp. 389–396.
[4] GNSS Interference Threats and Countermeasures by F. Dovis (ed.) published by Artech House, Norwood, Massachusetts, 2015.
[5] “N-Gene GNSS Software Receiver for Acquisition and Tracking Algorithms Validation” by A. Molino, M. Nicola, M. Pini and M. Fantino in Proceedings of EUSIPCO 2009, the 17th European Signal Processing Conference, Glasgow, Scotland, Aug. 24–28, 2009, pp. 2171-2175.