Tag: public transit

  • COVID-19 impact revealed through the lens of GPS

    COVID-19 impact revealed through the lens of GPS

    Movement, closeness, privacy — many things we took for granted a few months ago have become luxuries after the onset of COVID-19. To get an understanding of the scale and impact of the virus, we can look at global movement trends of people and merchandise using GNSS technology.

    Marine

    Before the coronavirus pandemic, globalization seemed to be increasing endlessly. Now, we face new trade restrictions, protectionist policies, and a global economic downturn that threatens to stunt growth for years to come.

    In April, the World Trade Organization (WTO) forecast that global trade would fall by between 13% and 32% in 2020, surpassing the “great trade collapse” of 2009 spurred by the global financial crisis.

    World merchandise trade volume, 2000-2022. (Source: World Trade Organization)

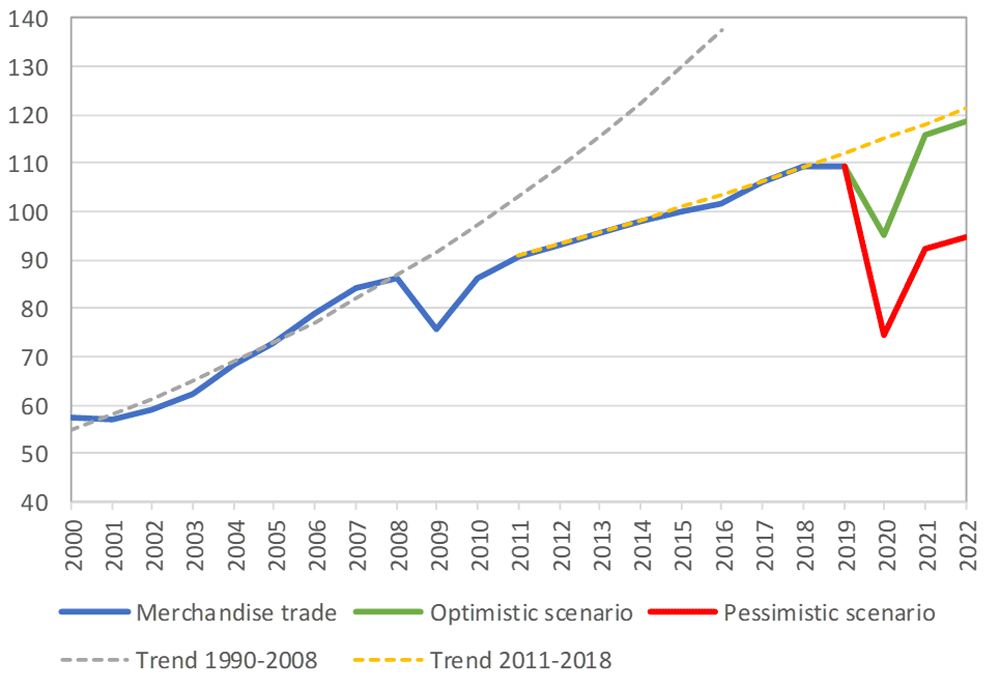
    However, the situation isn’t completely bleak. According to a recent Tradeshift report, global trade decreased by 14.8% in the second quarter of 2020, putting us on the optimistic end of the WTO estimate. June saw a rise in trade activity, suggesting that we may be recovering from the initial effects of the pandemic.

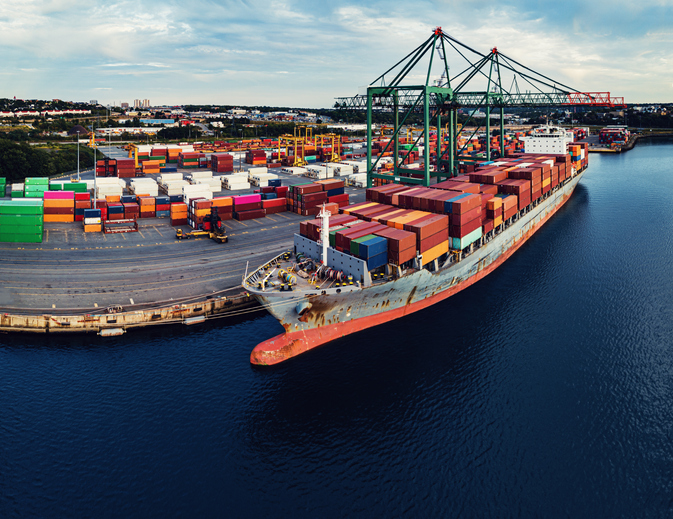
    Cargo vessels, tankers, tugs, and other kinds of commercial ships are equipped with satellite navigation devices that can receive information from GNSS satellites to compute precise location and time. Maritime tracking insights obtained via GNSS/GPS signals are a great method for measuring the impact of the coronavirus on trade.

    Photo: shaunl/E+/Getty Images
    Photo: shaunl/E+/Getty Images

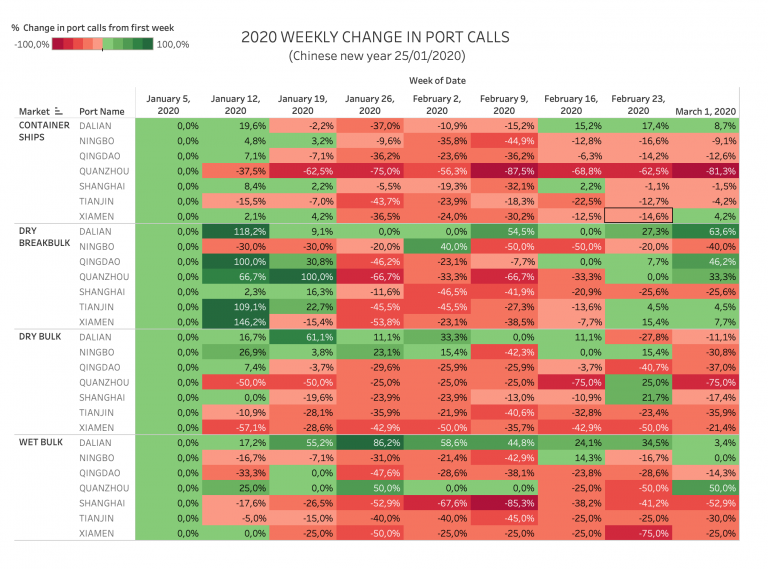
    GPS data from MarineTraffic shows that ship arrivals decreased in nearly all of China’s ports from January to March.

    Source: MarineTraffic
    Source: MarineTraffic

    Just as trade shipping began to pick up in China, the United States and Europe were hit hard by the pandemic. However, shipments have now begun to climb worldwide to compensate for cancellations earlier this year.

    The cruise industry, on the other hand, shows little indication of recovery. Cruises were the fastest growing segment of the travel industry over the past five years — until the pandemic hit.

    On June 19, the Cruise Line International Association (CLIA) and Centers for Disease Control and Prevention (CDC) announced a “no sail order” for cruise ships. The order has been extended through Sept. 30. Furthermore, the cruise industry’s reputation has been damaged by multiple outbreaks on ships, most recently the MS Roald Amundsen of Norway. At least 43 people were infected on the MS Roald Amundsen, and Norway has now banned cruise ships with more than 100 passengers from disembarking at Norwegian ports.

    Maritime intelligence company VesselsValue is using AIS data to map cruise ship activity throughout the pandemic. They have noted that while cruise ships typically sail at 13.5 knots to 15 knots, average speed has dropped to 11 knots in 2020 as ships attempt to lower fuel costs. Port-to-port sailings have declined for the 10 most popular cruise routes.

    Source: VesselsValue
    Source: VesselsValue
    Source: VesselsValue
    Source: VesselsValue

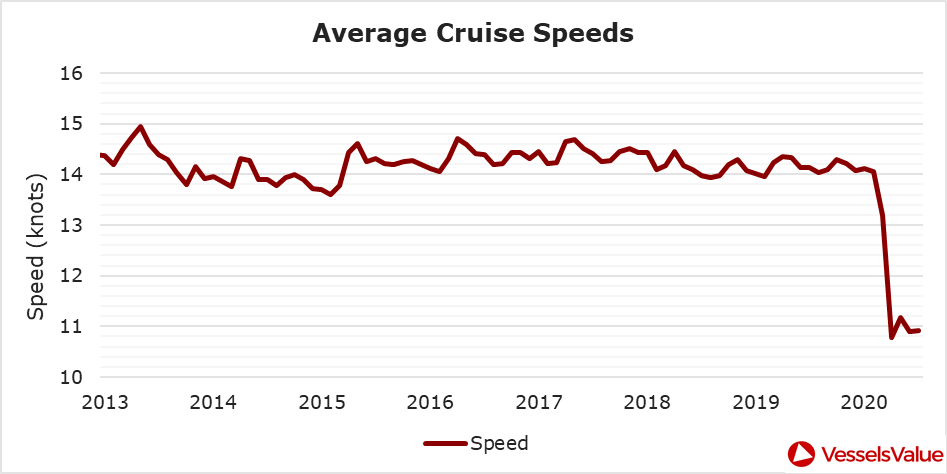
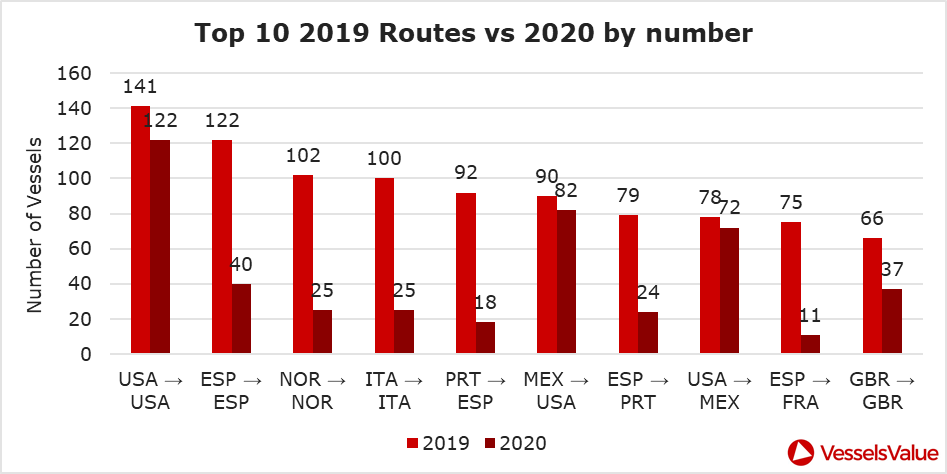
    Most of the port-to-port sailings that constitute the 2020 columns in the above graph actually represent ships being repositioned for a break in service, also called a “layup.” Layups can cost cruise companies millions of dollars per month, but with no sail orders and port closures, they are a necessary expense.

    According to the Oxford COVID-19 Government Response Tracker, a real-time monitoring system that evaluates government policies, April marked the strictest lockdown measures across all 133 available coastal countries. The tracker uses a stringency index between 0 and 100 based on national containment and closure policies.

    Source: Oxford COVID-19 Government Response Tracker
    Source: Oxford COVID-19 Government Response Tracker

    Air

    Commercial air traffic has decreased as well. According to GPS flight tracking service Flightradar24, the number of global daily flights was slashed by nearly two thirds between March and April. While there were 15,012 flights in the air at 15:00 UTC on March 7, there were only 5,275 at the same time on April 7.

    Global air traffic March 7, 2020. (Source: Flightradar24)
    Global air traffic March 7, 2020. (Source: Flightradar24)
    Global air traffic April 7, 2020. (Source: Flightradar24)
    Global air traffic April 7, 2020. (Source: Flightradar24)

    There were 55% fewer flights in the last week of March 2020 than in the last week of March 2019. While all types of air traffic have been reduced for fears of infection, the coronavirus has especially decimated demand for passenger flights. Passenger airlines across the world have canceled flights and cut capacity for the foreseeable future. Some passenger airlines have even switched to transporting cargo in a desperate attempt to avoid bankruptcy.

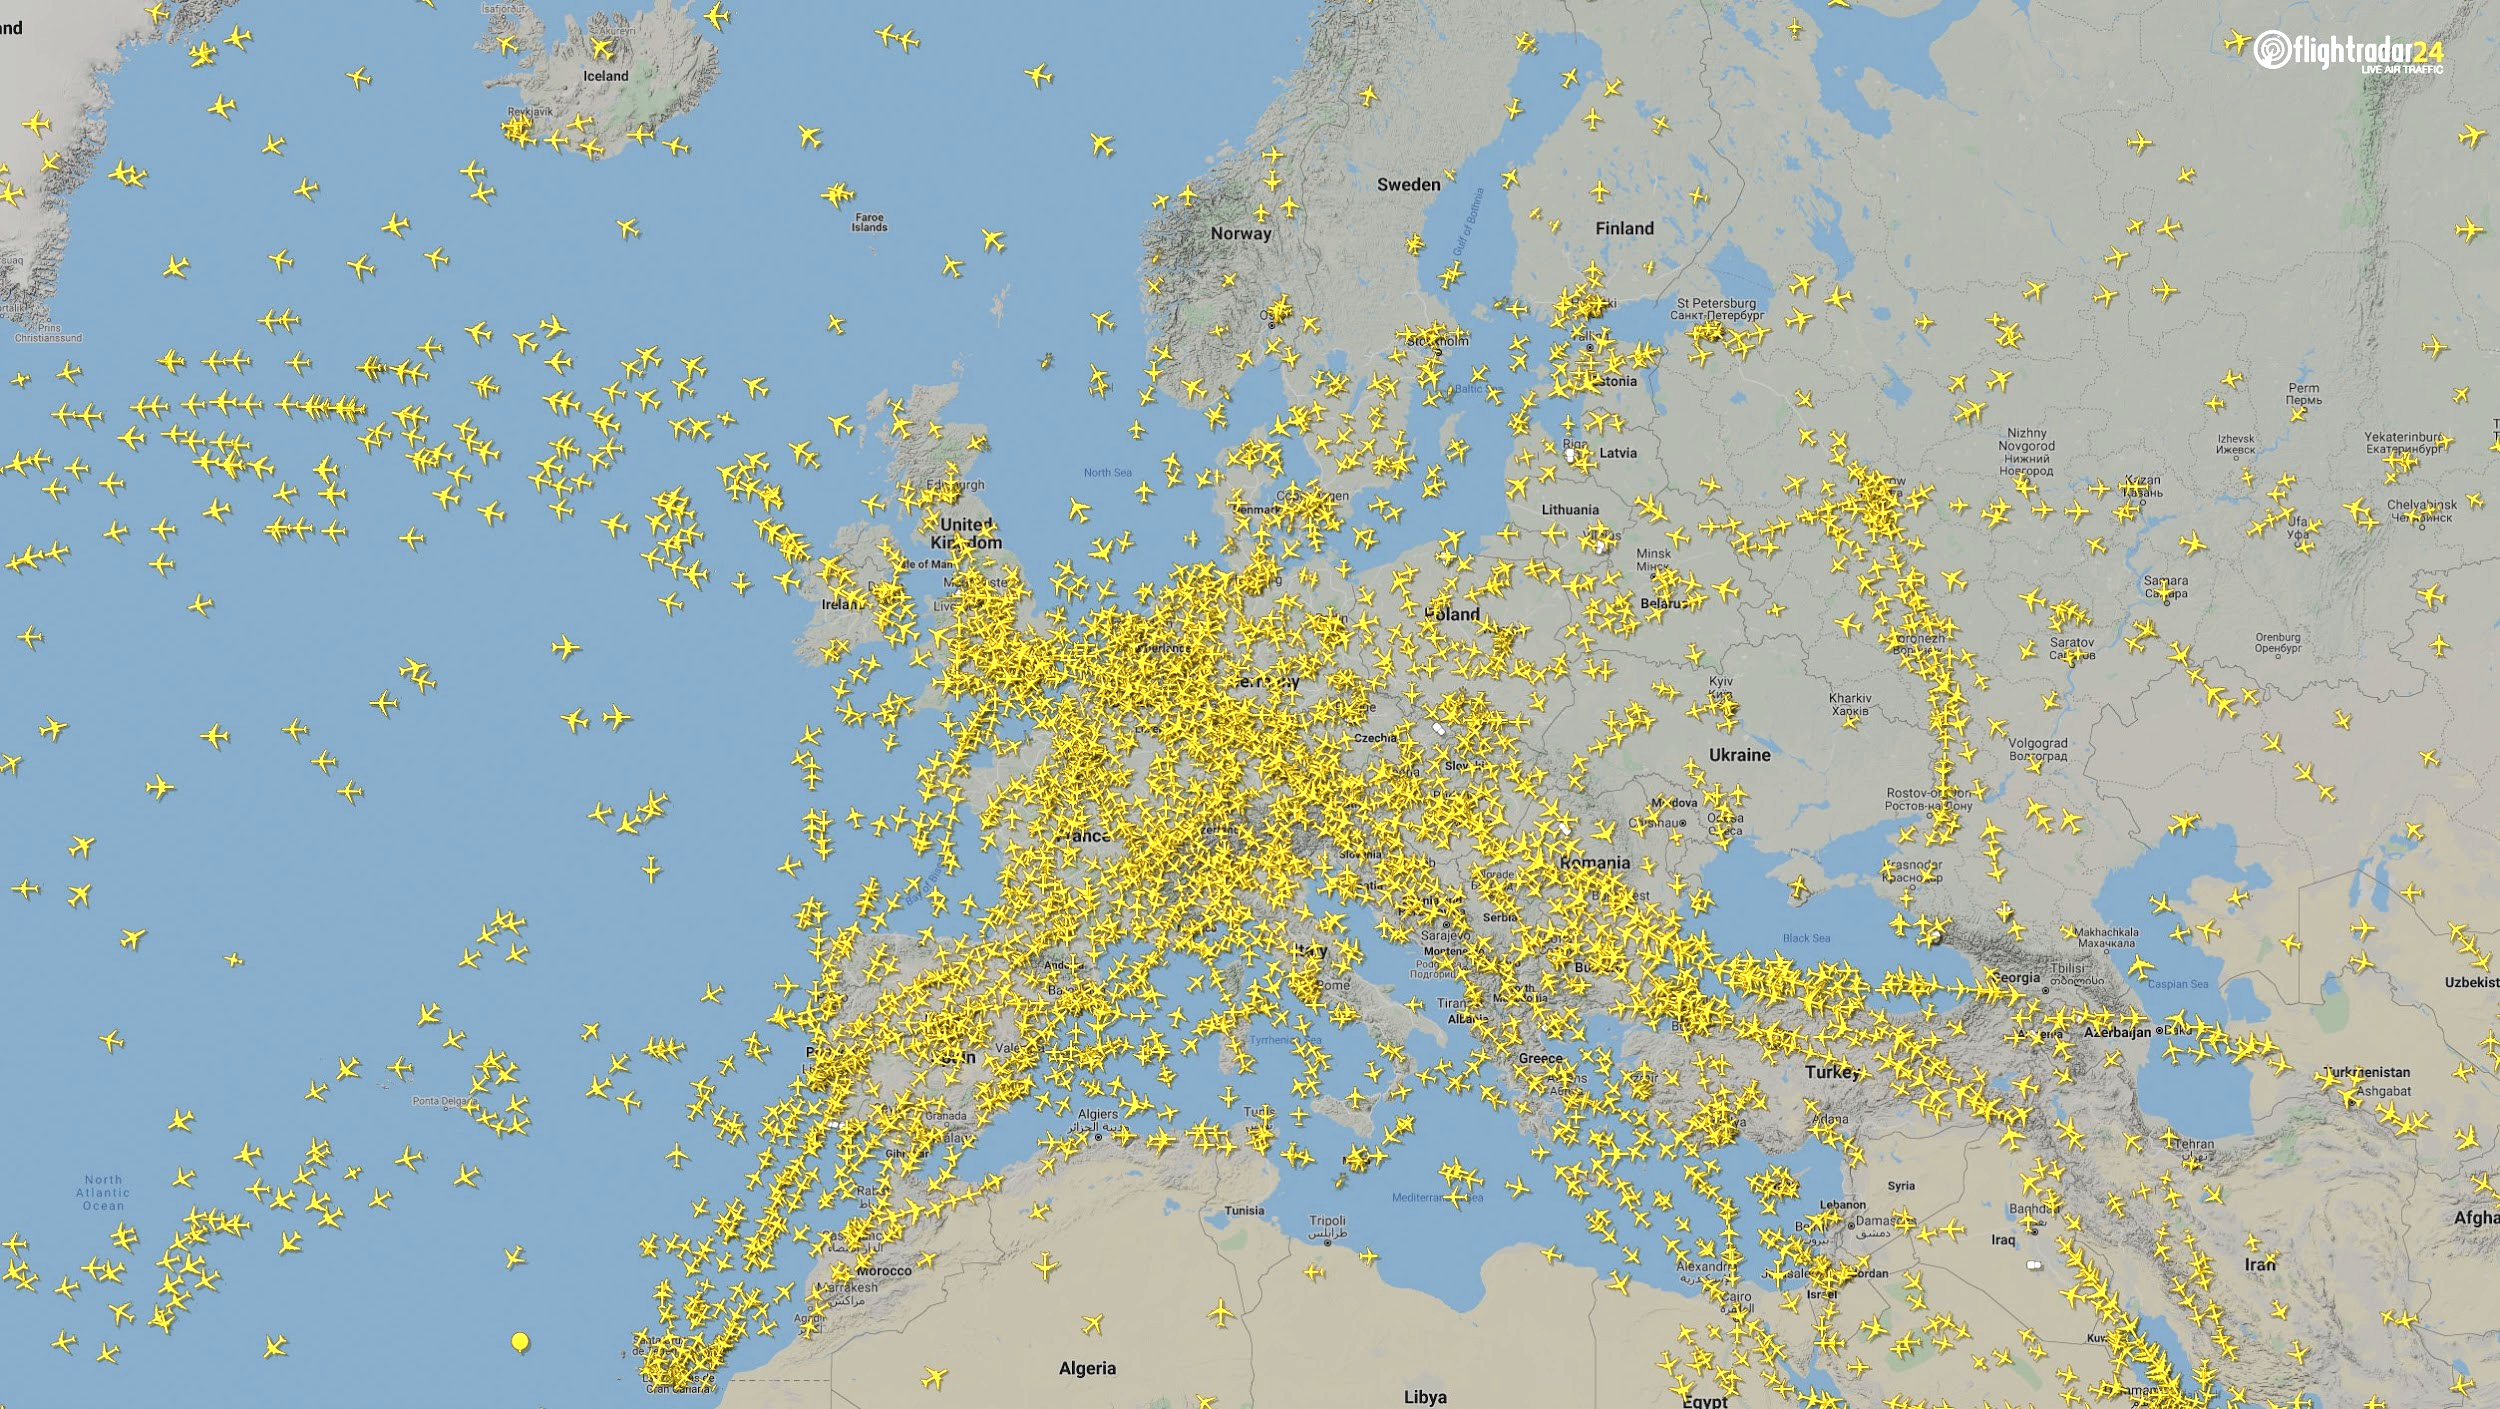
    Looking at regional tracking data can further illuminate the impact of COVID-19 on air travel. Travel restrictions and border closures were enacted en masse in late March, though some nations adopted more stringent policies than others.
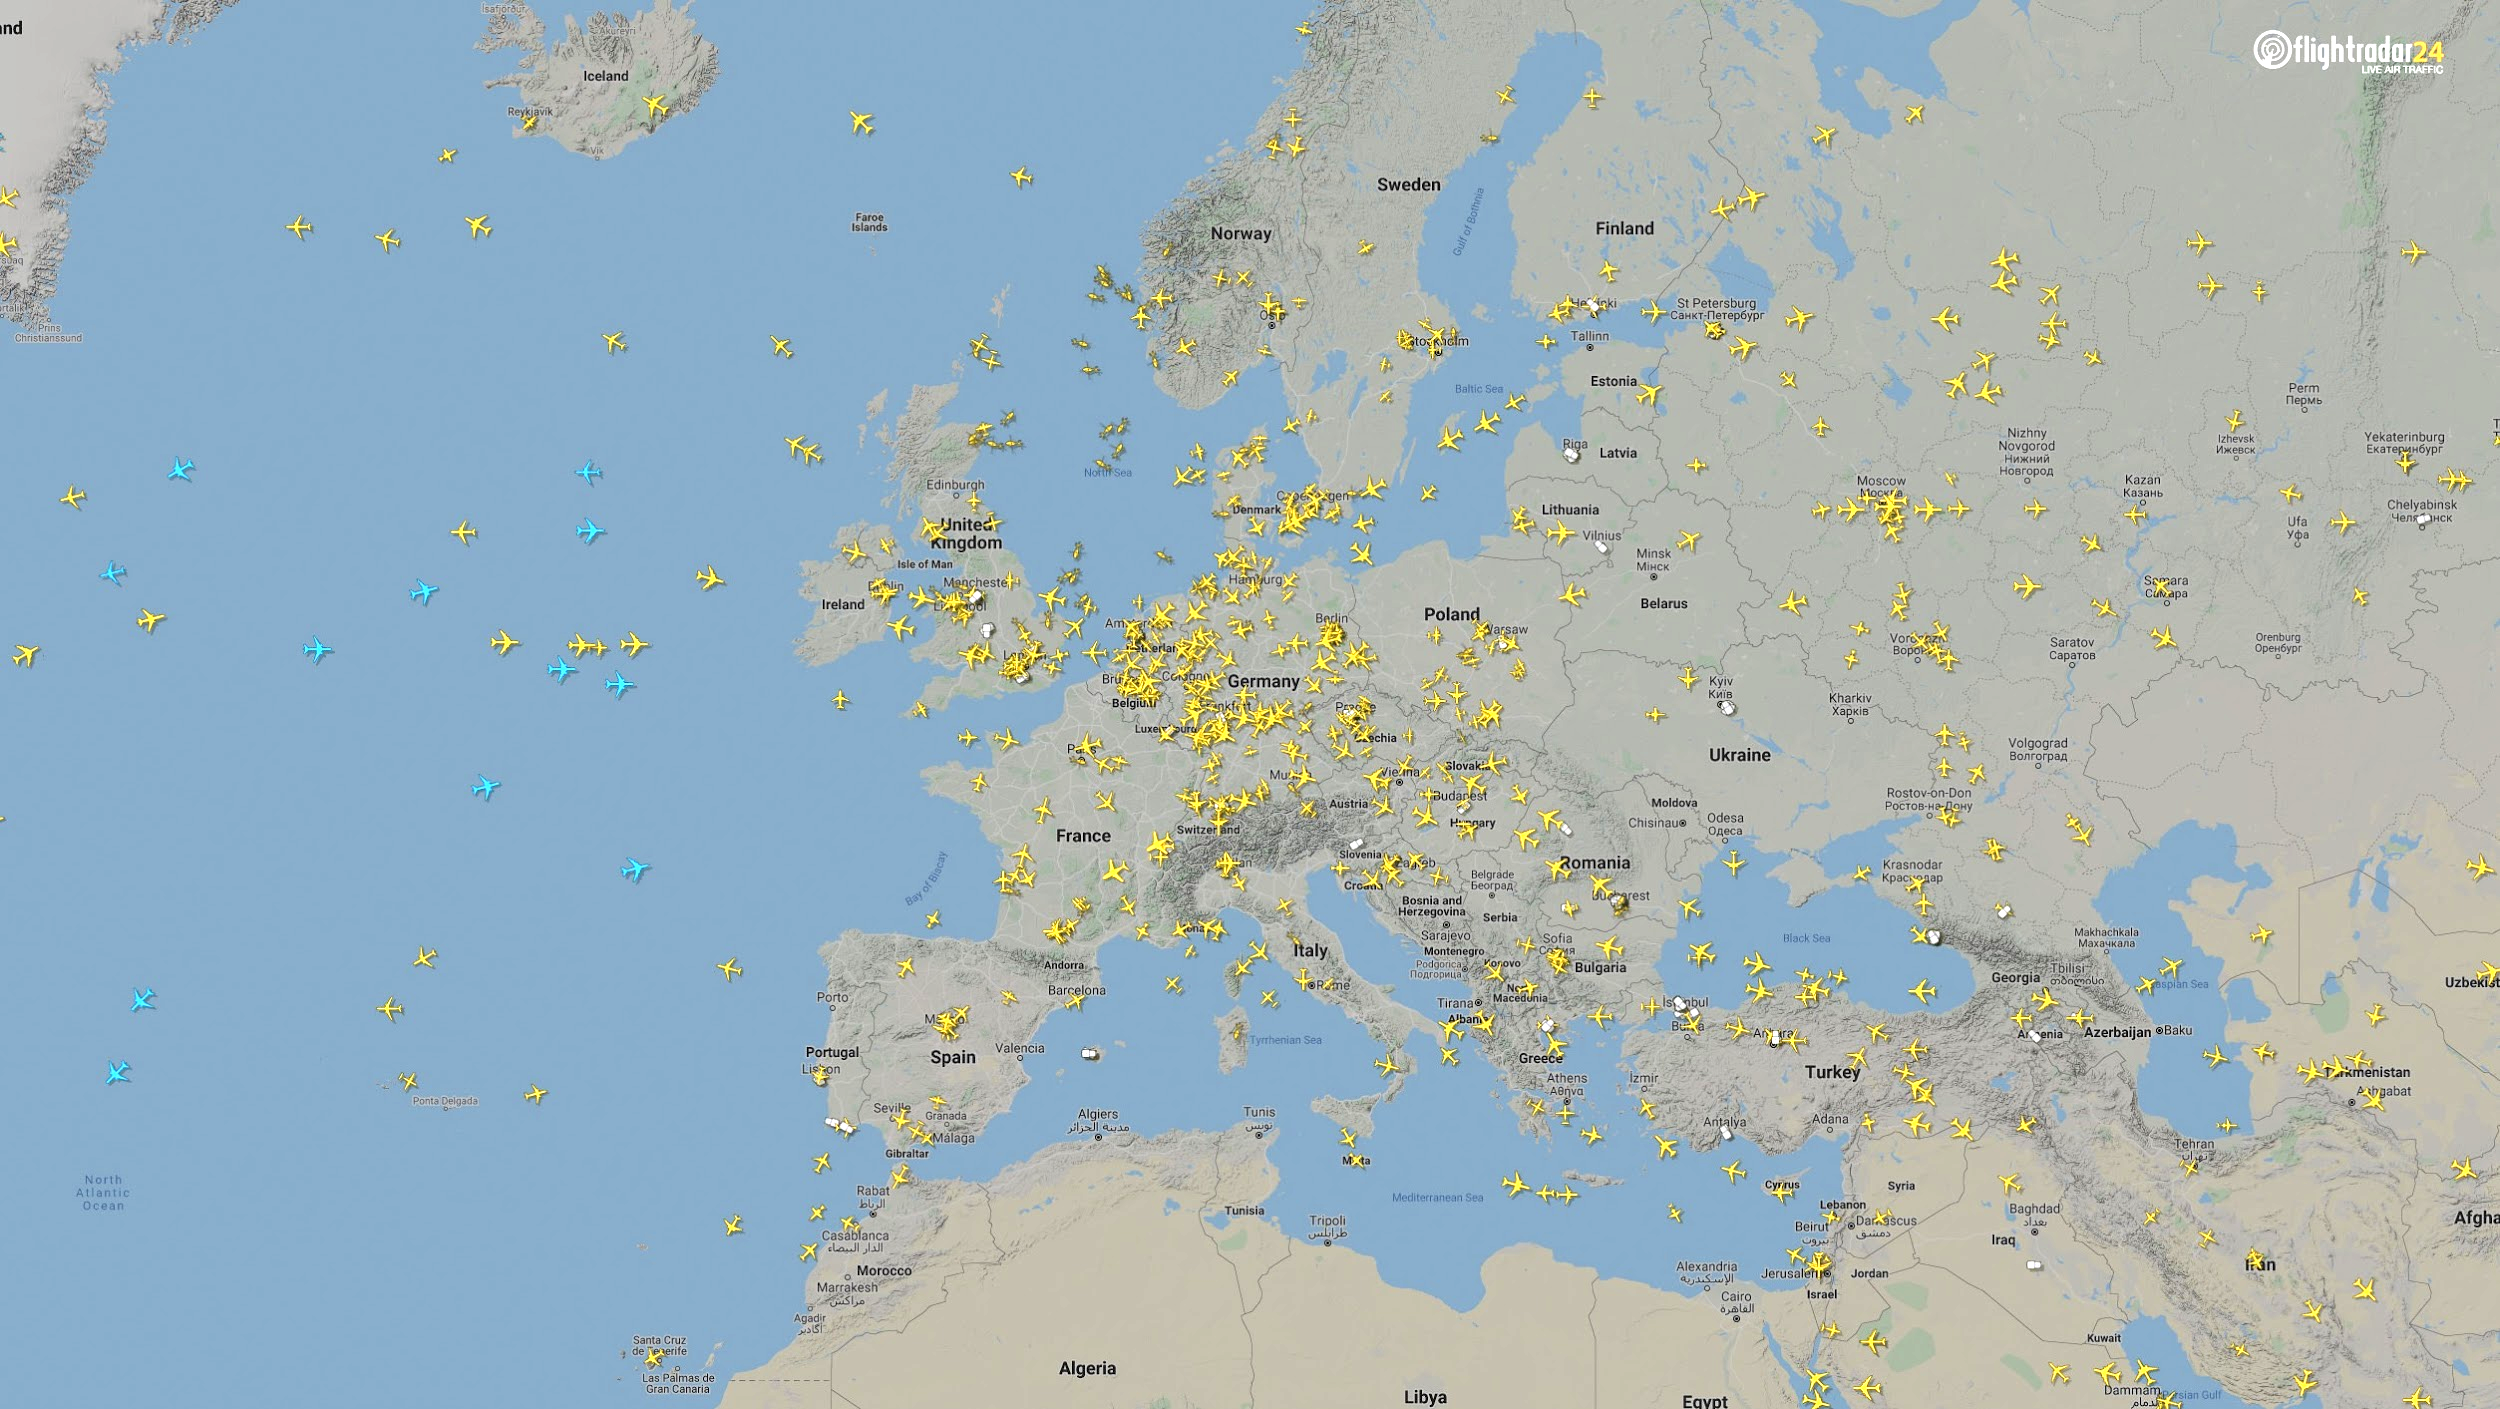
    Europe

    The number of flights in Europe has plummeted since the onset of the coronavirus pandemic. There were 2,400 fewer flights in Europe on April 7 than March 7.
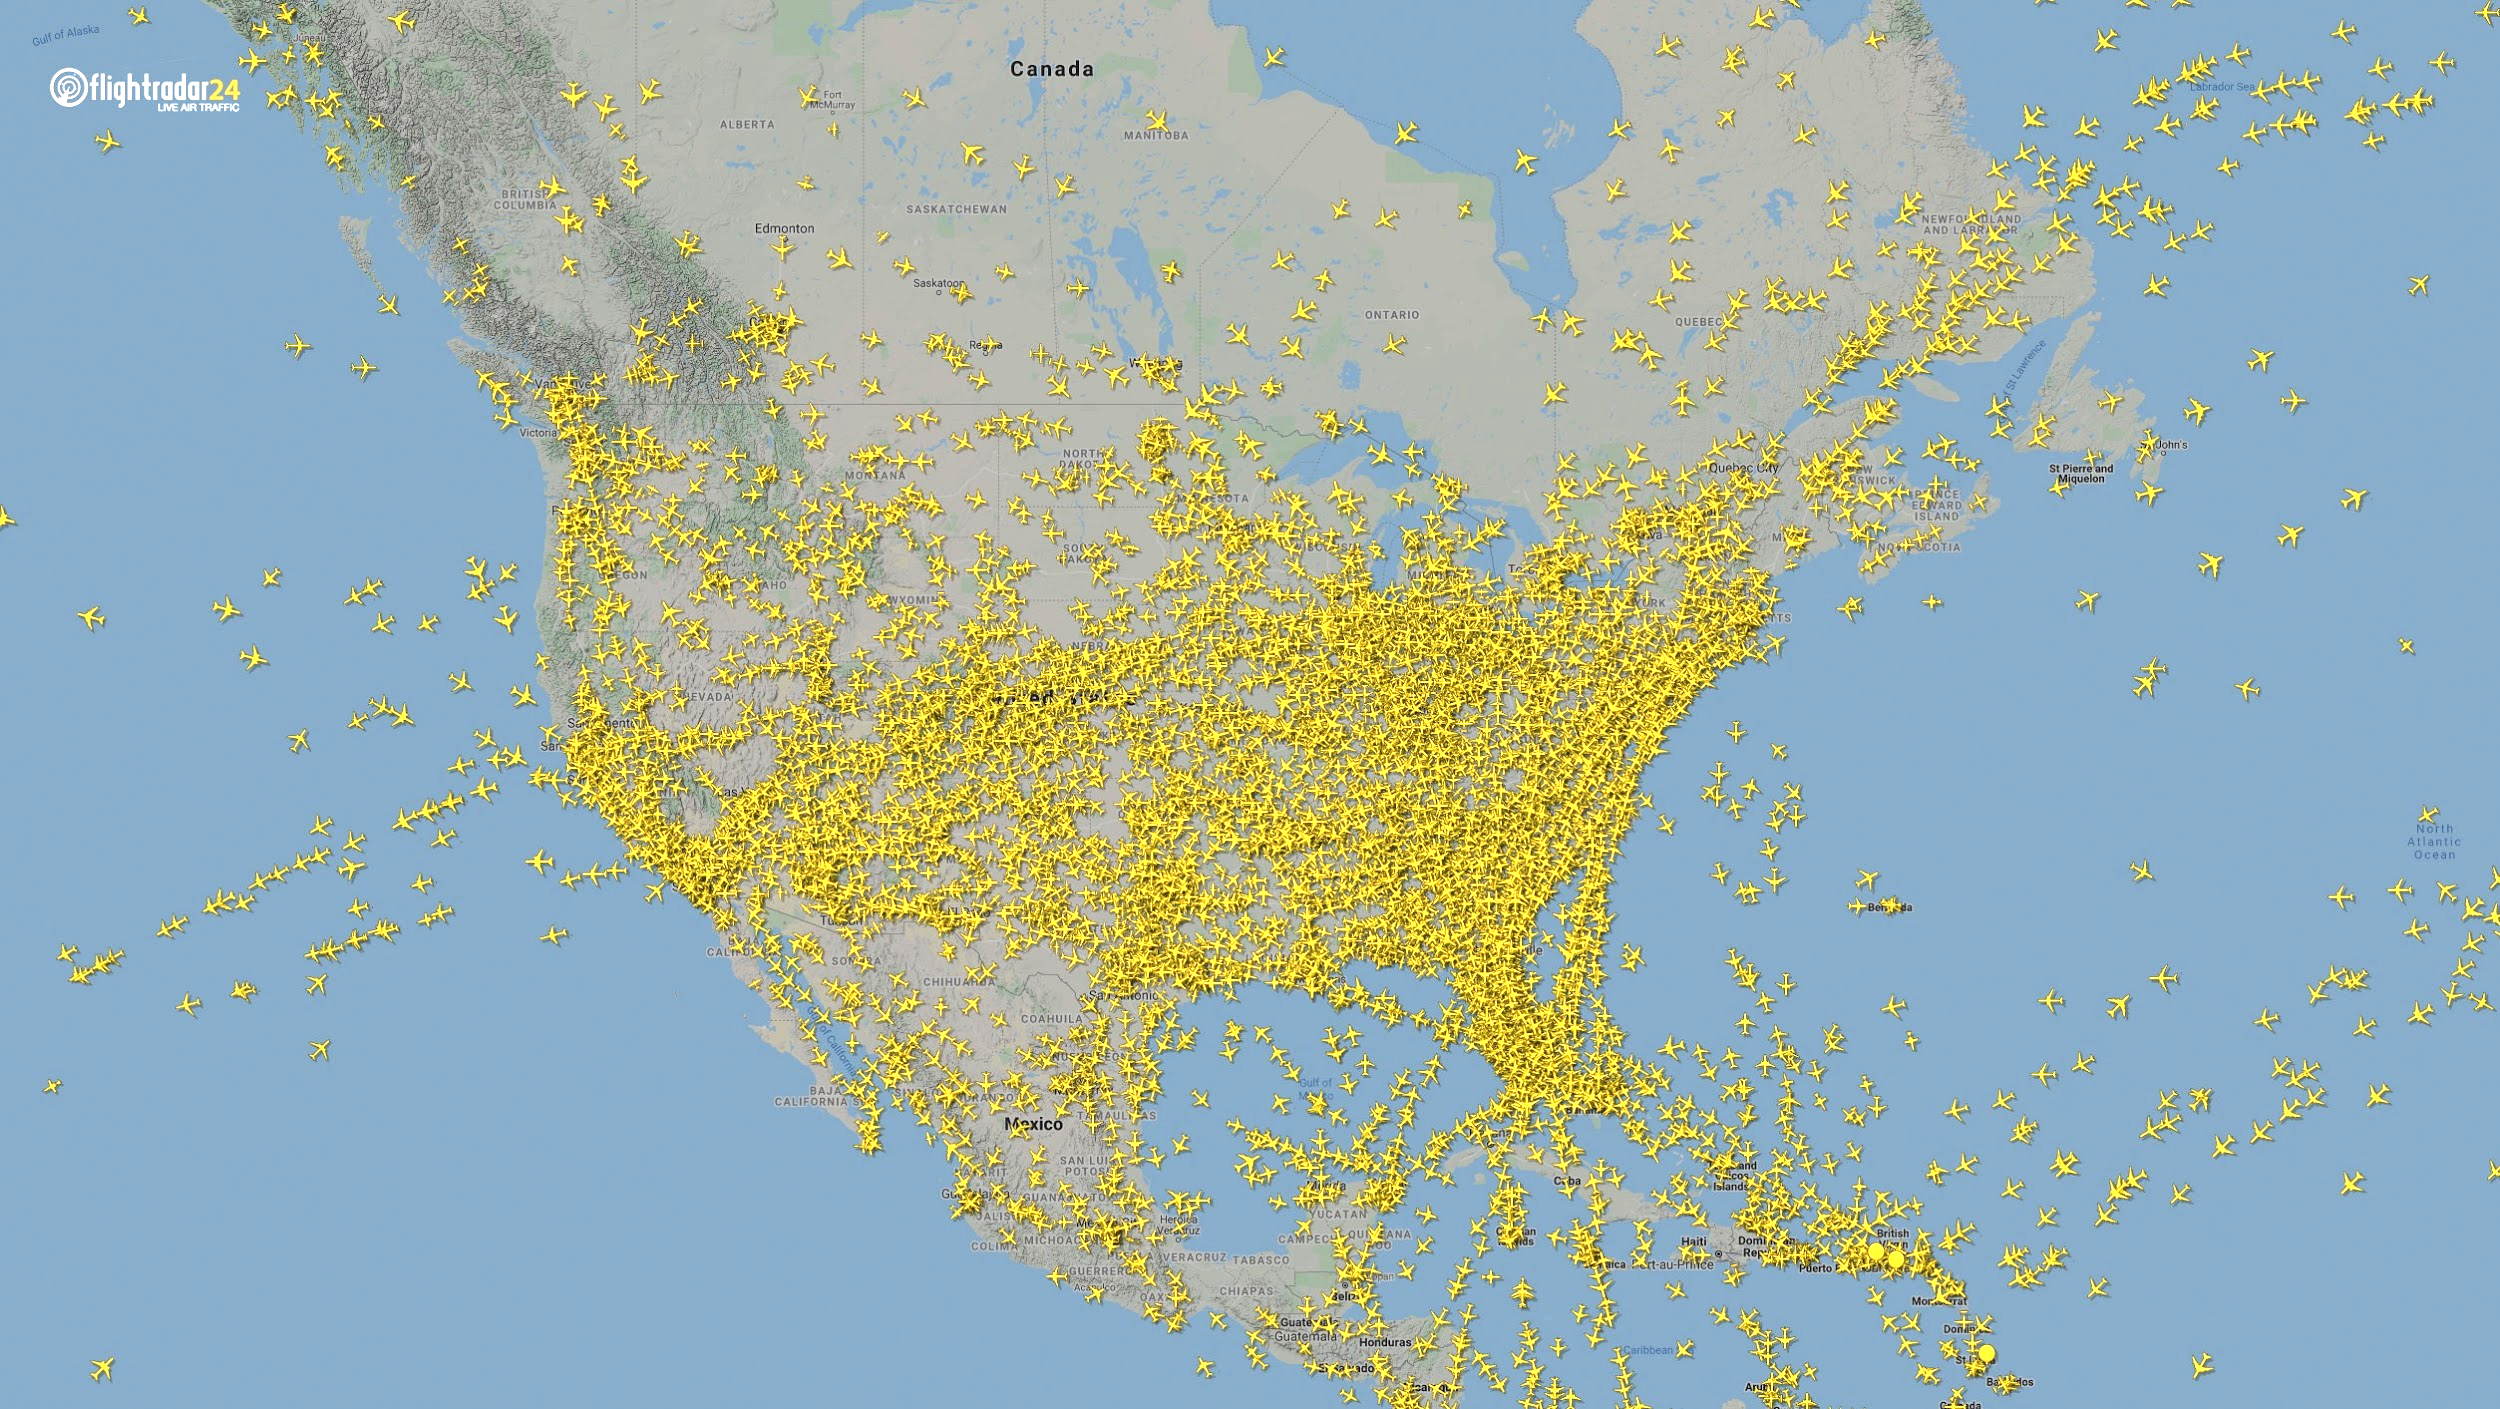
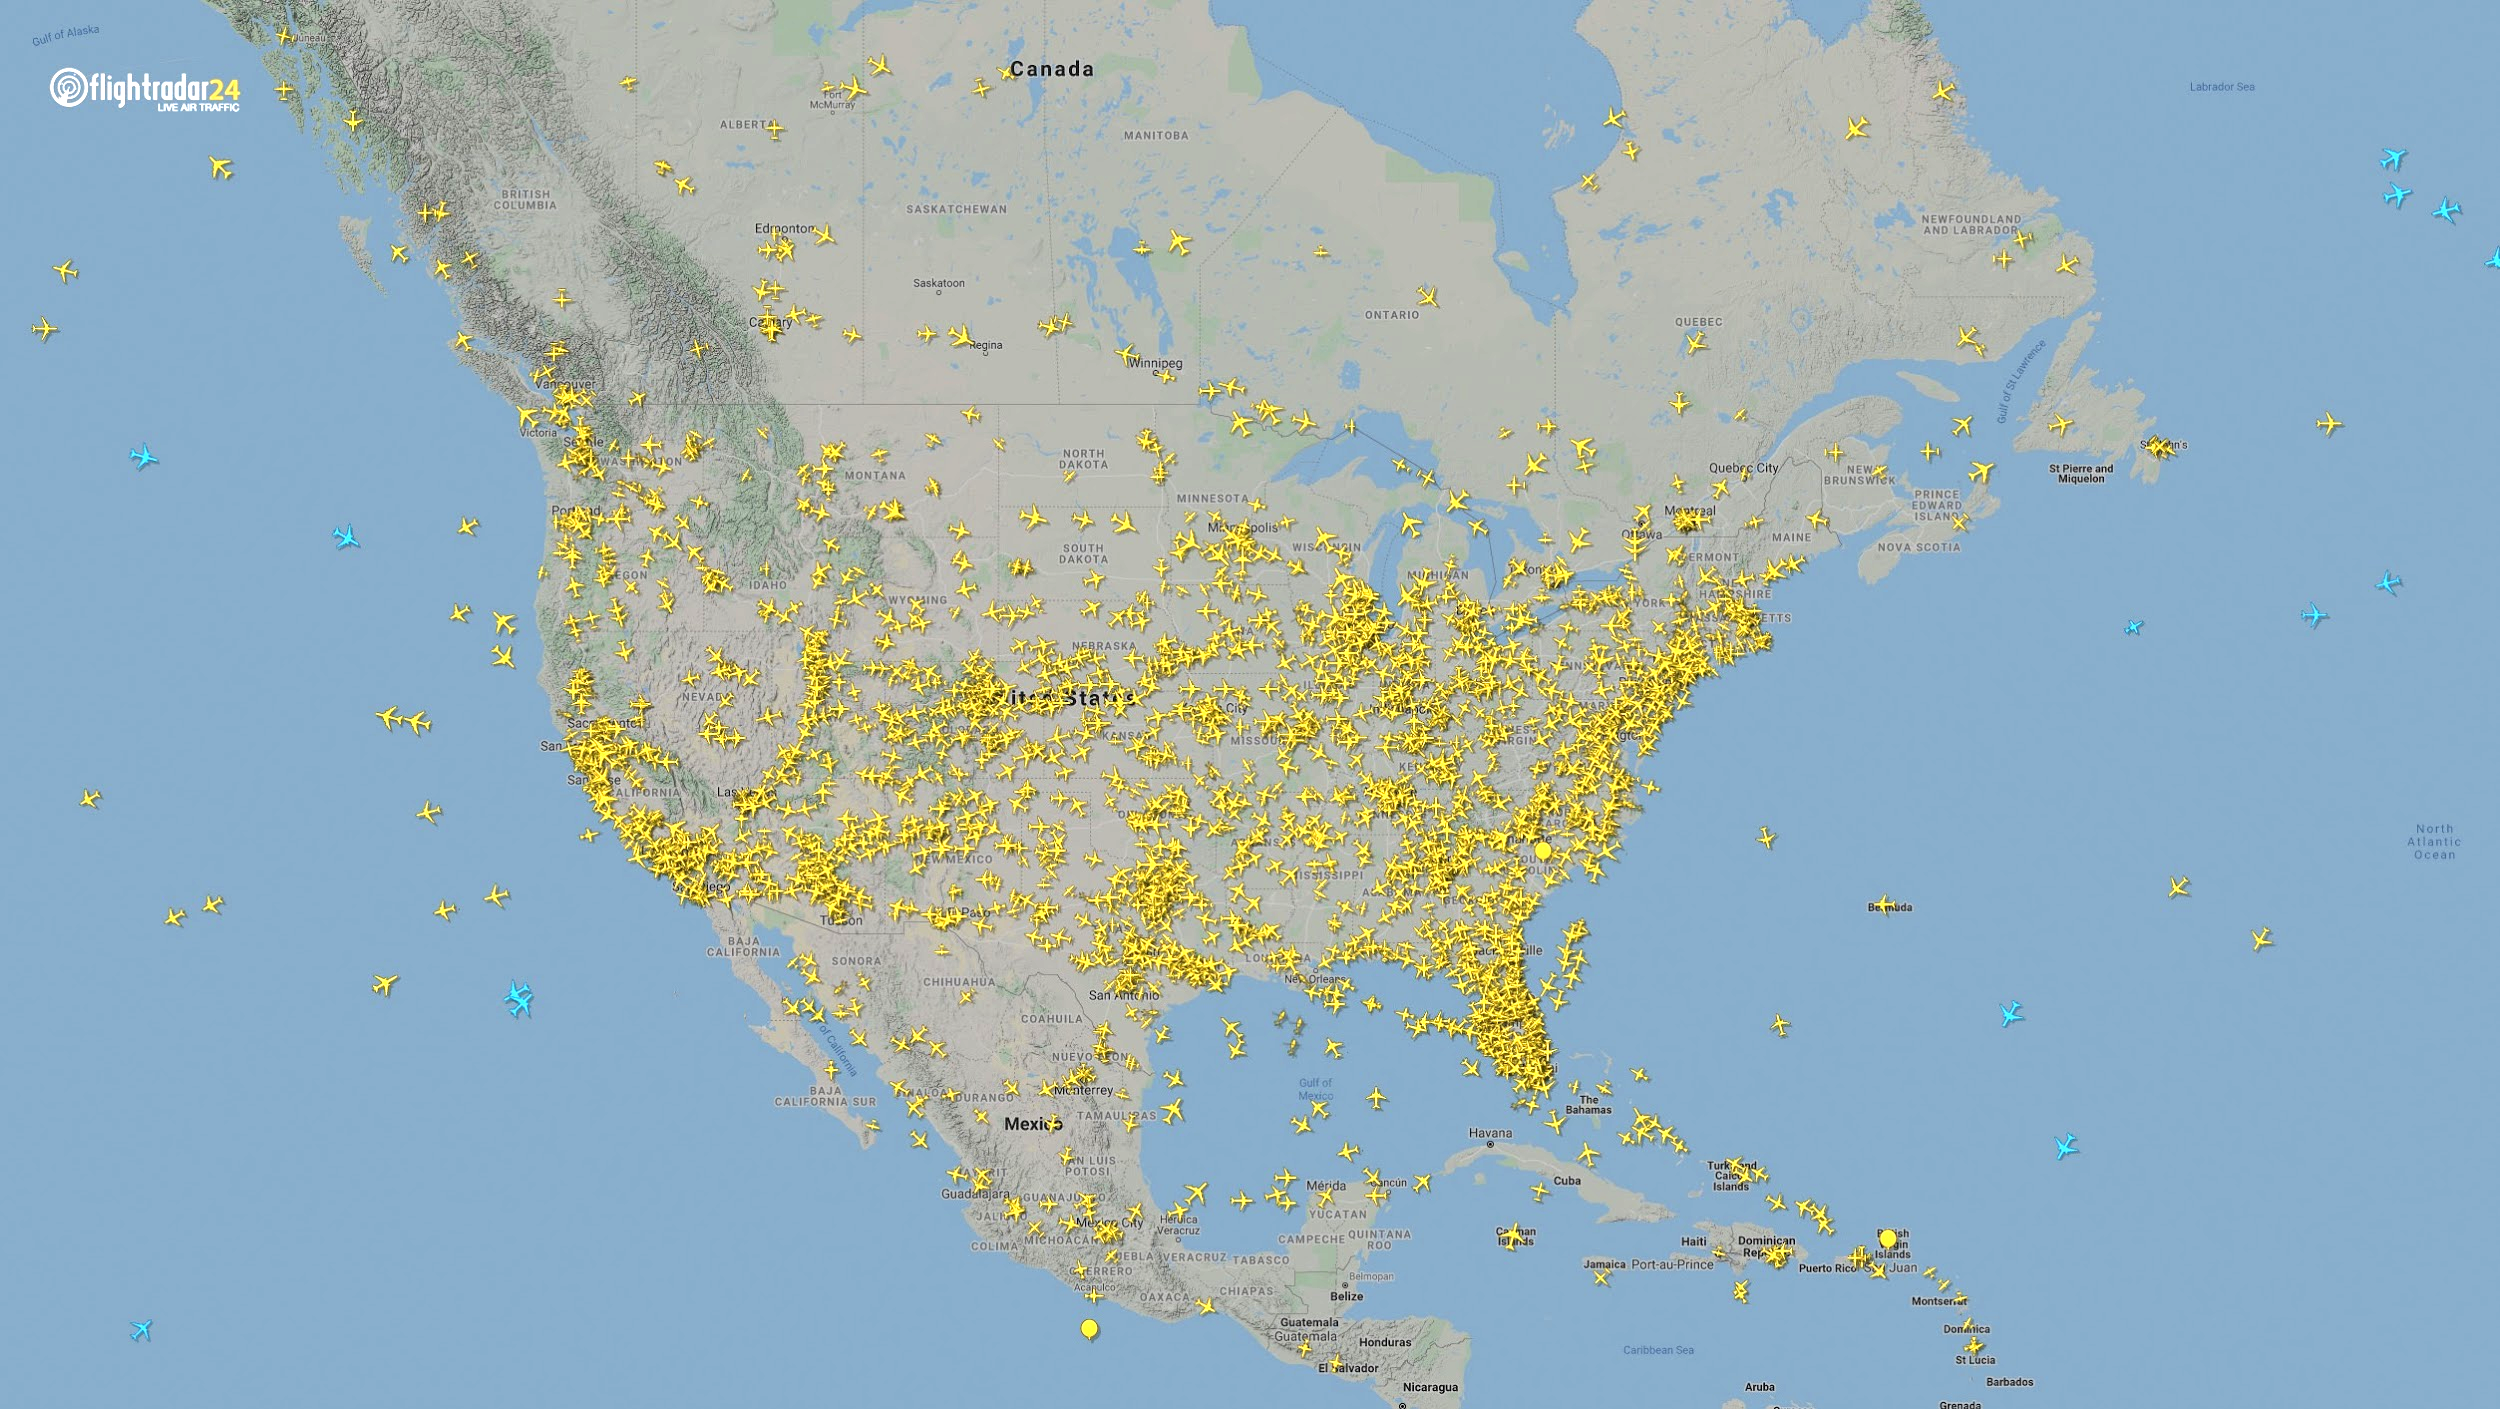
    Air traffic over Europe March 7, 2020. (Source: Flightradar24)
    Air traffic over Europe March 7, 2020. (Source: Flightradar24)
    Air traffic over Europe April 7, 2020. (Source: Flightradar24)
    Air traffic over Europe April 7, 2020. (Source: Flightradar24)

    North America

    Though air travel has been disrupted across North America, the United States remains significantly more busy than its neighbors. The March 7 image shows 8,400 flights while the April 7 image shows 2,950 flights, most of them concentrated over the United States.
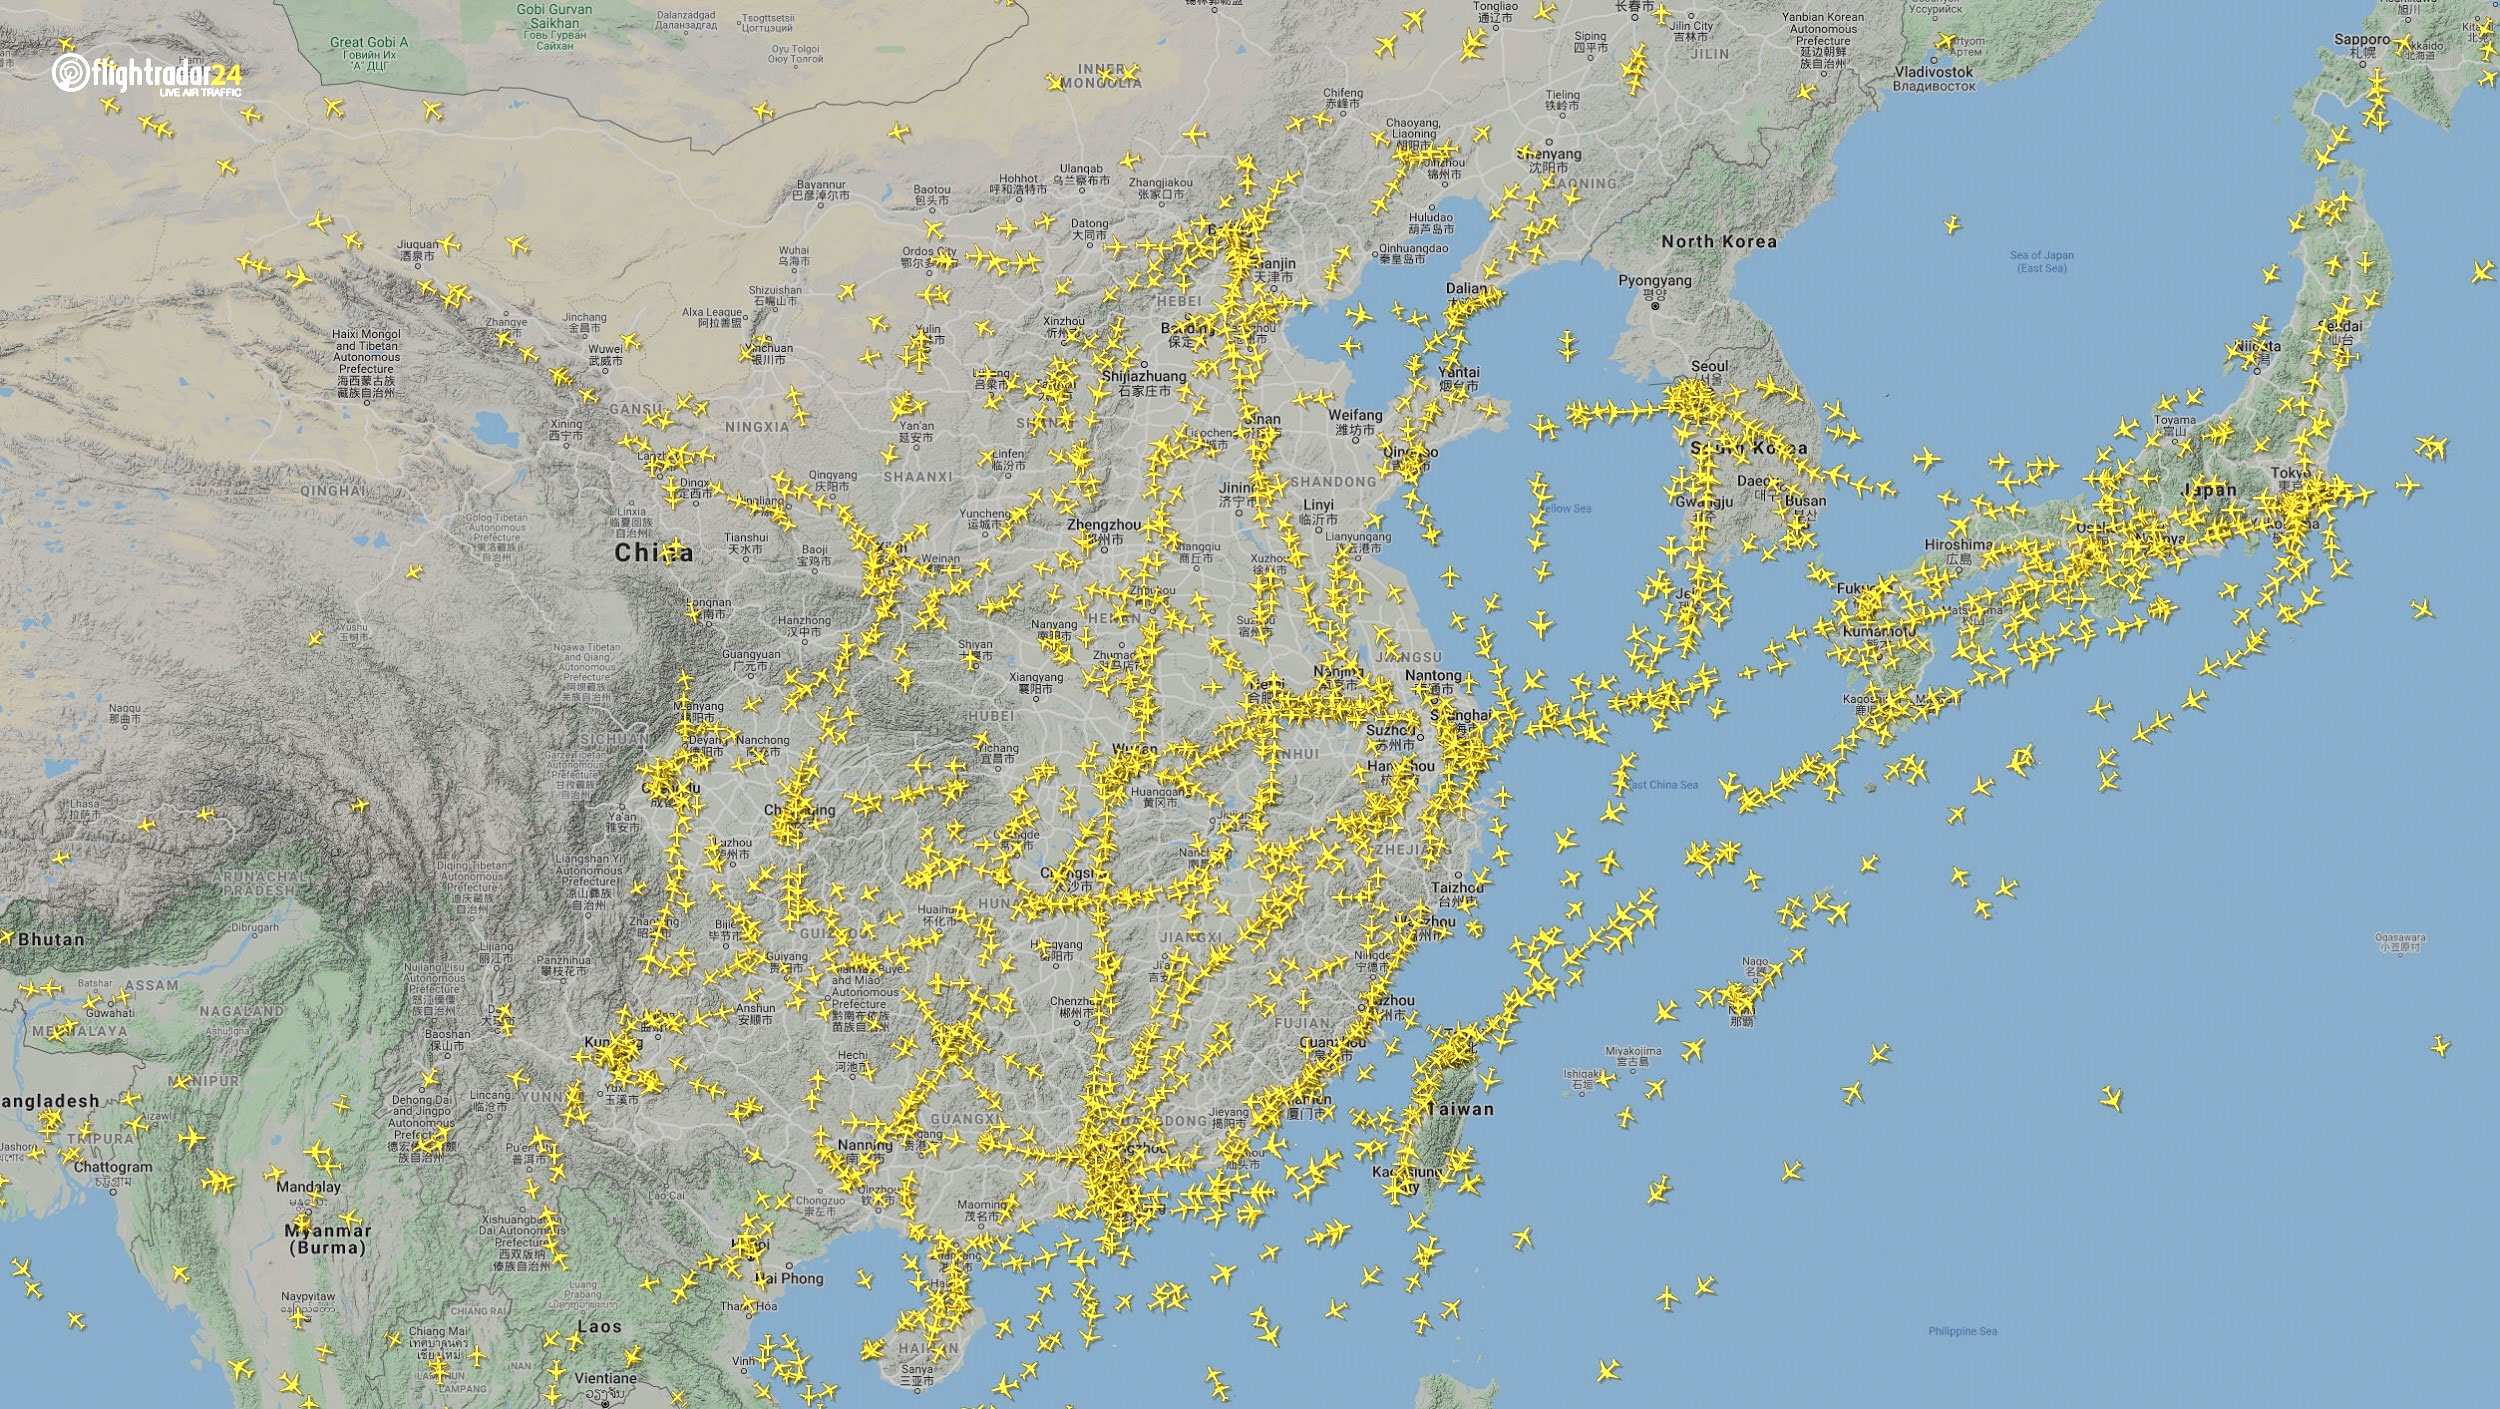
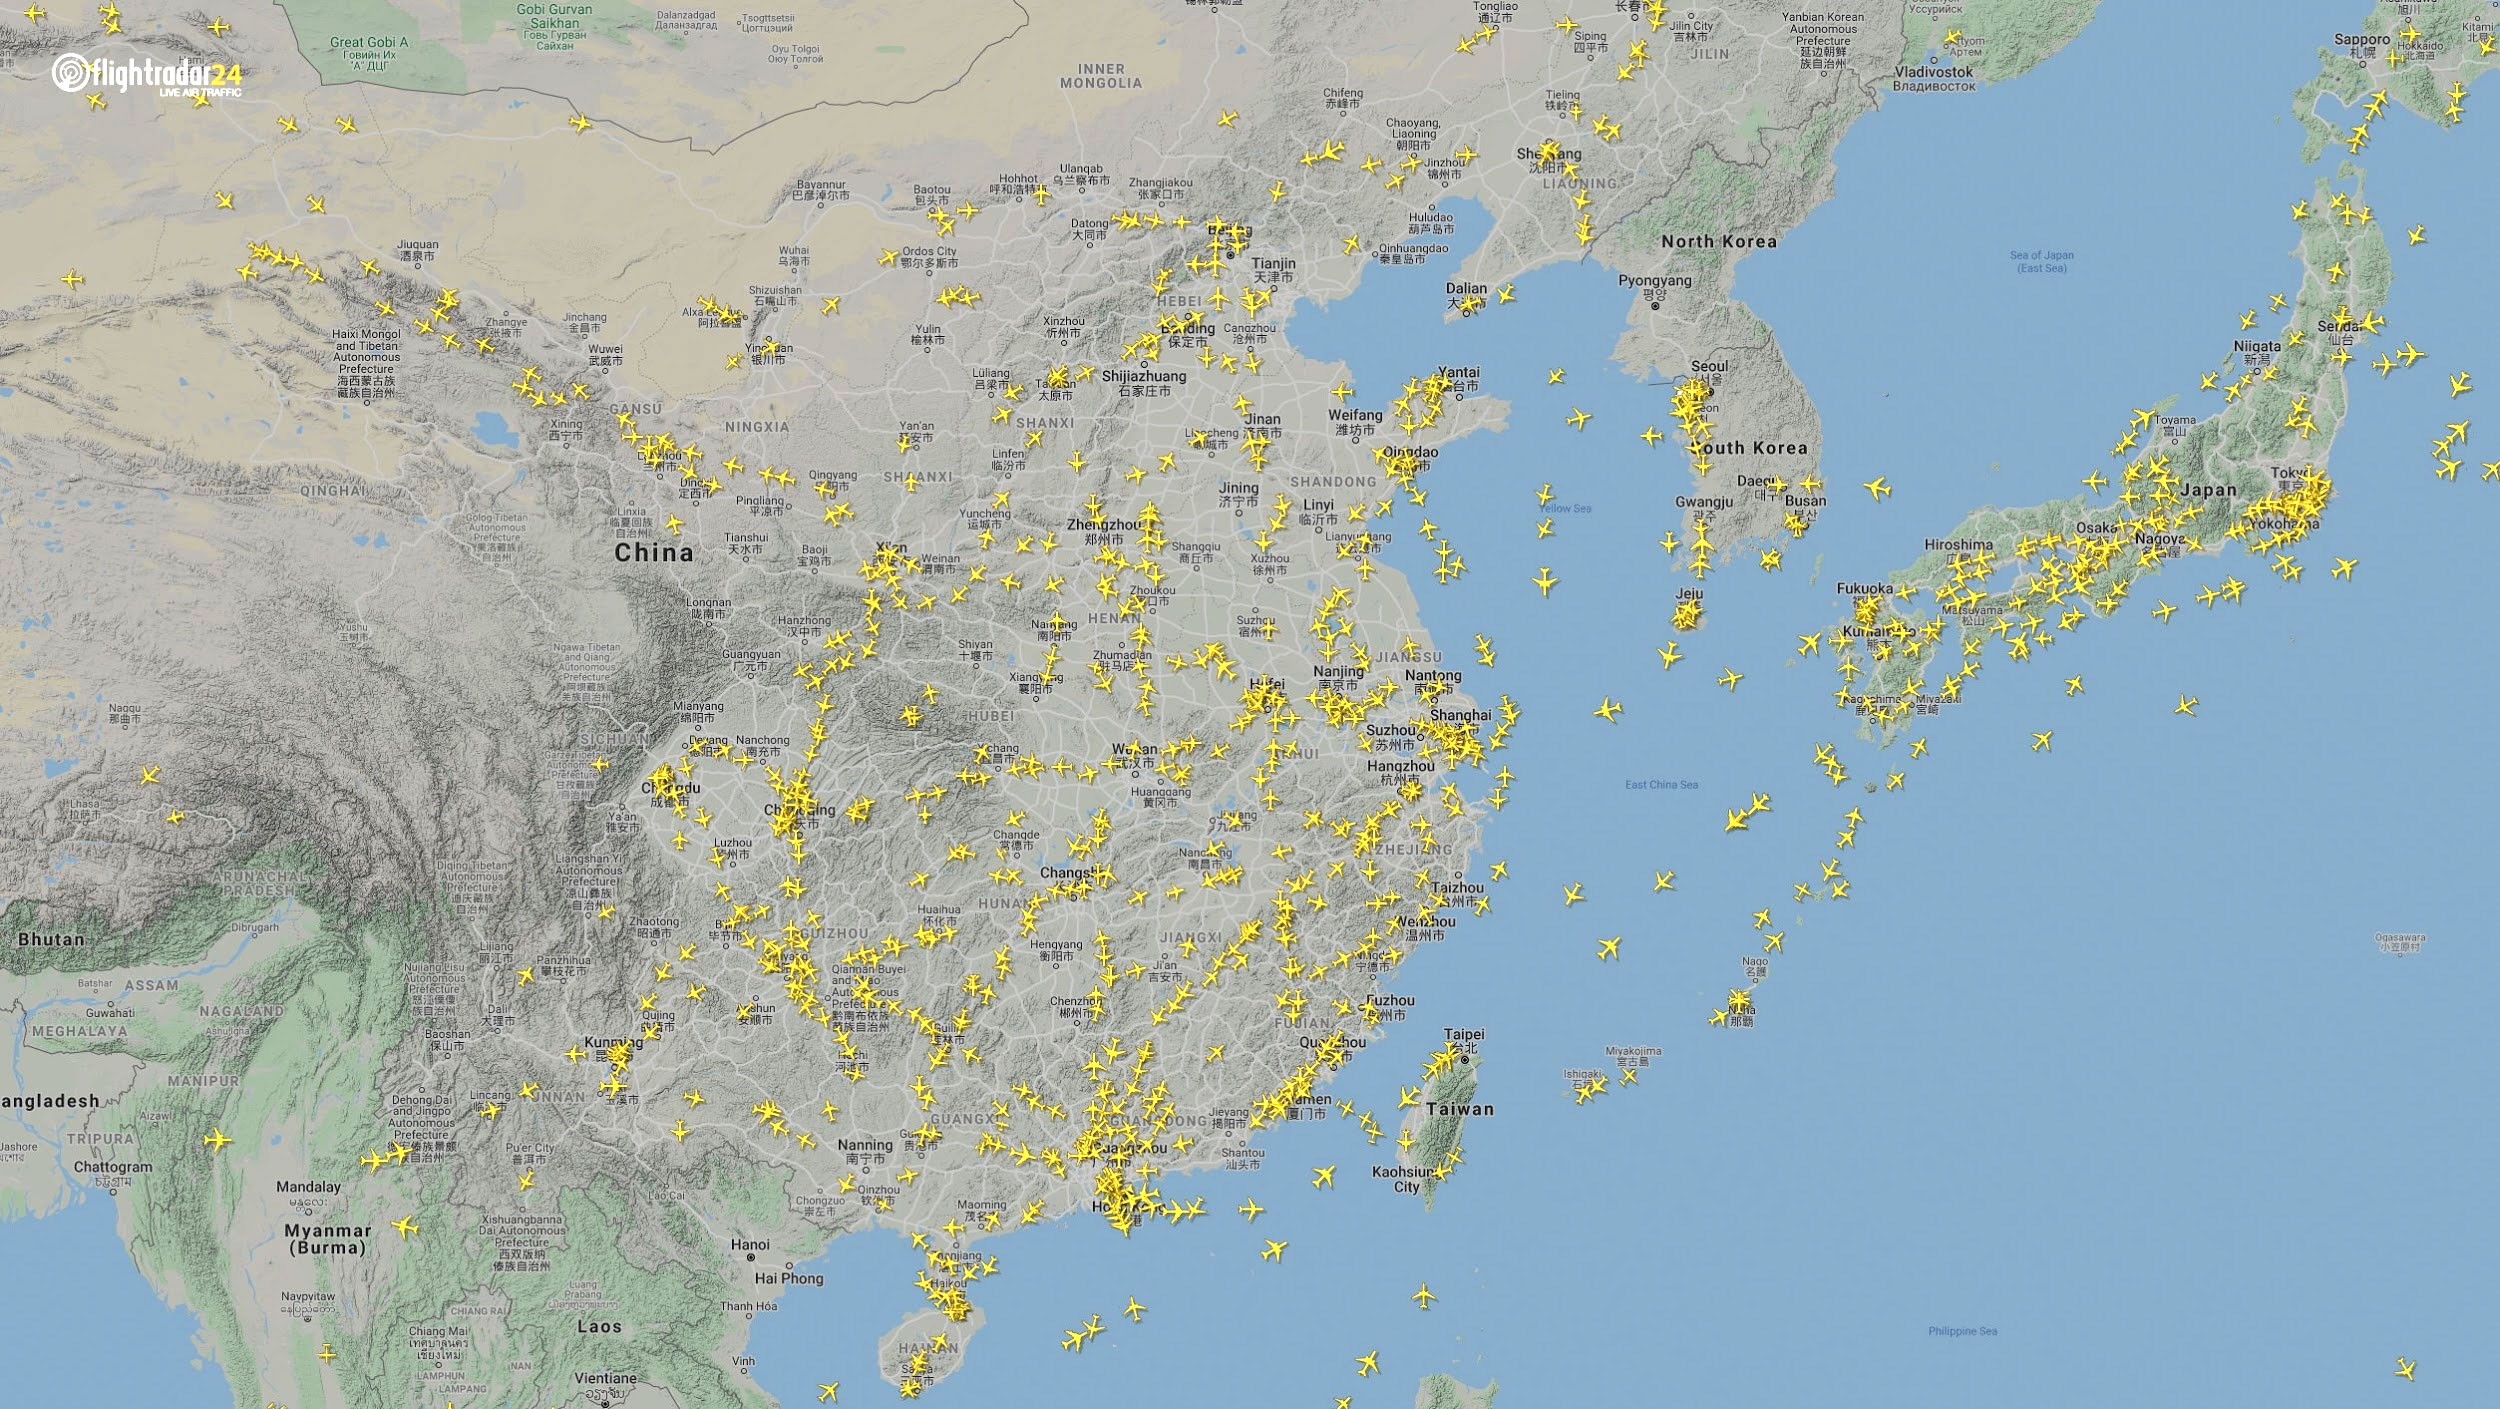
    Air traffic over North America March 7, 2020. (Source: Flightradar24)
    Air traffic over North America March 7, 2020. (Source: Flightradar24)
    Air traffic over North America April 7, 2020. (Source: Flightradar24)
    Air traffic over North America April 7, 2020. (Source: Flightradar24)

    East Asia

    The decrease in air traffic over East Asia has been severe and persistent. Since China and its neighbors began to experience a trade downturn as early as the third week of January, we can compare January 7 to April 7 to capture the effects of the coronavirus. As of late July, air traffic at China’s busiest airports was still down approximately 60% from normal levels.

    Air traffic over East Asia January 7. (Source: Flightradar24)
    Air traffic over East Asia January 7. (Source: Flightradar24)
    Air traffic over East Asia April 7. (Source: Flightradar24)
    Air traffic over East Asia April 7. (Source: Flightradar24)

    Ground

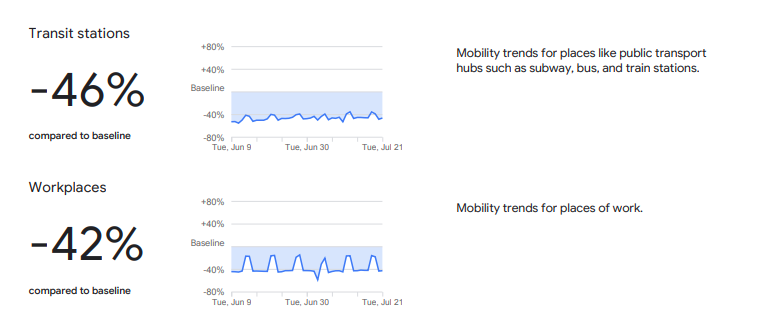
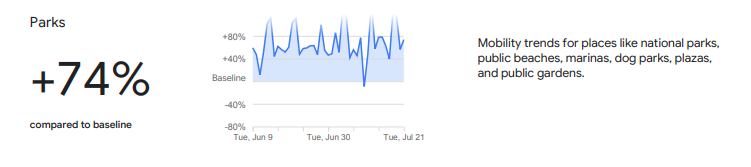
    Google has released — and continues to update — a series of community mobility reports that chart movement trends in public spaces. The reports are a compilation of GPS data for Google users across the world.

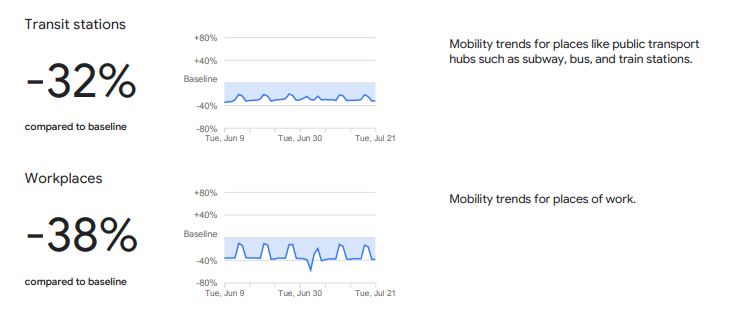
    Mobility changes are particularly stark for regions hit hard by the coronavirus. New York state showed a 46% reduction in visits to transit stations and a 42% reduction in visits to workplaces in June and July compared to pre-pandemic baseline levels. New Yorkers are also visiting parks 74% more often.

    Screenshot: Google
    Screenshot: Google
    Screenshot: Google
    Screenshot: Google

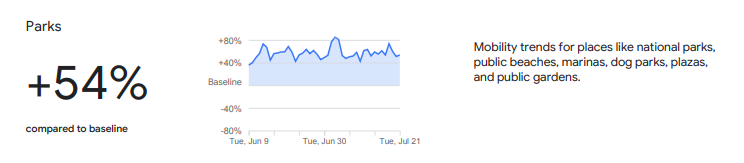
    Trends in the United States as a whole are also dramatic.

    Screenshot: Google
    Screenshot: Google
    Screenshot: Google
    Screenshot: Google

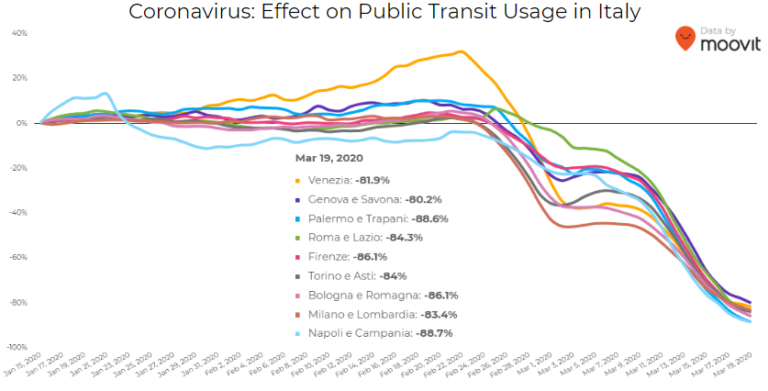
    Israeli journey-planning app Moovit is using mobile phone data to document trends in public transit ridership. Many of the world’s largest metropolitan cities experienced a steep decline in ridership between mid-January and late March. Millions of people that rely on mass transit have had to cope with cumbersome rules and the danger of catching the virus itself. Efforts to reduce overcrowding on trains and buses have translated into reduced capacity requirements and therefore, lengthy wait times. The rise of remote work has also lowered public transit ridership.

    Screenshot: Moovit
    Screenshot: Moovit

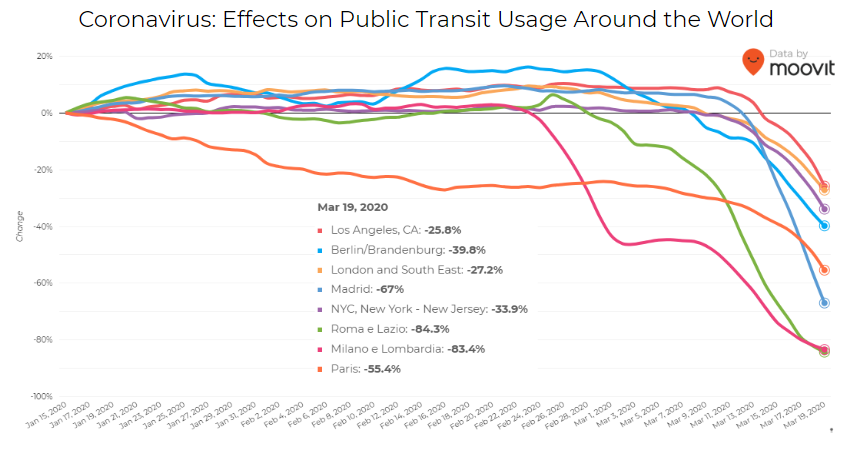
    Italy was hit particularly hard – and early – by the pandemic. Two large outbreaks occurred in Northern Italy in late February, prompting widespread closures and government-mandated quarantines in Lombardy and 14 neighboring provinces. Public transit ridership plummeted when the quarantine took effect in early March.

    Screenshot: Moovit
    Screenshot: Moovit

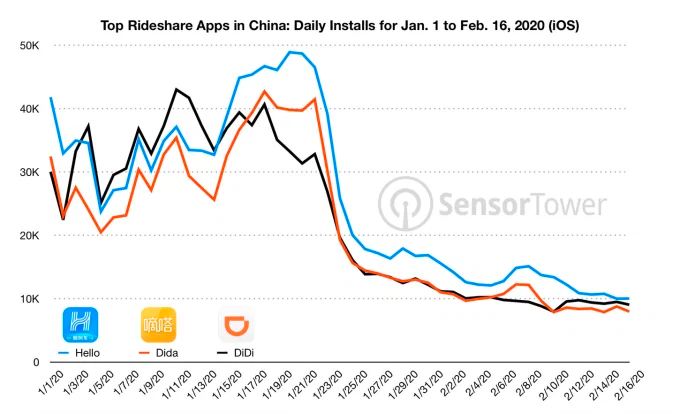
    Usage of GPS-reliant ride-hailing apps has also dropped severely. Daily installs of China’s three biggest ride-hailing apps were down 75% the week of February 10 compared to the same week in 2019.

    Source: Sensor Tower
    Source: Sensor Tower

    American ride-hailing giants Uber and Lyft have seen similar losses. However, business for food delivery apps like Uber Eats and Grubhub are on the rise as more people stay home instead of grocery shopping.

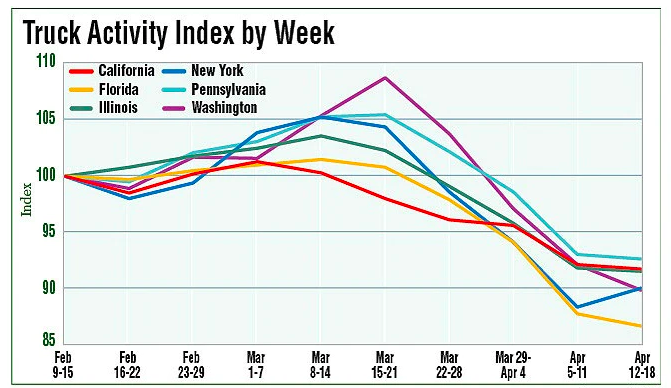
    The impacts of COVID-19 have been less severe — but still significant — for the trucking industry. The U.S. trucking industry is an economic powerhouse, typically generating over 700 billion in annual revenue and transporting 72.5% of American freight. The American Transportation Research Institute generated a truck activity index based on GPS data across six states from the week of February 9 to the week of February 12. The data shows an initial spike in trucking operations due to increased demand for consumer goods and medical supplies. However, as stay-at-home orders and restrictions ceased business operations across the country, truck activity declined.

    Source: American Transportation Research Institute
    Source: American Transportation Research Institute

    Coronavirus safety restrictions adopted by countries across the world have generally begun to loosen up, for better or for worse. It will be interesting to see how the coming months unfold through the lens of GNSS data.


    Roi Mitt works for Regulus Cyber, a company researching GPS cybersecurity and offering various software products to protect the integrity, reliability and security of GNSS devices. The company’s products are designed for multiple industries using GPS-based time and location, in order to ensure a future in which GNSS technology is safe and reliable to use.

    Sources

    https://www.mhlnews.com/global-supply-chain/article/21136753/global-trade-activity-falls-in-q2-but-moving-up

    https://www.businesswire.com/news/home/20200715005157/en/Global-Trade-Activity-Falls-14.8-Q2-Tradeshift

    https://www.wto.org/english/news_e/pres20_e/pr855_e.htm

    https://www.theguardian.com/science/2020/jun/25/spacewatch-china-launches-final-beidou-satellite-rival-gps-navigation-system

    https://thediplomat.com/2020/06/chinas-answer-to-gps-is-now-fully-complete/

    https://www.reuters.com/article/us-space-exploration-china-satellite/china-puts-final-satellite-into-orbit-to-try-to-rival-gps-network-idUSKBN23U08P

    Then and now: visualizing COVID-19’s impact on air traffic

    https://www.gstatic.com/covid19/mobility/2020-07-21_US_Mobility_Report_en.pdf

    https://www.gstatic.com/covid19/mobility/2020-07-21_US_New_York_Mobility_Report_en.pdf

    https://www.ttnews.com/articles/trucking-industry-revenue-topped-700-billion-2017-ata-report-shows

    https://www.trucking.org/news-insights

    https://www.refrigeratedtransporter.com/covid-19-coverage/article/21129910/atri-new-data-show-covid19-impacts-on-trucking

    This Week in Apps: Coronavirus impacts app stores, Facebook sues mobile SDK maker, Apple kicks out a cloud gaming app

    https://www.researchgate.net/figure/Figures_fig1_343271722

    https://www.nytimes.com/aponline/2020/08/04/world/europe/ap-eu-virus-outbreak-norway-cruise-ship.html

    https://www.cdc.gov/media/releases/2020/s0716-cruise-ship-no-sail-order.html

    The Cruise industry’s COVID-19 crisis: how bad is it really?

  • Mobile Mark offers 5G fleet management antenna for GNSS, Wi-Fi

    Mobile Mark offers 5G fleet management antenna for GNSS, Wi-Fi

    The new Mobile Mark nine-cable LTMG944 multiband antenna is designed for 5G-ready routers and gateways covering dual-carrier LTE MIMO, Wi-Fi MIMO and GNSS.

    LTM508 antenna. (Photo: Mobile Mark)
    The LTM508 antenna. (Photo: Mobile Mark)

    The 9-in-1 dual-carrier antenna expands Mobile Mark’s LTM series, used for public transit communications, public safety and vehicle fleet management. It contains nine separate antenna elements housed within a single antenna radome. The antenna has:

    • four cellular/LTE elements
    • four Wi-Fi elements
    • one GNSS element covering GPS, GLONASS and Galileo.

    The LTM900 series can also be configured with fewer elements — for example, the LTMG942 contains four LTE, two Wi-Fi and one GNSS element.

    The LTMG944 model can be paired with multi-connection 5G-ready routers and gateways already on the market. The cellular/LTE elements are designed to accommodate dual-carrier MIMO coverage (i.e. 2xMIMO on two different cellular carriers) or 4xMIMO for 5G.

    Complete cellular coverage is offered from 694-960 and 1710-3700 MHz, with GNSS coverage on GPS and Galileo (1575 MHz) and GLONASS (1612 MHz), and dual-band Wi-Fi coverage on 2.4 and 5 GHz.

    “Our new dual-carrier antenna solution series is compatible with the latest fleet management modems and routers offering dual-carrier coverage,” said Michael Berry, Mobile Mark president and CEO. “A single antenna provides MIMO coverage for each carrier.”

    The antenna also provides broadband coverage. “We are happy to report that Mobile Mark’s new 9-cable 5G-ready antennas are in production today with efficient, 5 dBi gain on the FCC allocated 5G mid-bands of 3550-3700 MHz as well as being backwards compatible for other cellular frequencies,” Berry said.

    The antenna is housed in the attractive, recognizable LTM radome in a choice of black or white. It is sold as a kit with 1-foot pigtails (LMR-100 except RG174 on GPS) and 14-foot jumper cables. The antenna elements fit in a compact radome that measures 5.5-inches in diameter by 2.38 inches high (140 mm x 60 mm). The LTMG944 series antennas are available as surface mounted antennas, but not as mag-mounts.

    For high-vibration applications such as mining or large earth-moving equipment, Mobile Mark has developed a proprietary construction technique with superior shock and vibration test results. This option is available for the LTM944 series antennas.

    The dual-carrier antenna is made in the USA, in Mobile Mark’s Itasca, Illinois, factory.”

  • PCTEL showcases 4×4 LTE multi-GNSS antennas at InnoTrans

    PCTEL showcases 4×4 LTE multi-GNSS antennas at InnoTrans

    PCTEL Inc. will demonstrate its next generation of multi-band, multi-network 4G LTE antennas at InnoTrans 2018 for the transit and rail industries, which takes place Sept. 18-21 in Berlin.

    PCTEL’s new Trooper II and Coach II dual-carrier antenna platforms are designed to meet the requirements of increasingly complex RF communication systems in transportation applications.

    The Trooper II antenna. (Photo: PCTEL)
    The Trooper II antenna. (Photo: PCTEL)

    Both Trooper II and Coach II antennas feature four 4G LTE antenna elements, and four 802.11ac Wi-Fi MIMO elements compatible with the world’s leading multi-network cellular routers.

    The antennas support carrier aggregation for high-speed data transmissions in dense RF environments, such as transit depots and rail stations.

    They also incorporate PCTEL’s proprietary high-rejection multi-GNSS technology for high precision tracking and asset management. Both platforms are housed in attractive low-profile housings and can be easily installed on all types of mass transit vehicles, or even fixed surfaces, the company said.

    “PCTEL has a strong portfolio of products for rail and mass transit applications,” said Rishi Bharadwaj, PCTEL’s COO. “Our products have been qualified and deployed by major railroad equipment manufacturers and operators for over a decade. We are excited to showcase our industry-leading technology and capabilities at InnoTrans.

    “High-performance antennas play a crucial role in the implementation of wireless technologies to improve safety and operational efficiency,” Bharadwaj said. “PCTEL’s innovative MIMO antenna technology also enables transit operators to deliver a better passenger experience through more reliable high-speed internet access.”

  • Mapillary Partners with Esri to Provide Real-Time Street Photos

    Mapillary-O

    Mapillary, a community-based mapping photo app, is partnering with Esri to help governments and businesses see their cities evolve in real-time through the ArcGIS platform integration.

    Mapillary creates detailed maps that go beyond street view by instantly stitching together hundreds of thousands of crowd-sourced photos, giving cities the ability to gain insights immediately rather than weeks or months later. The ArcGIS integration provides governments and cities with a tool to help them manage inventory and city assets, monitor repairs, inspect pavement quality, assess sites for public transportation projects, and more.

    With ArcGIS support, Mapillary users will be able to:

    • Navigate photos in a web-based viewer
    • Load any ArcGIS data layer or base map
    • Use Mapillary street-level photos to edit and update their data
    • Automatically sync edits back to ArcGIS Online.

    Learn more at the Mapillary website.

  • TomTom Selected by University of Minnesota’s Accessibility Observatory

    TomTom’s map and traffic information have been chosen by the University of Minnesota’s Accessibility Observatory as part of a new national accessibility data set.

    TomTom will provide map and historical speed data to help analyze accessibility to jobs for driving and transit for metropolitan areas across the United States. For transit data, the Observatory is relying on open, public sources using a method developed at the University with support from the Center for Transportation Studies.

    Study partners will be able to use this data for policy development, local transportation system evaluation, performance management, planning and research efforts. Each partner will have direct digital access to the accessibility datasets for the jurisdictions of all partners and will receive detailed reports of local accessibility trends and patterns. The Minnesota Department of Transportation is the lead agency and coordinator for the national pooled-fund study. Other participating agencies are the Federal Highway Administration (FHWA) and the DOTs of California, Florida, Iowa, North Carolina, Virginia and Wisconsin.

    “Today’s transportation user wants more than mobility — they want accessibility and they want MnDOT to invest in the appropriate solution, at the right place, at the right time, and at the appropriate cost,” said Tim Henkel, division director of modal planning and program management at MnDOT. “The Accessibility Observatory offers solutions to these decision-making challenges.”

    The Transportation Pooled Fund Program, part of the National Cooperative Highway Research Program, allows state DOTs, FHWA program offices, and other organizations to combine resources and achieve common research goals. Additional partners are welcome to join the study.

    “We’re excited that the UMN Accessibility Observatory has selected TomTom to help provide geospatial and transportation information for this project,” said Ralf-Peter Schäfer, head of traffic at TomTom. “We are confident that the TomTom map and traffic content will contribute to a better understanding of job accessibility nationwide.”

  • Autonomous Vehicles Are Coming…But When?

    IAV_OMD_3760 Photo: Denso
    IAV Automotive Engineering test vehicle. Photo: Denso

    The autonomous, or driverless, vehicle market seems to be a big side topic at connected car conferences. Location technology will continue to play a role in the development of autonomous vehicle markets. However, many view a fully autonomous vehicle to be more than 10 years away — these are usually folks from the auto industry or academia. Others, those who lurk around Silicon Valley, believe that driverless cars will be on the road in half that time…and once again, if Detroit doesn’t move on it, they will.


    Just as GPS was once thought of as science fiction — something that naysayers said would not be fully operational for decades — autonomous vehicles are now thought of as an extension of the connected vehicle market. However, technology and legal issues will make the implementation of an autonomous, or driverless car, a tenuous road in the next few years.

    One executive from Verizon Telematics, which is a major player in connected car technology, said it is going to take time, perhaps between the years 2025-2030, to grow the autonomous vehicle market.

    “You just can’t flip a switch and have autonomous vehicles [on the road]. You have to take baby steps to develop a network, build an infrastructure and condition the marketplace,” said Kevin Link, Verizon Telematics senior vice president. “The collaboration is going to have to be more than one player, including the government. It was a while before desktop computers evolved into laptops.”

    While the technology hurdles will be significant for autonomous vehicles, there are features today that will help shape the market, Link said. “Mercedes cars remind people to steer and turn around corners, when to stop at a safe distance and to change lanes,” he said. “These are not taking you from point A to point B autonomously, but real-time connected car features will feed into the autonomous car.”

    The evolution of autonomous vehicles will not be derailed at this point, given the intensive research and investment focus from both the private and public sector, said Tim Johnson, NextEnergy director of transportation initiatives. “However, cars that ‘drive themselves’ will not be in mass production in the next five years. Ten years, maybe. Five, no,” he said. “This is not a technology-limited premise. The technologies are rapidly approaching realistic use in limited applications, but the regulatory, liability and infrastructure aspects are far from being fully implemented in the next five years.”

    Technology Hurdles Await Early Autonomous Vehicles — More Regulation than Technology?

    Some of the technology hurdles center around the speed, capacity and logic of the vehicle and infrastructure systems to manage the significant amount of information required for self-driving vehicles, Johnson said. “If it was possible to wave a magic wand and have all vehicles made simultaneously capable of these communications and logic decisions, it would be much more viable to create a mass, public environment for self-driving cars,” he said. “In reality, there will be an extensive transition period, possibly 15 to 20 years, where capable vehicles will need to deal with incapable vehicles. Once again, this is not so much a technology issue as it is policy, regulation and liability.”

    Autonomous Products Already Out There…

    Autonomous vehicles will only continue their current momentum as the technology for assisted driving is already well underway with features like self-parking, lane departure warning, predictive collision warning, back-up collision intervention and blind spot prevention, said Scott Frank, Airbiquity vice president of marketing.

    An example is the Infiniti Q50, which uses Airbiquity technology for Infiniti InTouch Apps. “What we’re going to see from here is a shift from driver assistance to zero driver involvement — the ultimate expression of autonomous vehicle — where the car does all the driving and there isn’t even a steering wheel or brake pedal,” Frank said. “We won’t see fully autonomous vehicles becoming commonplace in five years’ time due to the massive amount of technology, infrastructure development and integration that needs to happen to ensure the requisite amount of safety.”

    NextEnergy’s Johnson said that cars that drive themselves are already in use in restricted access sites, such as military bases, restricted commercial and university locations, national lab campuses and more. “These are the first real-world applications of both the vehicle and infrastructure technologies to test the practical limits of semi-autonomous driver-still-behind-the-wheel cars,” he said. “Much like the FAA use of limited test sites for the development of regulatory aspects of drone flight, these sites are providing the information and insight to move the potential of cars that drive themselves closer to everyday use.”

    Denso-W Photo: Denso
    A Denso autonomous test vehicle drives the track while a plastic friend looks on. Photo: Denso

    Will Public Transit Be the First Proving Ground?

    Most companies have different opinions when asked whether the public transit area will be the first major market, and serve as the catalyst, for autonomous vehicle growth. “Although we don’t know for sure, it could be that automated public transit programs, will operate in controlled environments with known routes [meaning low speed operation with pedestrians/bicycles operating on the same thoroughfare, but the automated transit system does not have rails or guide ways — the route planning is easily changeable with no impact to the transportation infrastructure],” said Roger Berg, Denso North American Research and Development office vice president.

    Denso believes the autonomous vehicle market will encourage additional functionality within the premium car model lines, but gradually these advanced driver assist systems will become more and more common and eventually spread through even the economy car segment, Berg said. “First systems deploy warnings or simple lateral and longitudinal vehicle control. But then functionality for what most people refer to as ‘driverless cars’ or ‘automated driving’ would only be usable under fairly benign driving and traffic conditions, such as some level of automated highway driving,” he said.

    Public transit as an “early adopter” business model is viewed to be less probable in the near term as many of the technical challenges facing autonomous operation require significant research and development and capital investment, said Chris Hennessy, IAV Automotive vice president, engineering. “Most of this capital is centered on markets where the return on the investment can be substantial. At the moment, the most likely scenario for a reasonable ROI is in the premium-brand automotive market, where consumers are willing to pay a premium for new technology,” he said. “This market and the technology growth that will occur from this early-adopter market will provide a foundation for cost-effective proliferation of this technology to other markets, where either the operational boundary conditions are narrower or the available capital is lower, which is typically where public transit would fall. Exceptions to this condition could be analogous to the light-rail market, where the interaction to the general public can be controlled and managed with isolated tracks or lanes of travel, but this would require significant planning and capital investment in infrastructure.”

    Airbiquity believes that public transit will not be a first adopter. “No, the first adopters will be private parties in urban areas providing a value proposition to people struggling with congested cities, long commutes, and high parking costs. You’re going to see small and innovative companies offering car services with autonomous vehicles operating on city grids at lower speeds,” Frank said. “They will source the autonomous vehicles from non-traditional automotive makers that move faster than traditional automotive makers. Local government will also be involved, since they own the majority of the infrastructure and need to ensure safety standards are established and met.”

    In other location news:

    • Kore Telematics, fueled by a large investment in it by ABRY Partners, bought RacoWireless in an all-cash deal, according to published reports. The transaction will give the companies a combined 3 million M2M subscribers.
  • Google Maps Has Schedules for One Million Public Transit Stops

    Since 2005, Google has collaborated with hundreds of transit authorities around the world to make a comprehensive resource for millions of riders to find out which bus, train, subway, or tram can take them to their next destination. Today, Google Maps reports it has public transportation schedules for more than one million transit stops worldwide, in nearly 500 cities, including New York, London, Tokyo, and Sydney.

    In support of the database, Google is releasing an update to the Google Maps for Android app (version 6.10). Google said it has made some changes to the Transit Lines layer, so that the user can select a specific mode of public transportation (train, bus, tram, or subway) to display on the mobile map, hiding the other modes. This is helpful in areas where there is a tight concentration of several types of public transit, Google said.

    Left: Mobile map with all modes of public transit shown; Right: Transit Lines layer in Subway mode (Source: Google)

    Google also reported an update to the layout of station pages to be more useful. Users open it by tapping on the name of the station on your mobile map.

    Updated station pages show departure times, lines serving the station and the distance to nearby stations


    In addition to these new transit features, Google has updated region highlighting, My Places, and Location History displays in Google Maps for Android:
    • When a user searches for a city or postal code, the borders of that region are highlighted.
    • Under My Places are new tabs that help users access information from a single place.
    • If Location History is enabled, users can browse the places they’ve been on a daily basis with an updated Location History dashboard.
    Update to the latest version of Google Maps for Android in the Google Play store.