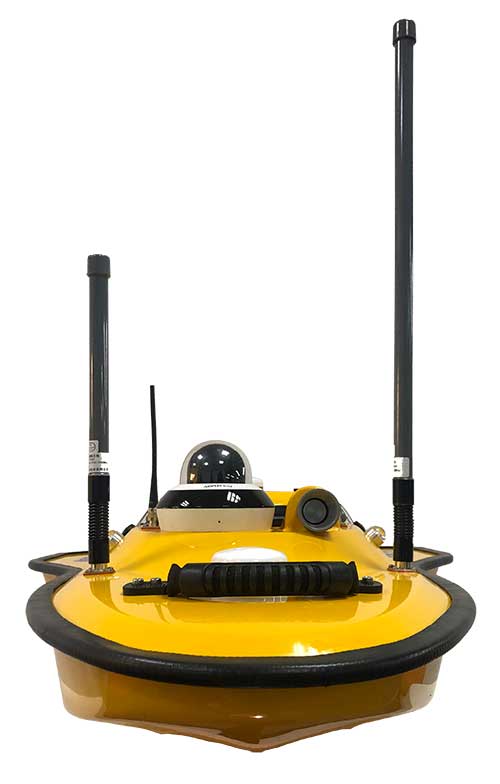
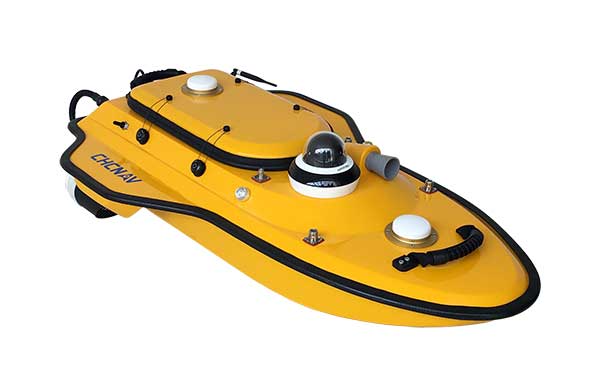
Highly cost-effective autonomous marine drone for bathymetric surveys
Photo: CHC Navigation
The new Apache3 Marine Drone — 2020 Edition provides a series of new features and additional enhancements to make lake, river and coastal hydrographic surveys more productive, according to maker CHC Navigation.
Combining a dual GNSS positioning and heading sensor, a stable and reliable hull attitude and an inertial measurement unit (IMU) sensor, the Apache3 unmanned surface vehicle (USV) allows an uninterrupted survey while passing under bridges.
Its high-efficiency 8-meters-per-second motors and absolute straight-line technology enable a fully automatic, predetermined course in adverse current conditions.
The Apache3 features include:
GNSS/INS control box to maintain high accuracy during transient GNSS outage
Integrated 4G and LAN transmission module
Sonic radar for obstacle avoidance
Automatic return to base planning
360° PTZ camera (pan, tilt, zoom)
Overspeed engines to allow operation in most water conditions
According to CHC Navigation, the Apache3 — 2020 Edition offers an exceptional feature/price ratio, making it one of the most competitive professional marine UAV solutions for single-beam bathymetric surveys.
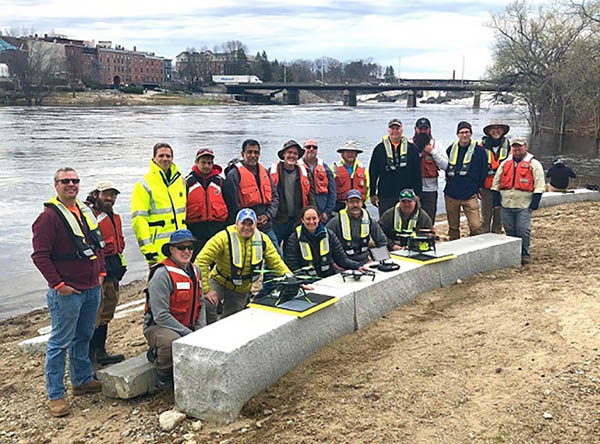
2019 Aquatic Airshow participants at Androscoggin River in Auburn, Maine, on May 1. (Photo: Mario Martin-Alciati, USGS)
The U.S. Geological Survey (USGS) and independent scientists gathered this month in Auburn, Maine, to evaluate the use of sensor-mounted unmanned aircraft systems (UAS) to gauge stream stage, velocity, bathymetry and discharge.
The technology is being evaluated and modeled to determine whether it will support the fast, accurate and safe measurement of rivers, especially when they are flooded or contain floating trees, ice or other debris.
Close to two dozen hydrologic, geospatial and scientific experts gathered in what has been dubbed the “2019 Aquatic Airshow” to assess the technology. They were led by John Fulton of the USGS Colorado Water Science Center, Jack Eggleston of the USGS Water Mission Area Hydrologic Remote Sensing Branch, and Joe Adams and Sandy Brosnahan of the USGS National UAS Project Office.
The USGS Water Mission Area works with partners to monitor, assess, research and report on a wide range of water resources and conditions, including streamflow, groundwater, water quality, water use and water availability.
The testing involved equipping drones with noncontact sensors, including ground-penetrating radar for measuring river depths, doppler velocity radar and cameras with velocimetric analysis for measuring water surface velocities and calculating mean-channel velocities; and high-resolution cameras for photogrammetric mapping of surface topography and vegetation structure.
All the evaluated sensors were equipped with GNSS receivers; some with RTK correction capability. Most of the drones used were equipped with a low-grade inertial measurement units (IMUs) for navigation.
Team members from the USGS Water Science Centers in Colorado, New England and Virginia collected ground-truth river monitoring data with acoustic doppler current profilers deployed from a boat and multiple other surveying techniques to verify the accuracy of the drone-based stream data.
Woolpert Chief Scientist Qassim Abdullah was one of two scientists from the private sector asked to participate in the airshow. Abdullah has more than 40 years of experience in analytical photogrammetry, digital remote sensing, and civil and surveying engineering.
For the event, Abdullah devised a process in which the data collected by the drones underwent Pix4D triangular adjustment to produce three-dimensional models of the water surface and river edges to assist the modeling of river velocity using the drone-based doppler velocity radar and large-scale particle image velocimetry.
USGS scientists are in the process of evaluating the data and modeling produced by this testing to conclude whether this technology will prove beneficial.
Abdullah said the airshow was a success due to the varied contributions from each member of the team, their diverse backgrounds and their shared focus on water research.
“This was a great example of how a public-private partnership can work together to activate and elevate necessary, groundbreaking technologies to address worldwide issues,” Abdullah said. “Airshow team members brought different perspectives, processes and applications to the testing, which not only proved essential for this project but will help with many others moving forward. I love working with this group and look forward to continuing to help advance these vital technologies.
The Ribble River flowing through Preston in Lancashire, United Kingdom, has hidden depths.
“The challenge with rivers is that much of the beauty and interest is hidden from view beneath the surface,” said Jack Spees, CEO of the Ribble Rivers Trust. “To reveal this beauty, we undertook a bathymetric survey of a section with particularly interesting features that is adjacent to a heavily used public footpath.”
The trust is using survey results to reveal these hidden depths on interpretation boards, including digitally augmented reality and video media enabling visitors to explore the underwater world.
For the survey, a robotically controlled 1.2-meter twin-hull shallow draft vessel powered by a twin-jet system surveyed a hectare of the riverbed. It carried depth-recording sonar and a tracking prism that enabled a Spectra Precision Focus 35 total station to lock onto and robotically follow and record the vesssel’s location.
Echo soundings were transmitted to a tablet PC ashore via long-range Bluetooth and time stamped, while the boat’s position was continuously recorded by the total station and sent back to a tablet PC, also using long-range Bluetooth and time stamped.
The tablet PC ran 4Site, a program that formatted and processed the data from the sonar and the total station into a DWG drawing. Each point was positioned in real time, so the vessel operator could ensure complete coverage. A mesh of a 200-meter section of the river with depths to 3.5 meters was combined with aerial lidar data to produce the survey.
A new high-accuracy technique using one dual-frequency GNSS receiver, precise point positioning (PPP) offers the possibility of cost-effectively obtaining coordinates. This study investigates the accuracy of kinematic PPP for hydrographic applications on rivers, and shows results comparable to double-difference solutions.
By Ashraf Abdallah and Volker Schwieger
Duisburg Harbor, Germany: site of the PPP survey.
Precise Point Positioning (PPP) is a challenging surveying technique for high-accuracy results. It offers the advantage of using one dual-frequency GNSS instrument. Estimation of a PPP solution is based on the ionosphere-free linear combination for code data and carrier-phase data.
Bernese Software. Bernese software V. 5.2 is a GNSS post-processing software, using GNSS measurement data for static and kinematic surveying. It processes the data in double-difference (differential GNSS) and zero-difference (PPP solution) techniques. The software was developed at the Astronomical Institute of the University of Bern.
Bernese software contains a group of different tools or programs to complete the processing for double-difference or zero-difference mode. The estimation of the two techniques has the same processing schedule in most of the pre-processing stages. The change appears later within the parameter estimations section.
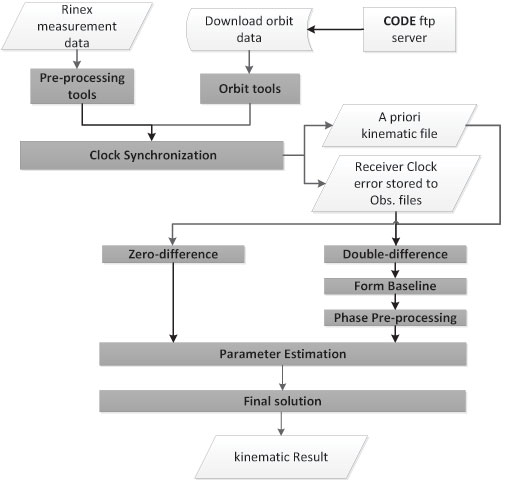
As shown in Figure 1, the processing starts with downloading the related orbits from the CODE (Center for Orbit Determination in Europe) FTP server. The orbit tools include the updating of the Earth orientation parameters to be in Bernese format, converting the satellite data to a specific format and generating the standard orbit format for Bernese software. A preprocessing program contains the smoothing of the RINEX data from outliers and cycle slips.
Figure 1. Bernese software processing schedule.
This smoothing step is following by converting the RINEX into Bernese binary format. The receiver clock is synchronized with respect to the GPS time and stored to observation files using clock synchronization tools. Using the code solution, a kinematic file is written to be inserted in the next parameter estimation procedure. For double-difference solution, a baseline is created, and this baseline is corrected from cycle slips for phase data. Parameter estimation is carried out by least-square estimation for the phase and code GNSS observations.
Kinematic PPP Solution. Bernese software provides the possibility to obtain the PPP solutions in automatic script (Bernese Protocol Engine [BPE]). The satellite orbit and clock ephemeris data from CODE center were used with intervals of 5 seconds to obtain highly accurate results. Satellite and receiver phase center offsets are considered. Tropospheric correction is applied using the Global Mapping Function (GMF) model for the hydrostatic and wet delay estimation. Regarding ionospheric correction, the estimation of the PPP solution is based on the linear ionospheric-free combination, with high-order ionospheric parameters to improve the estimation.
The ocean tidal loading correction is considered in the PPP estimation. Atmosphere tidal loading is also corrected.
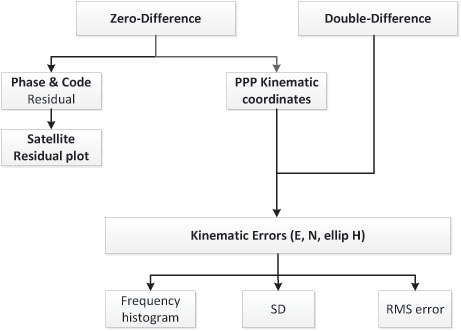
Figure 2 gives the analysis flowchart. Some outputs of the PPP solution could be visualized, such as the satellite phase and code residuals. The high residuals might come from the lower elevation angles of the satellites. Moreover, the residuals appear because of the effect of the remaining observation errors, such as atmospheric delay, multipath, or even the satellite orbit and clock residuals.
Figure 2. Flowchart of analysis strategy.
Regarding kinematic PPP solution, the error values in the east, north and ellipsoidal height are calculated with respect to the double-difference solution from Bernese software. The root-mean-square (RMS) error, which refers to the double-difference solution, and the standard deviation (SD), which is related to the mean value of the PPP solution error, are calculated, and the frequency histogram is plotted.
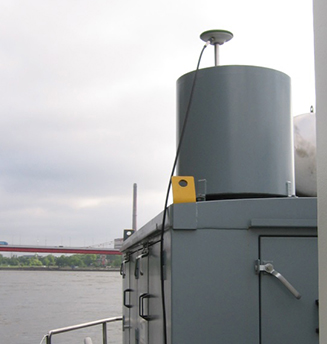
An antenna and a receiver were mounted on the surveying vessel to collect the GNSS data with an interval of 1 second during two days.
Experimental Work. Two kinematic trajectories were observed on the Rhine River in Duisburg, Germany, as a part of the project “HydrOs — Integrated Hydrographical Positioning System.” The project was launched in cooperation with Department M5 (Geodesy) of the German Federal Institute of Hydrology (BfG) and the Institute of Engineering Geodesy at the University of Stuttgart (IIGS) .
An antenna and a receiver were mounted on the surveying vessel (inset photo, opener) to collect the GNSS data with an interval of 1 second during two days. The virtual SAPOS (SAtellitenPOSitionierungsdienst der deutschen Landesvermessung) reference station was considered as a reference station, provided from the SAPOS-NRW team. SAPOS is a continuously operating reference station (CORS) GNSS service collecting data throughout Germany.
Results and Discussions
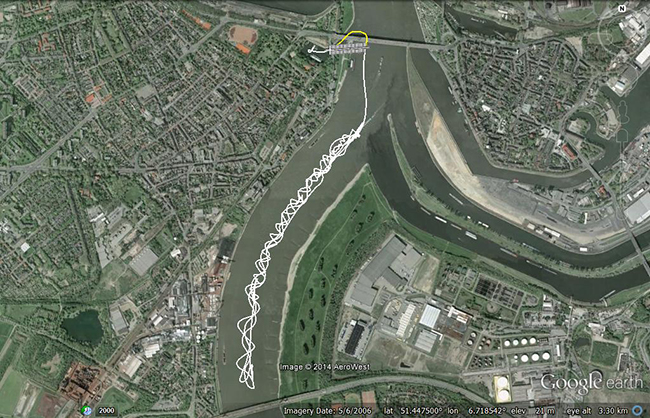
The layout of the first trajectory, which was observed for more than three hours, is presented in Figure 3. The measurements started from the inner harbour in Duisburg. The left figure shows the overview layout, and the right figure illustrates a zoom-in of the trajectory below two bridges. The white line refers to the kinematic PPP trajectory; the cross-hatched white line shows interpolated points between two solved points from the PPP solution. Because of loss of GNSS signals from the bridges, the yellow line indicates the actual vessel trajectory below bridges.
Figure 3. Layout of the first trajectory [DOY: 2014/126], zoom-in on bottom. (Photos: Google Earth)As mentioned before, the double-difference solution of the Bernese software is considered as the reference solution for the PPP solution. The PPP residuals for phase and code observations (not using double-difference solution) are presented in Figure 4. Here the residual values in phase and code have a gap because of the loss of GNSS signals, which starts from epoch 438 to 486 [GPS week second = 199845: 200115]. Additionally, there are some cycle slips from epoch 883 to 892 [GPS week second = 202105: 202150].
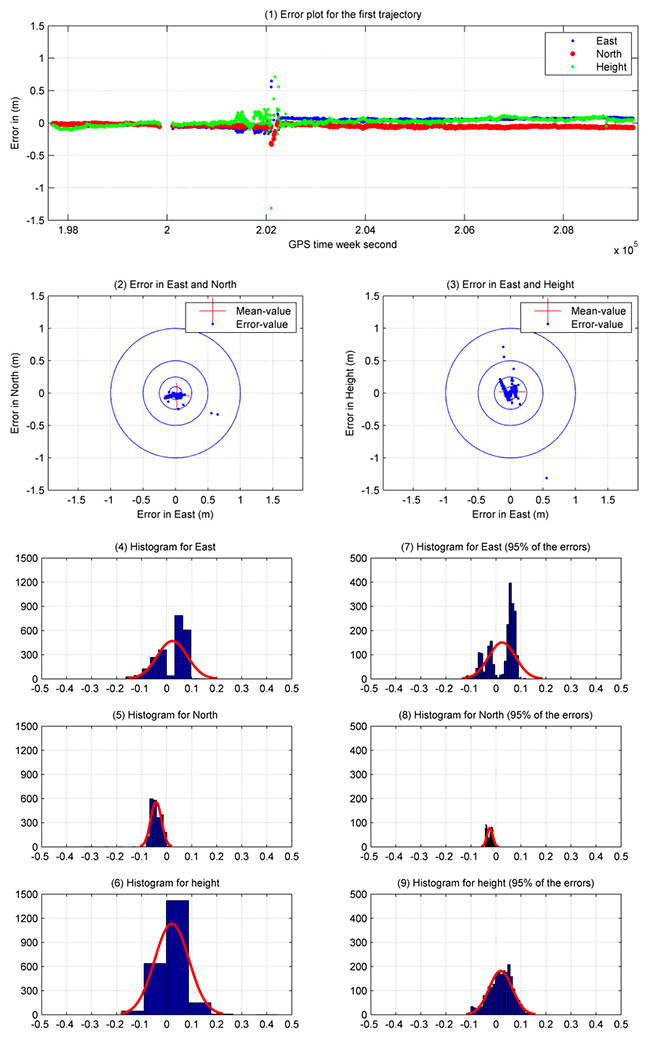
Figure 4. Satellite residuals for the first trajectory [DOY: 2014/126].To assess the accuracy of the PPP solution for this hydrographic trajectory, Figure 5 illustrates the analysis results for this trajectory between the double-difference and PPP solutions. The X-axis refers to the number of observations (one epoch/5 seconds), and the Y-axis indicates the error value in meters. Figure 5.1 shows the error plot (m) in east, north and height. As shown previously, the error values have a gap in the solution because of the loss of lock below the bridges. Moreover, there are some cycle slips later on, which decrease the estimated kinematic PPP accuracy.
Figures 5.2 and 5.3 provide the error plot for the east and north and east and height directions. The blue points refer to the errors, and the red cross refers to the mean value. Table 1 summarizes the PPP results.
Table 1. Statistical results of the first trajectory [DOY: 126/2014].Five percent of the PPP errors are eliminated to get outlier-free results. The SD (95%) of the kinematic PPP solution is obviously improved to reach 5.0 cm, 1.20 and 5.0 cm in east, north and height directions, respectively.
To distinguish between the standard deviation and the standard deviation based on 95 percent of the data, Figure 5 shows additionally the histogram of SD in Figures 5.4, 5.5 and 5.6 for east, north and height respectively. Figures 5.7, 5.8 and 5.9 provide the error with 95 percent of the results. Absolutely, the error range is improved by eliminating 5 percent of the data including outliers.
Figure 5. Analysis results for the first trajectory. Standard deviations shown in plots on the left, with outliers excluded, right.
Second Data Set. The second trajectory on the Rhine River was observed [DOY: 127] for more than 5 hours (see Figure 6). Sixteen satellites were observed during the measurement time.
Figure 6. Layout of the second trajectory [DOY: 127/2014]. (Photo: Google Earth)In Figure 7, the phase and code residuals are plotted. Some outliers are reported in this graph, which refers to cycle slips during the observations.
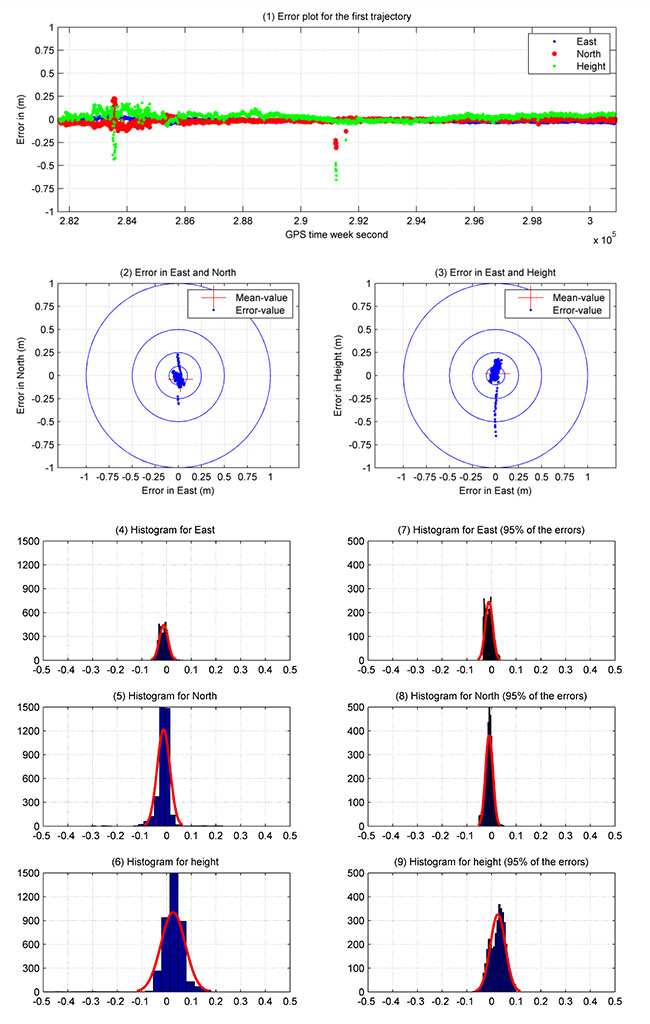
Figure 7. Satellite residuals for the second trajectory [DOY: 127/2014].Figure 8 illustrates the PPP results for this kinematic trajectory. Figure 8.1 shows the PPP error values in the east, north and height directions with respect to the double-difference solution from Bernese software.
Figure 8. Kinematic PPP solution for the second trajectory. Standard deviations shown in plots on the left, with outliers excluded, right.
The first 40 minutes of that trajectory were realized in a quasi-static observation technique (nonmoving vessel) from GPS week second 281660: 284060. The result obtained from this solution is more accurate due to the high number of satellites, and the trajectory did not include the bridges area. Figure 8.2 and 8.3 show errors in east and north, and east and height.
As shown in Table 2, the maximum and minimum values for the error range, which are presented in detail in Figure 8.4, 8.5 and 8.6, are reported in the east, north and height directions. These figures show the frequency histogram for the PPP errors. The RMS error from the solution is 2.10 cm and 2.90 cm in east and north respectively, with an RMS error of 5.60 cm in height. The standard deviation is definitely improved after eliminating 5 percent of the PPP errors as outliers. The standard deviation for 95 percent of the results shows 1.5 cm in east and north and 3 cm in height. The error histograms for 95 percent of the data are provided in Figures 8.7, 8.8 and 8.9.
Table 2. Statistical results of the second trajectory [DOY: 127/2014].The second trajectory clearly provides a higher accuracy than the first. Its data has a higher number of satellites and lower outliers than the first. Figure 8 shows the histogram of the second trajectory is similar to the Gaussian distribution curve.
Acknowledgments
The authors would like to thank Annette Scheider for receiving the GNSS measurements through the HydrOs project, our BfG partners Harry Wirth and Marc Breitenfeld, and Bernhard Galitzki form SAPOS-NRW for providing us with the reference stations.
This article is based on a peer-reviewed paper presented at the FIG Working Week, May 2015, in Sofia, Bulgaria.
Manufacturers
A Leica 1203+ antenna and GX1230+ GNSS receiver collected the data shown here.
Ashraf Abdallah is an assistant lecturer in engineering, Aswan University, Egypt, and a Ph. D. student at the Institute of Engineering Geodesy (IIGS), Stuttgart University, Germany. He received a master’s degree from Aswan University in applications of single-frequency GNSS.
Volker Schwieger is a full professor at the University of Stuttgart and director of the IIGS. He received a Ph.D. from the University of Hannover, focusing on GPS for monitoring applications.
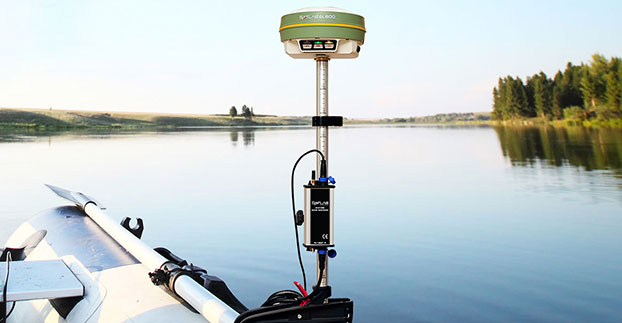
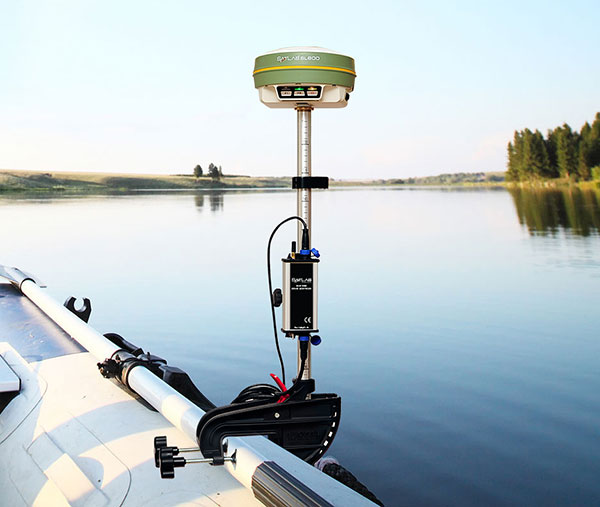
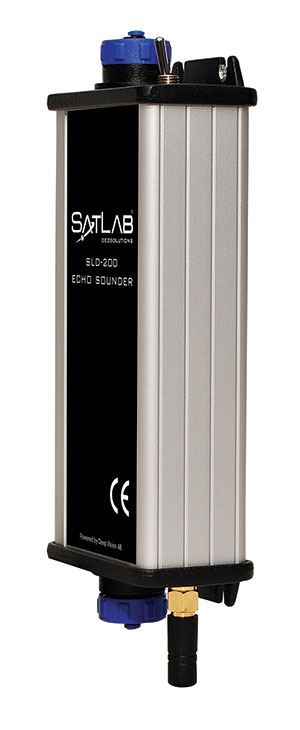
Swedish-based Survey and GIS equipment maker Satlab Geosolutions AB has announced the availability of its SLD-100 GNSS Rover accessory to facilitate Hydrographic measurement in bodies of water up to 100 meters in depth. It is designed for those who find themselves needing to survey into bodies of water, streams and rivers.
With survey-grade accuracy, the Satlab SLD-100 can be added to any brand GNSS RTK Rover to allow for position and depth measurements to be made simultaneously. With a built-in 10-hour lithium battery and transmitter unit with Bluetooth connectivity, the SLD-100 provides standard depth data streams in several industry standard NMEA formats at 1Hz, 4800 bps, providing compatibility with any hydrographic surveying software package.
“Our new SLD-100 survey receiver is extremely easy to use with position and depth information externally logged on a computer or controller,” said Birol Güçlüer”, CTO and partner of Satlab. “With the included transom mounting hardware, installation is quick and easy.”
The SLD-100 is available now for a suggested retail price of US$2995.
Geography Paints Both Rosy and Grim Picture of the World
In the late ’80s, as a graduate student at UNC Charlotte, I was learning about “New Geography” using a cutting-edge technology called GIS (Geographic Information Systems). One of our professors coined a perfect definition of what made this New Geography different from traditional cataloging of locations and attributes. Quoting Dr. Gerald Ingalls, “Old geography dealt with the simple question: What is where? New geography, using analytical tools such as GIS, is now able to answer: Why what is where.” So knowing the quantifiable “why” hopefully gives us insight into ways to shape and mitigate geography-related problems.
It’s easy to focus on the technology aspects of GIS and forget the reason for our tradecraft. I was reminded of that reason when I recently read a book that took me back to our geospatial roots and demonstrates New Geography exceptionally well. The book, The Accidental Superpower by Peter Zeihan, effectively uses geography and analytics to explain how the world has been shaped and is evolving. In his book, Mr. Zeihan links many current geopolitical events to geography, demographics and the 1944 Bretton Woods settlement which to me is one of the clearest examples of American exceptionalism.
Bretton Woods
For those of you not familiar with Bretton Woods, it was pretty much the United States telling the rest of the world how things will be after the pending end of WWII. The U.S. had turned the tide of war, built up its own industrial power while not suffering home-front damage, and had fashioned the world’s strongest Navy. You can imagine the shock of world leaders when they learned that the U.S. was not looking for reparations or even new land other than enough to bury their dead. Instead, the U.S. was going to open its markets to the world, use its Navy to protect free trade, and even help rebuild devastated countries with programs like the Marshall Plan. All has been pretty good for the past 70 years as Bretton Woods created a global holiday from instability. However, according to Mr. Zeihan, the forces of geography, demographics and new technology will unravel Bretton Woods and slowly change the world.
The Bretton Woods Conference, 1944.
Geographic Factors in the Analysis
We all learned in high school geography that severe climates such as frigid or oppressive tropical climates stifle civilizations, while more temperate climates help civilizations advance. Those are very broad generalizations, but the world is more complex than that, and Peter Zeihan has woven detailed geography into a complex picture of the world. He cites many factors that uniquely and collectively benefit the United States but are shortcomings to a greater or lesser extent in other countries. Key factors included farmable land, rivers and coastal ports for economic trade, oil, industrial capacity, education, demographics and others. In the lottery of world geography, the U.S. has been blessed. I would add that the character of its citizens also plays a key role.
Although there are critics of some of Zeihan’s conclusions and predictions, there is no doubt that his book is an exceptionally detailed compendium of countries and the geopolitical pressures that affect them. He focuses strongly on the presence of rivers, since they provide very cheap transportation of commodities thus reducing the need for many transportation infrastructure projects. The book gets into great detail about countries that most of us can’t even point to on a world map such as Kazakhstan, Turkistan, Uzbekistan and other stans. He explains why many factors bode well for Uzbekistan, but not so much for Russia and China. He shows why Russia considers keeping Ukraine in its camp absolutely vital to its own survival.
One surprise was the case he built that Alberta, Canada, may be motivated to leave its non-supportive national government to join a more like-minded and geographically connected United States. This would completely open the U.S. market for Alberta grain and oil while providing seamless transportation throughout the U.S. Additionally, as a state, the Keystone pipeline would not fall under State Department or executive review.
Demographics
Mr. Zeihan addresses the importance of demographics using a well-known example, Japan. Low birth rates and limited immigration have placed Japan into the difficult position of supporting an increasingly older population with fewer and fewer young citizens. This inverted population pyramid is a pure numbers issue that cannot be solved quickly. He shows how many European countries are trending in the same direction on a slightly later schedule. Russia is suffering from both lower birth rates and decreased education of its population. By contrast, better birth rates and better educated immigrants are preventing an inverted pyramid here in the U.S.
Technology
Mr. Zeihan highlights technology as playing an important role in raising or lowering the importance of some geographic factors. Two in particular have snuck up on the radar: fracking and 3D printing. Who would have thought that the U.S. would be on a path to becoming the world’s largest energy producer thanks to fracking? This will obviously diminish our need for Mideast oil and have a very serious effect on small unfriendly oil producers such as Venezuela, who is already seeing a drop in sales of its relatively hard-to-refine black oil. (Note the political unrest there this week as oil revenues decline.)
I wrote about the potential impact on industry of 3D printing last year, and Peter Zeihan seems to share that opinion. As manufacturing moves closer to the consumer, jobs in China will decline, as will the need of transoceanic shipment of finished goods. The result: the U.S. will see a rebirth of local manufacturing.
Rings containing superconducting magnets will confine the plasma inside the reaction chamber. (Credit: Eric Schulzinger/Lockheed Martin)
If fracking and 3D printing are going to be significant factors, imagine what will happen to the world order if the recent announcement by Lockheed Martin that its researchers have cracked compact fusion comes to fruition. This was announced too late for inclusion in Mr. Zeihan’s book, but my guess is that he would consider it to be the quintessential game changer. It would affect many geographic factors — lower the cost of all transportation, expand industry, desalinate water cheaply, make marginal land farmable, negate the limitations of oil/gas access and do all of this while reducing pollution, increasing safety and eliminating the ability to militarize this form of nuclear power.
Conclusion
I was only able to touch on a few key points in Peter Zeihan’s book. The total picture is very complex. It was clearly well researched and logically thought through. I have only two criticisms. First, Mr. Zeihan stated that he has “always loved maps,” but this book has mediocre black-and-white maps that are less than ideal to display complex geography. It screams for decent color maps, if not in print at least as supplemental website PDFs.
Second, the book delves into significant predictions that I believe should be read with a very critical eye. There are many wild cards and personalities that can steer geopolitics. As a former analyst for the geopolitical security firm Stratfor, Mr. Zeihan worked for George Friedman, the co-author of the 1991 book The Coming War with Japan. I’m glad that didn’t come true.
I know that for many of you working in the intel community this will be very basic information and analysis that is your daily bread and butter. For the rest of us, it’s a good overview and I recommend getting this book. It will be a handy reference, if for no other reason than to sound knowledgeable at water cooler debates. However, I believe that its value is more serious than that and will prove repeatedly useful as an overarching insight as history unfolds.
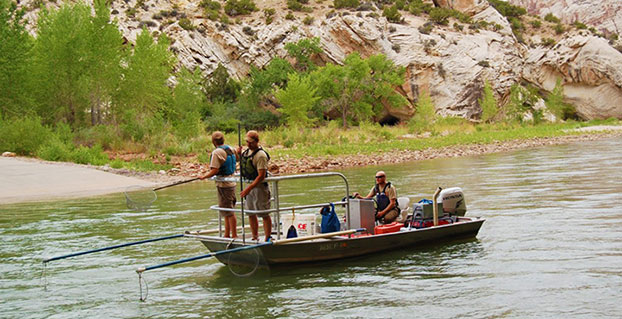
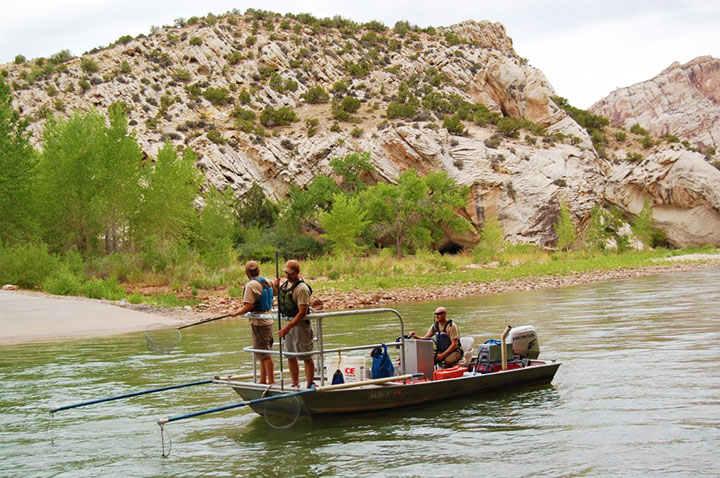
A Utah DWR field crew rides along in an electrofishing boat.
The Utah Division of Wildlife Resources (DWR) is using rugged Juniper Systems handhelds in an innovative way: to remove an invasive fish species from the Green River so that native fish can flourish.
A DWR field crew first used the Allegro MX handheld, loaded with custom fisheries software, to monitor native fish species and remove invasive fish in a 2013 project along the Green River, located near Dinosaur National Monument in Utah’s northeast corner.
The field crew’s work involved boat electrofishing, in which the researchers ride along in a boat with electrodes protruding into the water. The electrodes send out an electrical current, temporarily stunning the fish.The fish float to the surface, where they are netted and inspected.
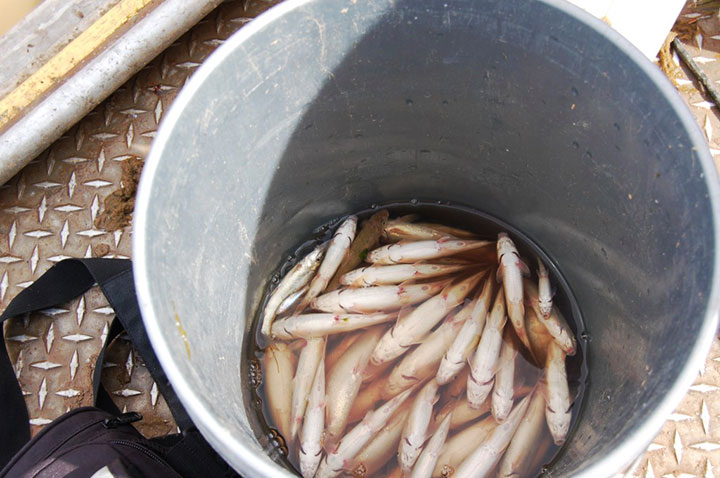
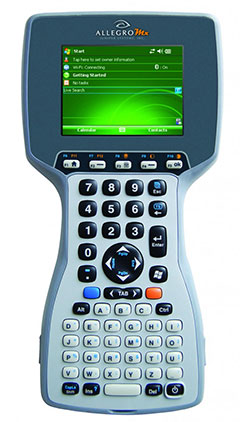
Invasive fish are collected and removed from the river. Invasive species can degrade fisheries habitats and harm the ecosystem. Right, the Allegro MX handheld.
Every five miles, the crew stopped the boat and collected data on the fish. In a single day on a 12-mile stretch of the Green River, the crew caught 2,800 fish.
When a native species was caught, the fish was given a passive integrated transponder tag. Data was collected about the fish, and then it was released. When an invasive species was netted, however, it was kept for later data collection, and then removed from the river. Invasive species — fish transplanted from another location — can outcompete native fish, degrade fisheries habitats, and harm the ecosystem.
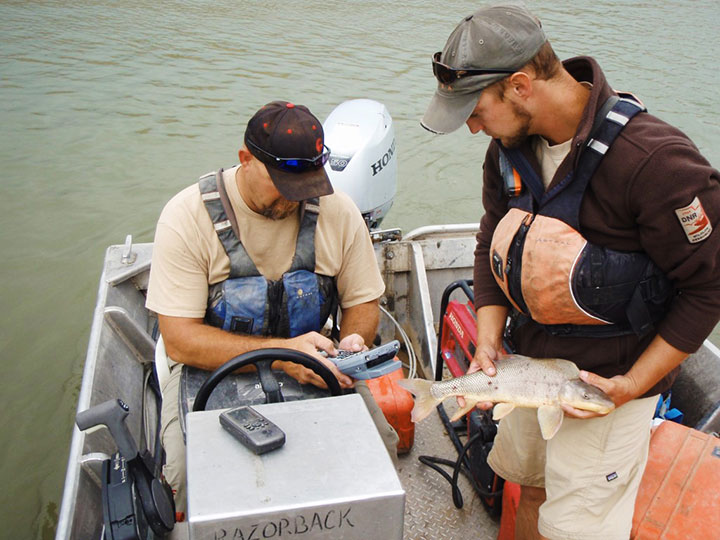
With high-value native fish, the team took a GPS point and collected data on the species, length, weight, sex, ripeness, and more, explained Juniper Systems’ natural resources market manager Trevor Brown, who accompanied a crew.
Brown explained that understanding the location of native fish helps fisheries biologists determine the effectiveness of previous removal efforts: Are native fish prospering in areas where invasive species were previously removed? Location also helps biologists associate where native fish are caught with habitat characteristics, which helps guide more targeted invasive removal efforts.
Allegro MX handheld.
Because the Green River is a a major tributary of the Colorado River, the boat crews submit their data to a central database that supports a larger effort to understand the status and health of fisheries systems of the entire Colorado River watershed. The information is used to guide management and policy decisions, fish regulations, and fisheries research.
“Location-specific data can help biologists understand population and dispersal of both native and non-native fish at a macro level,” Brown said.
The Utah DWR made the switch to the Allegro MX after seeing its benefits, including its full alpha-numeric keyboard, which allowed for rapid, accurate data entry, as well as its extreme ruggedness, sunlight-readable display, integrated GPS, and RFID compatibility.
The team even found the Allegro MX, rated IP67, could float — an additional bonus when working along a river in a shallow craft.
Brown customized the fisheries software for the Utah DWR field crews. The crews previously collected data using pen and paper, and then manually entering it into Microsoft Excel, a time-consuming and error-prone process. The custom fisheries software, available through Juniper Systems, reflects the data that needs to be collected, with required data fields and streamlined data entry. Because many of the Utah DWR crews are made up of seasonal workers, Brown designed the fisheries app to be easy to learn and use.
Biologists use the Allegro MX to collect data on the fish, including this endangered razorback sucker.
Northern Pike. Besides boat electrofishing, the fisheries software can be used for other applications, including an invasive fish removal application called fyke netting. Shaped like a bag with several hoops forming its structure, a fyke net acts as a funnel to trap swimming fish. The Utah DWR uses fyke nets primarily in the spring to trap invasive northern pike while they are spawning. After setting the fyke nets, crews return to check them and collect data on the trapped pike.
The fisheries software is also used for tributary electrofishing data collection, in which wader-clad crews walk along tributaries with electrofishing backpacks, shocking the water. As in boat electrofishing, the crews collect the invasive fish for later data collection, and they tag and collect data on native fish before releasing them.
The team experienced significant improvement with the new data collection process. “[The fisheries software] greatly reduced the data-entry time to the point where it has already paid for itself,” said Joe Skorupski, Native Aquatics Biologist at the Utah DWR. “Last year with three people, we took over 200 hours to enter, verify, and manipulate data. This year, it took one person 20 hours and errors were nonexistent due to the software and new data-collection process. I could go on and on about all the great improvements due to the handheld and the software.”
Since 2013, the Utah DWR has expanded its use of the Allegro MX and software for parallel projects, such as native fish sampling on fast-moving sections (Flaming Gorge) of the Green River, where fewer invasive fish are present.
Streamer map of the conterminous United States showing water basins, weather radar, and real-time streamflow stations.
Field & Stream called it a “…very cool tool and quite a bit of fun.” MinnPost described it as a “…high-tech illustration of Norman Maclean’s timeless view that, ‘Eventually, all things merge into one, and a river runs through it.” And Popular Science noted that, “There’s something especially satisfying about clicking a stream that…shoots its way across multiple states to empty into the ocean.”
These publications are all describing Streamer, the popular on-line mapping program from the U.S. Geological Survey. Streamer is a powerful, yet easy way to explore our major waterways. With a simple map click, anyone can trace rivers and streams from a starting point all the way downstream to where a stream drains. Even more impressive, they can click on a stream and trace all others that drain to that point. Streamer also produces a report that includes a map and information about the people and places encountered along the streams traced.
Streamer map of an upstream trace from a point on Belle Fourche River in South Dakota extending into Wyoming and Montana. Weather radar and real-time streamflow stations are shown on the map.
As good as Streamer was when it launched last summer, it just got better. Four major enhancements and dozens of small improvements have been made. These include:
A new map layer displays the locations of real-time streamflow stations across the country. Streamer updates this information hourly and symbolizes these stations to illustrate current streamflow conditions compared with each station’s observed mean streamflow on the same day of the year.
You can tell at a glance whether conditions are above, below, or at normal levels at each station.
Links are provided from Streamer directly to selected stations for additional information and data.
Another new map layer has been added that shows weather radar across all 50 States.
Useful improvements to Streamer’s detailed reports have been added. One of these lists the names of waterbodies (lakes, reservoirs, etc.) along the path of your trace.
Congressional Districts encountered along your trace have been added.
A mouse click takes you from the Streamer report to additional information from the Census Bureau about socioeconomic conditions in each District.
Searching for locations on Streamer’s map by place name, zip code, geographic coordinates and more is greatly enhanced.
In its first eight months in service, Streamer users traced more than 2.9 billion river miles.
The USGS announced in February that it is ending production of the National Atlas on September 30, and that some of its products and services would transition to The National Map. With this release, Streamer becomes the first of these National Atlas products and services that The National Map will offer. For cartographers and geospatial information professionals, Streamer’s surface water data is available for download at no cost.
Detail from a Streamer map of an upstream trace from a point on the Arkansas River near Geuda Springs, Kansas, extending into Colorado and New Mexico. Real-time streamflow stations are shown.
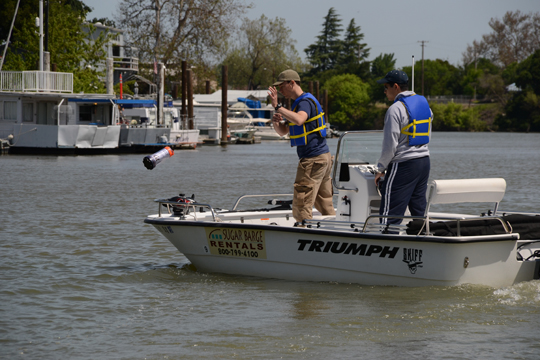
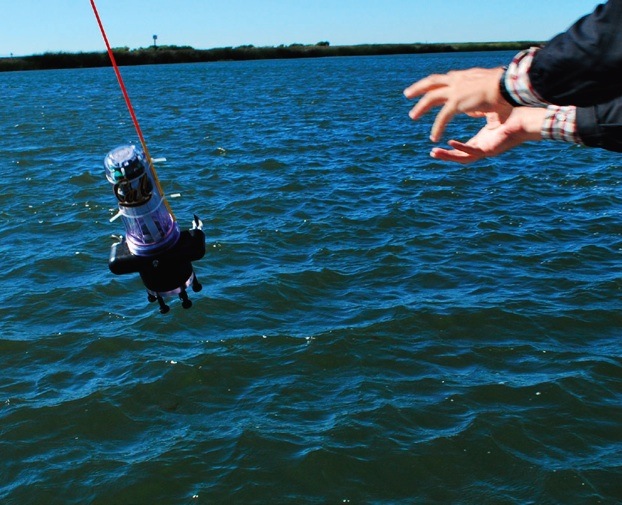
UC Berkeley researchers have developed a method to provide real-time, high-resolution data in hard-to-map waterways, using GPS. Tossing a robot is Andrew Tinka, with Kevin Weekly. (Photo courtesy of Jérôme Thai.)
By Tracy Cozzens
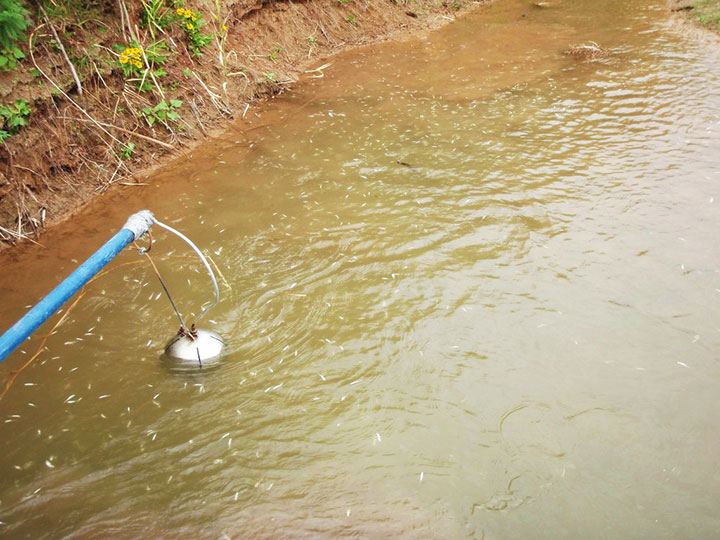
A fleet of 100 robots equipped with GPS and sensors were released May 9 into California rivers to measure water flow, salinty levels, and pollution. The Floating Sensor Network is a project by the University of California, Berkeley, to improve the way water quality and flows are monitored.
About two-thirds of California’s fresh water is in the Sacramento-San Joaquin river system where the test took place. This water supplies about two-thirds of the state’s population with drinking water and irrigation. The initiative is led by associate professor Alexandre Bayen at the Center for Informatin Technology Research in the Interest of Society (CITRIS).
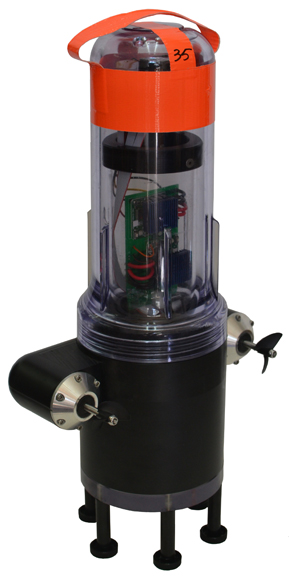
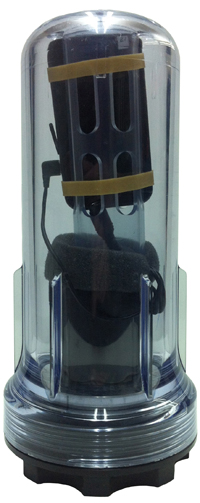
The robots each have a sensor to test salinity and a GPS unit from a smartphone. Some have propellers so they can maneuver around obstacles and reach specific destinations. The robots also sent Tweets to @fsnandroid61.
The robots drifted through the area of the river being measured, then were retrieved by boat. “One advantage of our real-time communication system is that we can see where all our sensors are on a map, which makes it very easy to chase them down and retrieve them,” said graduate student researcher Andrew Tinka.
With the first test completed, the team’s efforts over the summer have two priorities, Tinka explained. “First, we’re using the flow data that we gathered on May 9 to understand how this ‘mobile’ data can be best used for river hydrodynamics studies. We’re learning how to turn the individual traces of water that each sensor gives us into a big-picture view of the entire river region, sort of how like meteorologists take the data from a few weather stations and turn it into an overall view of what the weather is doing over a large area. Second, we’re working with other hydrodynamics research groups to expand the use of this kind of mobile sensor. We’re loaning our equipment to other groups, doing pilot projects with others, and basically trying to get these sensors into researchers’ toolboxes throughout the water community.”
There are two types of devices in the fleet, active and passive. The active sensors have a twin-propeller drive system that lets them move through the water to avoid obstacles or stay in the correct region of the river. “We developed the internal electronics for this device ourselves,” Tinka said. “We integrated a Magellan AC12 GPS receiver along with a Gumstix embedded computer and a Motorola GSM module. Our passive sensors don’t have a propulsion system; they do exactly what the water does. We developed this system with a focus on cost and ease of assembly.” The team used a waterproof consumer smartphone, the Motorola Defy, for the GPS positioning, computation, and comunications.
So far, the test has proven the usefulness of such a network. The devices were developed to be easily deployable, especially where a lot of flexibility is needed, such as in disaster response. “The ability to quickly and easily put these sensors into new inland environments, by just about any method (throw them from a boat, drop them from a helicopter, toss them from a dock or a bridge) makes them a really useful new tool,” Tinka said.
photos courtesy of Jonathan Beardphotos courtesy of Jonathan Beard
A hundred robots, 40 with propellers, were released into the Sacramento River near Walnut Grove (photos courtesy of Jonathan Beard).
UC Berkeley researchers have developed a method to learn about the quality, volume, speed, and direction of the flow of salt walter and freshwater through the Sacramento Delta. (Photo courtesy of : University of California, Berkeley.)
Swarms of robots equipped with GPS and sensors were released May 9 into California rivers to measure water flow, salinty levels, and pollution, reports OurAmazingPlanet.com. The Floating Sensor Network is intended to change the way water quality and flows are monitored in the Sacramento-San Joaquin river system.
At the University of California, Berkeley, a group of 100 robots was released into the Sacramento River near Walnut Grove. About two thirds of California’s fresh water is in the river system, supplying about two-thirds of the state’s population with drinking water and irrigation. The initiative is led by associate professor Alexandre Bayen at the Center for Informatin Technology Research in the Interest of Society (CITRIS).
The robots each have a sensor to test salinity and a GPS unit from a smartphone. Some have propellers so they can maneuver around obstacles and reach specific destinations. The robots are also sending Tweets, to @fsnandroid61.
Watch Electrical Engineering Graduate Student, Andrew Tinka, describe the project:


![Figure 3. Layout of the first trajectory [DOY: 2014/126], zoom-in on bottom. (Photo: Google Earth)](https://stage.globalpositioningnews.com/wp-content/uploads/2015/12/Figure-4-W.jpg)
![Figure 4. Satellite residuals for the first trajectory [DOY: 2014/126].](https://stage.globalpositioningnews.com/wp-content/uploads/2015/12/Figure-5-W.jpg)
![Table 1. Statistical results of the first trajectory [DOY: 126/2014].](https://stage.globalpositioningnews.com/wp-content/uploads/2015/12/Table1.jpg)
![Figure 6. Layout of the second trajectory [DOY: 127/2014]. (Photo: Google Earth)](https://stage.globalpositioningnews.com/wp-content/uploads/2015/12/Figure-7-W.jpg)
![Figure 7. Satellite residuals for the second trajectory [DOY: 127/2014].](https://stage.globalpositioningnews.com/wp-content/uploads/2015/12/Figure-8-W1.jpg)
![Table 2. Statistical results of the second trajectory [DOY: 127/2014].](https://stage.globalpositioningnews.com/wp-content/uploads/2015/12/Table2.jpg)