By Jeffrey Coffed and Joseph Rolli, Harris
The first and best step to combat the growing worldwide problem of GPS jamming is to pursue technologies that can detect and locate the jammers. Signal Sentry 1000 uses arrayed sensors to do just that: look out for jamming and track down its source once sensed.
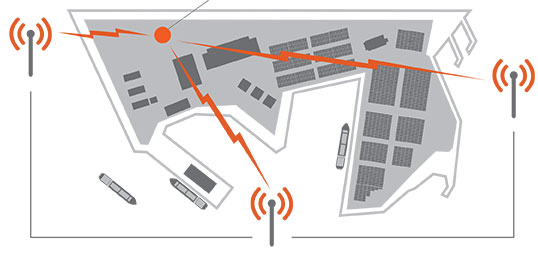
An array of sensors can be deployed for sensitive and high value entities such as infrastructure installations, including airports, railroads, chemical plants, electric power plants and grids, cargo ports, wireless communication systems and financial transfer centers. The sensors will connect to servers that assimilate the sensor data and provide operator interfaces.
Signal Sentry 1000 is based on a server/client model. The user accesses Signal Sentry using a URL and secure log-in specific to the user’s system. The user’s particular home screen displays a map with each installed sensor displayed with an icon reflecting status. Interferers are displayed as red stars or as error ellipses.
The Signal Sentry web page lists all the interferers stored in the database with their start and end times. The user can manipulate the list by changing the minimum duration of the event to be displayed as well as if the interferer had been geolocated or not, or both. If an interference event was less than a minute long, it may not have a geolocation entry.
Geolocation Methodology. Geolocation of jammers is accomplished through proprietary algorithms running at the network server that utilize digitized, timestamped I and Q samples of received interference waveforms, GPS observables, and other parameters captured by each sensor. This data is processed in a Kalman-filter based location algorithm to determine an initial jammer position and track the position of the jammer throughout the jamming event. This improves performance with moving jammers (that is, vehicle-based) and enables continued jammer location with a limited sensor set (potentially due to signal blockage, erroneous data due to multipath, or out-of-range conditions). Upon detection of an interference event by any sensor, the server polls the entire sensor network for data and determines if the information is sufficient to perform geolocation.
The user receives near-real-time status of event detections and geo-location of the interferer (if possible). Sensor data polling, geolocation processing and GUI updates continue until the interference stops or the emitter goes out of sensor range. Sensor data from each event is stored for later replay and processing using Signal Sentry event analysis tools.
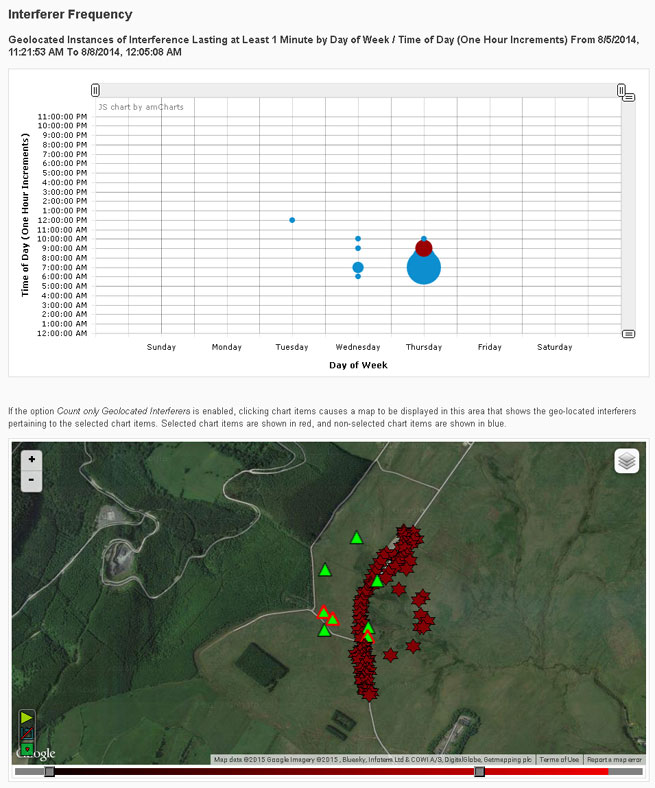
An interference event frequency chart (Figure 1) provides a tool for forensically evaluating the occurrence of interferers. It displays interference events as circles; the size of the circle represents the number of events that occurred at that day of the week and time. When dots are selected on the chart, a map below the chart shows the location of the interference events. More than one dot can be selected at a time. This allows a user to find correlations in time and space, to determine if events occur at specific locations at certain times of the day and/or days of the week.
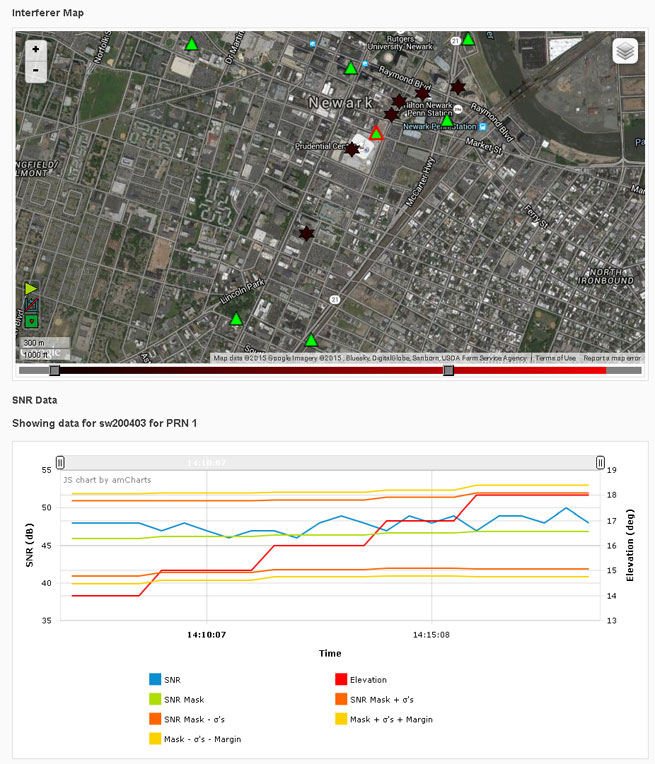
Selecting the interferer on the map and then the details button on the popup brings up the interferer details page (Figure 2). Users can sign up for interferer alerts to be sent to their email or phone by text.
Testing
Signal Sentry 1000 was deployed and tested in GPS jamming trials at Sennybridge, United Kingdom, in August 2014. Testing included stationary jammers and mobile jammers moving at up to 50 mph, in open fields and built-up areas.
Sentry Arrayed. The sensors used in these trials were custom units designed and built to Harris specifications by Chronos Technology Ltd. Each consisted of an embedded GPS receiver, an interference signal receiver and a local processor with a network communications interface.
An array of eight sensors was geographically distributed around the test facility. Each sensor and a centralized Signal Sentry processing server were equipped with a mesh data networking capable radio for wireless data communications of commands, status and event data. In other Signal Sentry deployments, the server software is typically hosted on a cloud server, and sensors communicate with the server either via hard-wired internet connections or wirelessly through cellphone network-compatible data adapters.
Jammer Profile. Two jammers performed during the trials, a 150mW and a .5W jammer, used to disrupt the GPS L1 C/A code at 1575.42 MHz.
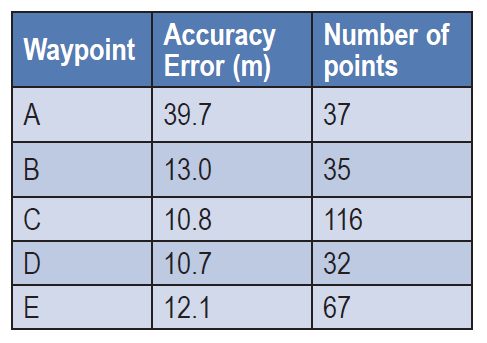
Open Field. Atest in an area with no obstructions included static jammers and dynamic jammers. Five waypoints along the road, in an area measuring 320 by 444 meters, were surveyed prior to the test using a handheld GPS receiver, to evaluate location accuracy.
Table 1 shows static test results. The accuracy error is the average delta between the Signal Sentry-reported jammer positions versus the actual surveyed jammer positions. The number of points column contains the number of measurements reported by Signal Sentry during the test scenario for each waypoint. The overall average accuracy error for the static jammer test was 17.25 meters.
Open Field, Mobile Jammer. In these tests, the jammer was driven in a car on the road through the sensor field. The car was driven at 25 mph north to south, then 50 mph south to north (Figure 3). Cars in the north parking lot caused multipath errors when the jammer came in contact with that area.The overall average accuracy error for the dynamic tracking was 10 meters.
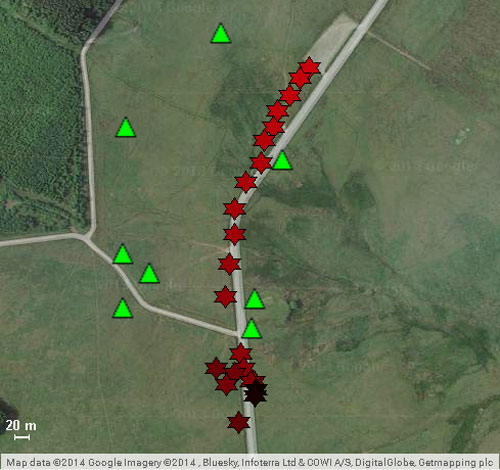
Signal Sentry, when jammer was driven at
50 miles per hour, north to south. Green
triangles denote sensor locations.
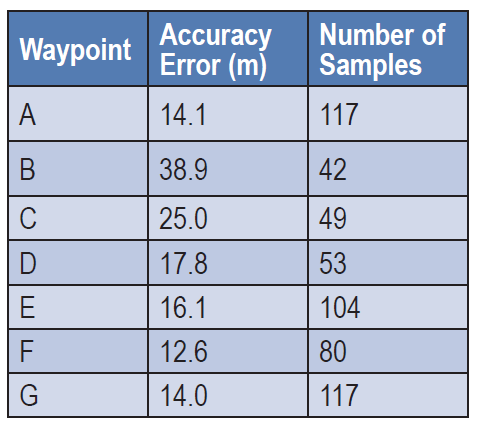
Obstructed Area Test. This test evaluated performance in an urban environment called a FIBUA (Fighting in Built-up Areas), using stationary and dynamic jammers. Seven waypoints in an area 176m x 253m were surveyed for the purpose of evaluating location accuracy. Table 2 shows the results with the 150mW jammer held stationary at the waypoints. Figure 4 provides a graphical view of the jammer position in relation to the waypoints. The overall average accuracy error is 21.40 meters.
Obstructed Area, Mobile Jammer. In these tests, the jammer was driven in a car at approximately 20 mph on the road through the sensor field, using a .5W jammer. The overall average accuracy error for this dynamic tracking was 50 meters.
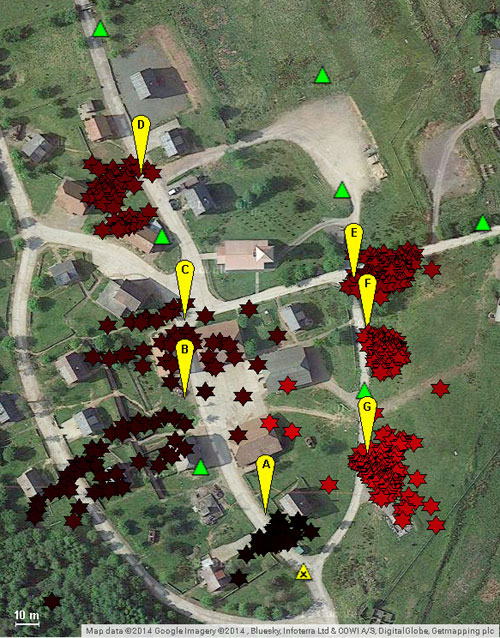
in yellow, locations delivered by Signal
Sentry in red, sensor locations in green.
All figures provided by Jeffrey Coffed and Joseph Rolli.