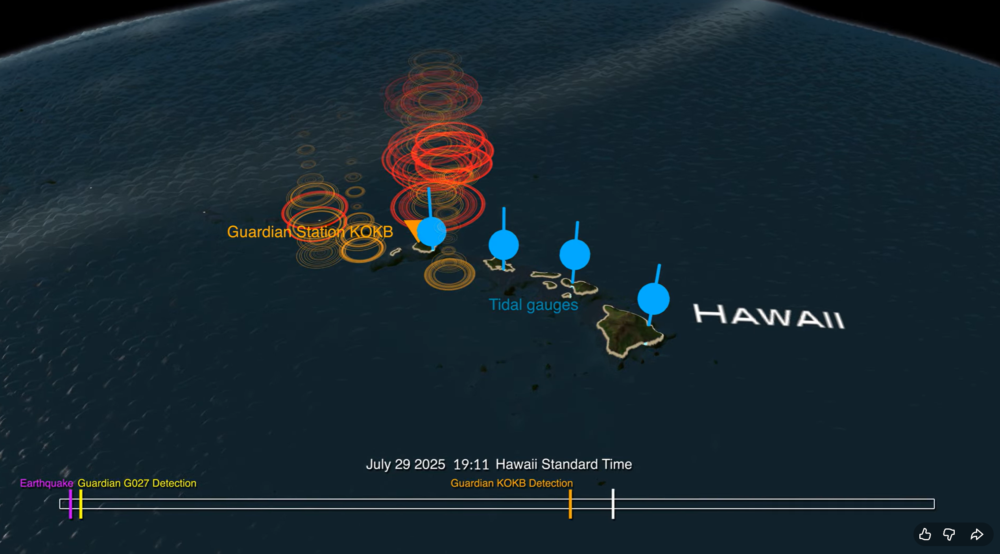
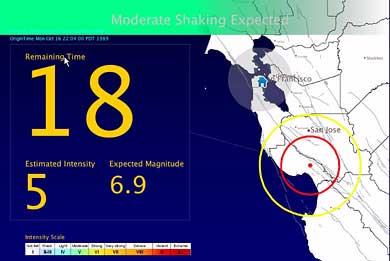
A new data visualization illustrates how an experimental NASA technology can provide extra lead time to communities in the path of a tsunami. Called GUARDIAN (GNSS Upper Atmospheric Real-time Disaster Information and Alert Network), the software detects slight distortions in satellite navigation signals to spot hazards on the move.
The animation breaks down a real-life case study: 2025’s massive Kamchatka earthquake and the tsunami that it sent racing across the Pacific and towards Hawaii at more than 500 mph (805 kph).
The visualization shows the magnitude 8.8 earthquake (seen in purple) strike off the Russian coast on July 29, 2025, triggering the tsunami. The red, orange, yellow, and green ringlets represent real-time readings from ground stations tracking GPS and other navigational satellite signals. The disturbances were spotted by GUARDIAN’s artificial intelligence-powered detection algorithms as soon as eight minutes after the earthquake.
For the next several hours, signs of the tsunami were picked up by GUARDIAN across the Pacific Ocean in near real time. The system flagged an incoming wave off the coast of Kauai some 32 minutes before it made landfall and was detected by tide gauges (shown in blue).
The results highlight GUARDIAN’s potential to augment existing early warning systems, said Camille Martire, one of its developers at NASA’s Jet Propulsion Laboratory in Southern California.
Currently, determining whether an earthquake generated a tsunami remains a challenge. Forecasters rely on seismic data and computer simulations to make their best prediction, then wait for pressure sensors attached to the ocean floor to confirm a passing wave. Those sensors work well but are expensive and thinly dispersed. Gaps in coverage remain. And in those gaps, warning time disappears.
The GUARDIAN approach is complementary and cost effective because it monitors existing data from GPS and other constellations that make up the Global Navigation Satellite System. It’s also free to access, though for now best suited to analysts trained to interpret its findings.
How GUARDIAN works
All day, every day, geopositioning constellations transmit radio signals to ground stations around the globe. On the ground, the data is refined to sub-decimeter (less than 10 centimeters) positioning accuracy by JPL’s Global Differential GPS System. Before the signals get there, however, they must travel through an electrically charged skin of plasma called the ionosphere.
Solar storms and other space weather can wreak electrical mayhem in the ionosphere, and so can events on Earth. Tsunamis and earthquakes, by displacing large amount of air at Earth’s surface, unleash pressure waves that can slightly perturb the radio signals coming down from satellites. While systems are in place to correct for this “noise,” GUARDIAN considers it a useful signal.
Currently, GUARDIAN scours data from more than 350 GNSS ground stations around the Pacific Ring of Fire, a hotbed for the ocean’s deadliest waves. And the system is not confined to tsunamis. Earthquakes, volcanic eruptions, missile tests, spacecraft reentries, meteoroid splashdowns — anything that produces a large rumble on Earth is potentially fair game. While the Kamchatka event didn’t cause widespread damage to people or property, it showed how the next time disaster strikes, NASA science could give communities a few more minutes to act.
GUARDIAN is being developed at JPL by the GDGPS project, which is partially supported by NASA’s Space Geodesy Project.
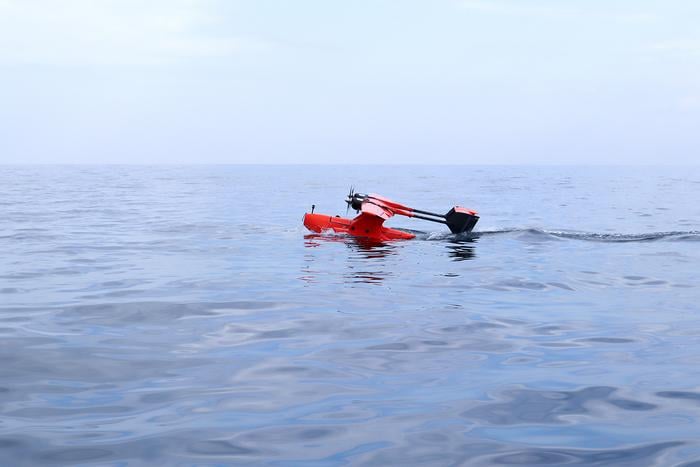
Researchers demonstrate a seaplane-type UAV using GNSS-A can precisely measure seafloor deformation
Megathrust earthquakes are large earthquakes that occur on faults found along the boundaries between tectonic plates. The Nankai Trough is a megathrust earthquake zone lying off the southwestern coast of Japan, and experts estimate that this zone could generate a potentially devastating (magnitude 8 or 9) large earthquake sometime in the next 30 years. A seismic event of this magnitude could trigger cascading hazards such as destructive tsunamis.
Developing the technologies for efficient and reliable seafloor monitoring is paramount when considering the potential for socioeconomic harm represented by megathrust earthquakes. Traditionally, seafloor measurements have been obtained using transponder stations on the seafloor that communicate with satellites via buoys or ocean-going vessels to produce accurate positional information. However, data collection using such systems has problems such as low efficiency and speed.
In a study published in Earth and Space Science, researchers at Institute of Industrial Science, the University of Tokyo, addressed the challenge of acquiring reliable, high-precision, real-time seafloor measurements by constructing a seaplane-type unmanned aerial vehicle (UAV) that can withstand ocean currents and wind. This vehicle is intended for use with the GNSS–Acoustic (GNSS-A) ― a system that uses satellites to determine locations on Earth ― to provide a communication link with seafloor transponder stations.
“We conducted initial experiments in a water tank,” explains lead author of the study Yuto Yoshizumi, “and found that the proposed system can detect distances to an accuracy within 2.1 cm.”
To further evaluate the system, at-sea trial tests were performed by landing the UAV on the sea surface off the coast of Japan under optimal sea conditions. “The results were hugely encouraging,” said senior author Yusuke Yokota. “These seafloor positioning measurements are the first ever achieved using a UAV, and we attained a horizontal root mean square error of approximately 1–2 cm, which is easily comparable to that of existing vessel-based systems.”
The rapid real-time acquisition of seafloor information using the UAV system developed by the research team at Institute of Industrial Science, the University of Tokyo, is expected to provide the foundation for advanced research into earthquake disaster prevention. Such data are urgently needed given the speed and frequency of occurrence of megathrust earthquakes on the Nankai Trough.
Using data from GPS receivers and seismographs, three seismologists may have found a way to identify tsunami earthquakes in time to warn people
A few times a century, a medium-sized earthquake causes a large and devastating tsunami. The most recent occurrence was in 2010, when a magnitude 7.8 earthquake off the Mentawai Islands in Indonesia set off a tsunami that was more than 50 feet high in some places, killing 509 people and displacing 15,000.
While rare, these tsunami earthquakes are particularly dangerous because they can hit coastal communities within five to 15 minutes, before officials can issue a warning. Now, however, using data from GPS receivers and seismographs near the 2010 Mentawai event, three seismologists — Valerie Sahakian and Diego Melgar at the University of Oregon and Muzli Muzli at the Earth Observatory of Singapore — may have found a way to identify tsunami earthquakes in time to warn people.
Very large earthquakes under an ocean break both the deeper part of a subduction zone, where one tectonic plate is sinking beneath another, as well as its shallow part, in a rapid motion that creates a tsunami. Tsunami earthquakes, on the other hand, happen almost entirely in the soft, weak section of a fault, moving slower and creating much more movement on or near the sea floor compared to earthquakes of the same size that happen in rigid rock. This creates much larger tsunamis than expected. A tsunami earthquake might have the same magnitude as an earthquake that occurs in rigid rock but produces much less of what seismologists call high-frequency energy.
Currently, officials issue tsunami warnings within tens of minutes of detecting an earthquake above a certain magnitude within a certain distance of a coastal area. This method, however, fails in the case of tsunami earthquakes, which produce tsunamis that are disproportionate to their magnitude.
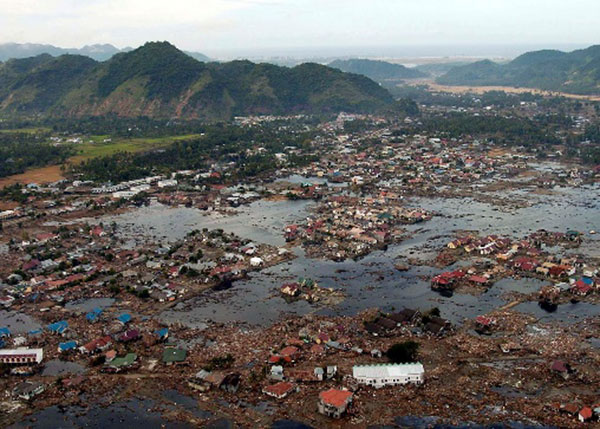
Indian Ocean (Jan. 2, 2005): A village near the coast of Sumatra lays in ruin after a tsunami struck South East Asia. (Photo: U.S. Navy/Photographer’s Mate 2nd Class Philip A. McDaniel)
Traditionally, scientists have detected tsunami earthquakes by comparing their seismic magnitude with the amount of high-frequency energy they radiate, both recorded by distant stations. Tsunami earthquakes have a very low ratio of energy to magnitude; their energy, instead of strong shaking, produces a large slow movement of the seafloor.
In the past, scientists had to measure this ratio using seismic waves that had traveled from the earthquake’s epicenter to seismographs hundreds or thousands of miles away. This did not give them enough time to identify tsunami earthquakes and warn people before the tsunami’s wave hit the coast.
The recent analysis, however, enabled scientists to figure out a faster way to identify these rare tsunami earthquakes by using two proxies:
data from seismic stations onshore near the epicenters of 16 earthquakes that measured directly how much the ground shook in each case, to determine the amount of high frequency energy in each earthquake, and
data from GPS stations close to the earthquakes, to measure the magnitude of each one on the basis of how much it moved the ground.
The GPS stations used in this study were from the Badan Informasi Geospasial (BIG) network from Indonesia. The data were acquired in real-time but processed with final orbits and clocks using precise point positioning (PPP). The scientists averaged the 3-component displacement, using centimeter-level solutions, and saw 3-10 centimeter vertical displacement.
This methodology, using data available during and immediately after an earthquake, enables scientists to compare the amount of energy in each earthquake with its magnitude, without waiting for their seismic waves to travel to distant measuring stations. Seismologists will be able to use this approach to identify tsunami earthquakes immediately and warn nearby coastal communities before a tsunami wave reaches them.
Citation. Sahakian, V. J., Melgar, D., & Muzli, M. (2019). “Weak near-field behavior of a tsunami earthquake: Toward real-time identification for local warning.” Geophysical Research Letters, 46(16), 9519–9528.
No, this is not a drill or a major motion picture event.
During my lifetime, many natural disasters that have taken place around the globe. These unfortunate events have created mass destruction and caused many deaths by a variety of environmental elements, ranging from earthquakes and volcanic eruptions to hurricanes and snowstorms.
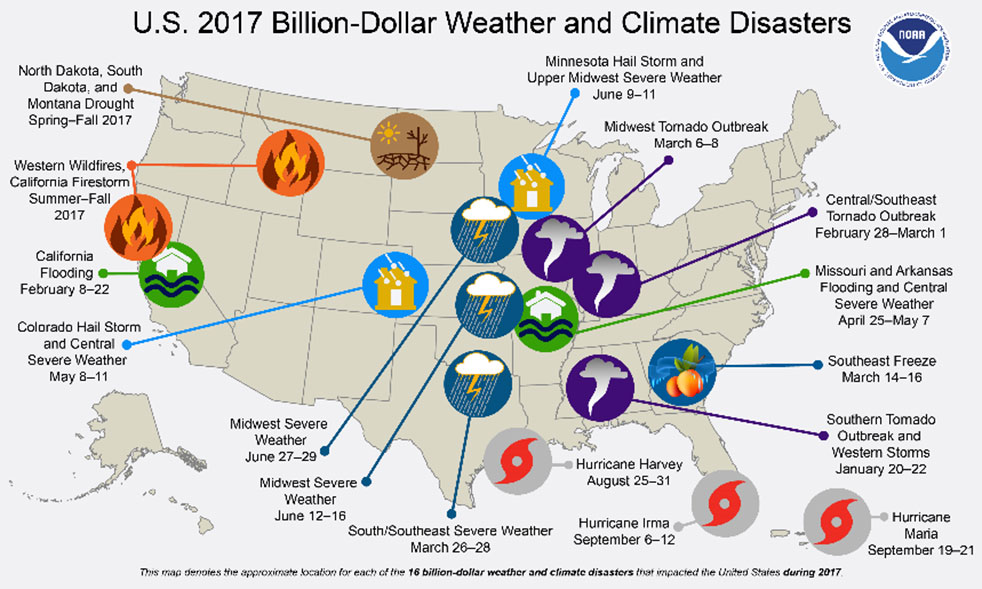
Disasters in the United States. (Image: FEMA)
Once Mother Nature decides to unleash her wrath, rarely anything stands in her way. Some types of disasters create situations worse than others, but all have a reputation of leaving a trail of death and destruction.
Search and rescue is the first and foremost priority when it comes to these disasters, with cleanup and rebuilding to soon follow.
The role of the land surveyor, however, doesn’t usually enter the discussion when it comes to these situations. It has always been considered an occupation that fills an important role in development, construction and parcel ownership, but rarely is discussed in the same terms as a fireman, policeman or doctor.
We will take a closer examination at how the surveyor uses skills developed through education, technical training and practical application of geographical data to quietly assist those in need through these difficult bouts with Mother Nature.
First, however, we will discuss various types of the deadliest natural disasters, the amount of destruction that has been caused and types of problems (besides deaths) that were left because of these tragedies.
Disasters throughout history
When describing natural disasters, the obvious ones come to mind: earthquake, hurricane/typhoon/cyclone, tornado, wildfire, flooding/monsoon, drought/famine, volcanic eruption, tsunami, sandstorm, avalanche, and snowstorm.
All of these have wreaked havoc on mankind for centuries, with more physical destruction taking place in the past few centuries.
Some of the factors leading to an increase in this devastation are gains overall population and amount of buildings and improvements in populated areas. Let’s look at how each disaster impacts the areas in which it occurs:
Flooding/Monsoon
Historically the deadliest type of natural disaster, rainfall through storms and monsoons cause flood events that have caused millions of deaths in several instances around the world. Most of the deaths caused by flooding situations are due to drowning in floodwaters that inundate areas not normally affected by normal amounts of rain.
The largest flood in recorded history took place in China during 1931, combining melting snow and ice with ongoing rain events to create a continuous flooding event that lasted most of the year. Death toll estimates range from 400,000 to almost 4 million, as many of the victims either died or moved to other regions with no trace.
Hurricane/Typhoon/Cyclone
This is another type of flooding disaster, but it combines large amounts of rain gathered from ocean storms with high winds to batter shoreline and inland areas. These storms can often stall in place, causing significant damage by both wind and rain.
Tornado
Most weather systems associated with creating tornadoes are believed to occur in the United States, but they happen all over the world. Many of the deadliest tornadoes have taken place in the Middle East, including Bangladesh, Russia and Pakistan. These storms can include torrential rain, but most of the damage caused by tornadoes is wind-related.
Earthquake
Shifting tectonic plates and earth-shaking tremors are a significant cause of damage and deaths throughout the world. Most of the highest death tolls have taken place in Asia, with the biggest loss of life occurring in Shaanxi, China, on Jan. 23, 1556, with more than 830,000 deaths.
Indian Ocean (Jan. 2, 2005): A village near the coast of Sumatra lays in ruin after the Tsunami that struck South East Asia. (Photo: U.S. Navy/Photographer’s Mate 2nd Class Philip A. McDaniel)
Tsunami
Often a secondary disaster generally associated with earthquakes in coastal areas, tsunamis kill thousands by inundating shorelines with huge waves and sending vast amounts of water into low-lying areas and poorly constructed seaside villages. The largest tsunami in recent memory was on Dec. 26, 2004, in the Indian Ocean off the coast of Indonesia, with the death toll reaching 280,000 people.
Volcano
The biggest cause of earthquakes is typically molten lava expanding to shift tectonic plates, but volcanoes are formed with the lava and associated gases finding an escape in the Earth’s crust.
Once a volcano has formed, an eruption can lead to significant damage from lava flow onto adjacent land and hot ash spewed into the atmosphere. Many volcanic eruptions throughout history have buried local cities and villages, making them virtually disappear.
Wildfire
Grabbing the headlines more recently has been the proliferation of wildfires. While not causing the substantial loss-of-life associated with many other natural disasters, wildfires are responsible for scorching hundreds of thousands of acres of forest and brush areas, as well as decimating neighborhoods.
Avalanche
This disaster only takes place in locations with significant snow pack and elevation changes. After large amounts of snowfall, various factors lead to movement of large areas of snow and ice down mountainous slopes. Often these events take place near cities and villages in mountainous regions and can leave the inhabitants buried and unreachable.
Other Types of Natural Disasters
While the varieties of events listed above can create large-scale destruction, there are others that, while smaller in nature, can collectively cause great damage and loss of life. Thunderstorms, snowstorms and sandstorms are wind-related and can be devastating to the areas being affected.
Other natural disasters that often don’t get the same recognition as those listed above include drought and famine. These environmental tragedies ruin thousands of lives, and it take years to recover from the damage caused by these inflictions.
Disaster hits. Now what?
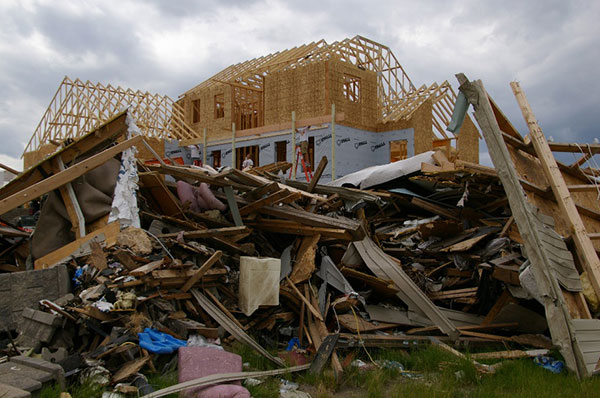
June 28, 2008: A house in Parkersburg, Iowa, is being rebuilt while debris from a deadly EF5 tornado still covers the ground. (Photo: FEMA/Richard O’Reilly)
All of these disaster types have led to a great number of fatalities and total devastation of cities and roadways. To help us understand what type of assistance the surveyor can provide, we first need to identify the conditions left by each of these events.
Most of the disasters simply wipe out whatever is in its path; from tornadoes, hurricanes, and wildfires to earthquakes, avalanches and tsunamis, the regions affected are left in shambles after the occurrence.
The initial search and rescue through the rubble takes manpower and careful identification of areas where people are known to inhabit, either as residences, places of employment or public spaces. These areas require retracement of existing mapping and atlases to accurately identify those places for timely recovery.
Once the search-and-rescue efforts have ceased and cleanup/rebuilding commences, the destroyed areas will need to be remapped based upon existing parcels and ownership rights. Reconciliation of existing parcels, subdivisions and rights-of-way will be required to properly return the injured areas to a habitable state.
The one disaster that’s a big wildcard, however, is the earthquake. The devastation is like the others and generally will need rebuilding like the others, but with one large difference; putting everything back where it belongs.
When large tremors cause significant shifts in inhabited and/or complex parcels, the ability to retrace existing parcels, subdivisions and rights-of-way to place them in their original location becomes a nightmare.
How surveyors and GNSS help before and after disasters
As expert measurers and establishers of boundaries, the surveyor provides guidance for the creation of parcels and rights-of-way. Through extensive education, training and experience, the surveyor combines field reconnaissance, legal definitions of parcels and high-level mathematics to provide direction for the creation and retracement of real property.
After experiencing a devastating event like the ones described above, the surveyor becomes a key position in rebuilding the affected area.
Prior to the invention and proliferation of GNSS technology, however, the use of state plane coordinate data was a tedious and time-consuming task (see my January 2017 article at GPS World).
Establishing coordinate values across a large region and/or utility system was not practical from a time or cost viewpoint. The arrival of GNSS technology in the 1990s changed that situation with the ability to determine coordinate values in real-time and create large databases of infrastructure and utility information. Government agencies (and surveyors) now could replicate, with acceptable accuracy and precision, locations of improvements and utilities throughout their jurisdiction.
Surveyors are now being called upon to assist with search and rescue efforts when these disasters hit to help locate and turn off existing utilities (i.e. electricity, gas, water), and to provide mapping assistance for retracing where people may be in the rubble. Because lives are at stake, timely location is essential for these services and GNSS technology use by the surveyor provides a much-needed service.
Once these disaster events being a rebuilding mode, the surveyor steps in to find the existing parcel and right-of-way lines to assist the respective owners where a deed or roadway was previously located. Most times, the surveyor can retrace existing line by locating buried monuments and recreating existing deed descriptions and/or roadway locations.
Where there becomes a problem is when the devastation is large enough to destroy all existing monuments and leave no trace of any occupied land. The surveyor must expand the search area, as far as needed, to find the closest available monuments in which to begin rebuilding the parcel descriptions.
Depending on the site conditions, GNSS equipment is used to locate the positions of the nearest monuments so the surveyor can perform retracement calculations for the disturbed area.
Once the area to be re-established to calculated, the surveyor can return to the site and place markers signifying parcels and rights-of-way for the rebuilding of roads, utilities and buildings. GNSS receivers are again utilized to increase the proficiency of the field crew by allowing the installation of the markers over a large area in a short amount of time.
How surveyors can prepare for future events
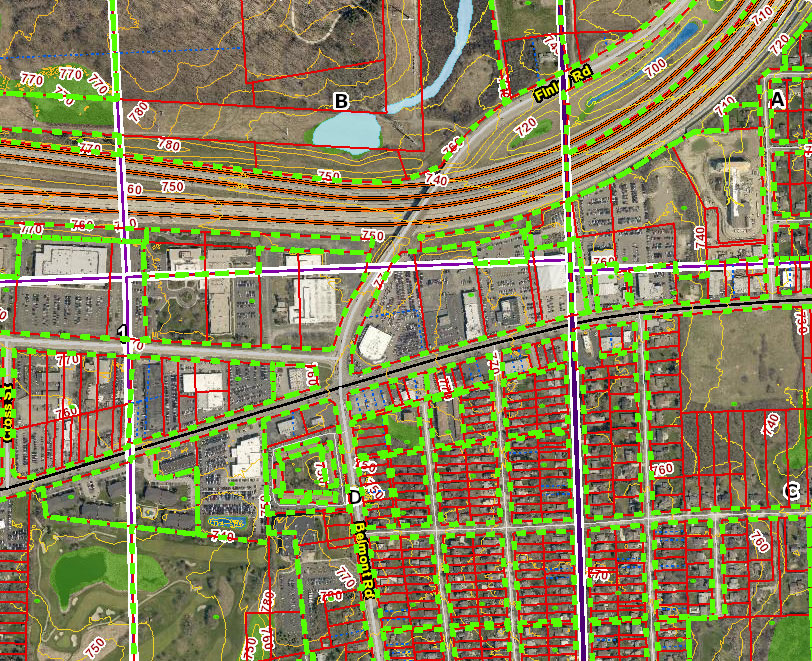
Image: DuPage County, Illinois, GIS
As previously written in my January 2017 column, GNSS technology has helped expand geographic information systems (GIS) into a database beast, containing everything from voter districts, zoning regions and floodplain maps to locations of most municipal utility maps and databases.
When these databases have included a geodetic layer of survey information overseen by the licensed land surveyor, the GIS is now more than a glorified digital Etch-A-Sketch. These entities within the database have geolocation as part of its dataset, with varying accuracy depending on the source of the data.
By having all this information available in a digital format, typically saved in a cloud-computing location, the ability to replicate these entities becomes a simple exercise. As more information becomes available, it needs to be included into the database for future mapping consideration.
All relevant data, together with a geolocation tag, becomes valuable for future retracement. This information could be used to locate possible survivors during a disaster event.
Upcoming technology to assist surveyors with disaster relief planning
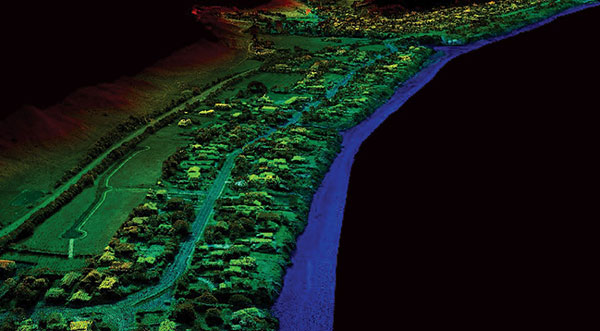
Image: Esri
Many of the tools being utilized by surveyors have the capability of helping with mapping and data collection of municipal and public facilities for GIS database inclusion.
We currently use laser and lidar scanners both terrestrially and aerially to collect point-cloud data for establishing existing conditions of various sites. This point cloud, along with high-resolution photography, can be used to augment and enhance new and existing GIS databases with extensive datasets.
By having this additional information collected and available digitally, qualified experts can perform disaster simulation tests to depict various environmental events and determine what strategies will be necessary for search-and-rescue efforts.
These experts can also use this data to predict potential flood paths, conduct seismic modeling to determine building shift, and combine weather conditions with conceivable wildfire-capable areas. All these potential life-saving exercises can utilize the surveyor as a significant data-collection source.
Coming to a theater near you…
Whether one believes in climate change or just being affected by an active environmental cycle of natural disasters, the entire world is prone to have an occurrence of at least one of these events.
Since these events are not going away, remember to help your fellow man, woman or child in their time of need. It is the duty of the surveyor to provide a service that is intended to protect the public, and being there for disaster planning, prevention and recovery is part of our mission.
Think of us like the Avengers; now there’s a sequel I’d pay to see.
Researchers testing a satellite-based earthquake early warning system developed for the U.S. West Coast found that the system performed well in a “replay” of three large earthquakes that occurred in Chile between 2010 and 2015, reports the Seismological Society of America.
The results, reported in the journal Seismological Research Letters (SRL), suggest that such a system could provide early warnings of ground shaking and tsunamis for Chile’s coastal communities in the future.
The early warning module, called G-FAST, uses ground motion data measured by GNSS to estimate the magnitude and epicenter for large earthquakes — those magnitude 8 and greater. These great quakes often take place at subducting tectonic plate boundaries, where one plate thrusts beneath another plate, as is the case off the coast of Chile and the U.S. Pacific Northwest.
Using data collected by Chile’s more than 150 GNSS stations, Brendan Crowell of the University of Washington and his colleagues tested G-FAST’s performance against three large megathrust earthquakes in the country: the 2010 magnitude 8.8 Maule, the 2014 magnitude 8.2 Iquique, and the 2015 magnitude 8.3 Illapel earthquakes.
G-FAST was able to provide magnitude estimates between 40 to 60 seconds after the origin time of all three quakes, providing magnitude estimates that were within 0.3 units of the known magnitudes. The system also provided estimates of the epicenter and fault slip for each earthquake that agreed with the actual measurements, and were available 60 to 90 seconds after each earthquake’s origin time.
“We were surprised at how fast G-FAST was able to converge to the correct answers and how accurately we were able to characterize all three earthquakes,” Crowell said.
Most earthquake early warning systems measure properties of seismic waves to quickly characterize an earthquake. These systems often cannot collect enough information to determine how a large earthquake will grow and as a result may underestimate the earthquake magnitude—a problem that can be avoided with satellite-based systems such as G-FAST.
It’s difficult to test these types of early warning systems, Crowell noted, because magnitude 8+ earthquakes are relatively rare. “We decided to look at the Chilean earthquakes because they included several greater than magnitude 8 earthquakes, recorded with an excellent and consistent GNSS network. In doing so, we would be able to better categorize the strengths and weaknesses in G-FAST.”
ShakeAlert
The Chilean tests will play a part in furthering developing G-FAST for use in the U.S., where Crowell and colleagues have been working to include it in the prototype earthquake early warning system called ShakeAlert, now operating in California, Oregon and Washington. The Chilean earthquakes, Crowell said, represent about half of magnitude 8 events in the recorded catalog of earthquakes that are used to test G-FAST and other geodetic algorithms for inclusion in ShakeAlert.
Ten magnitude 8 or greater earthquakes have occurred along the Chilean coast in the past 100 years, including the 1960 magnitude 9.5 Valdivia earthquake, which is the largest earthquake recorded by instruments. “The hazard due to these large events is well recognized and understood,” in Chile, wrote Sergio Eduardo Barrientos of the Universidad de Chile, in a second paper published this week in SRL. “Return periods for magnitude 8 and above events are of the order of 80 to 130 years for any given region in Chile, but about a dozen years when the country is considered as a whole.”
After the 2010 Maule earthquake, the country began installing a network of digital broadband seismic and ground motion stations, GPS stations, and GNSS stations to provide accurate information for tsunami warnings and damage assessment. Since 2012, the Centro Sismológico Nacional at the Universidad de Chile has operated more than 100 stations, and has recently begun to operate almost 300 strong-motion accelerometers that measure ground shaking.
In a third paper published in SRL, Felipe Leyton of the Universidad de Chile and colleagues analyze data collected from 163 of these strong-motion stations to learn more about the local site conditions of underlying rock and soil in these areas. Site conditions can modify the shaking of large earthquakes and control the damage to buildings and other infrastructure caused by the shaking.
The new study “gives us a unique opportunity to improve our knowledge of the behavior of soil deposits during earthquakes, especially in urbanized areas,” write Leyton and colleagues, who say the data could be used to help improve building designs and codes.
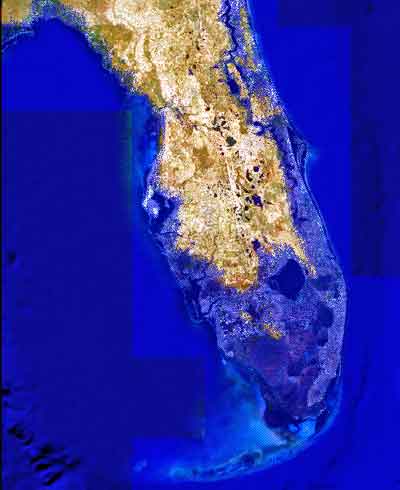
Image showing projected Florida flooding, from flood.firetree.net, using Google Earth with NASA data. Image from flood.firetree.net, using Google Earth.
Surveyors, prepare to get your feet wet. Global warming is about to hit you in the job list. By 2050, a majority of U.S. coastal areas are likely to be threatened by 30 or more days of flooding each year. This according to a December report in Earth’s Future, a journal of the American Geophysical Union.
[Parenthetically, the next issue of Survey Scene, in May, will be written by an actual geodesist. Until then, you have to put up with GPS World’s editor in chief — by no means a surveyor. Patience.]
The study used data from National Oceanic and Atmospheric Administration (NOAA) tide gauges to show the annual rate of coastal floods has accelerated in recent years. These are now five to 10 times more likely today than 50 years ago — and getting worse.
Mitigation decisions could range from retreating further inland to coastal fortification or to a combination of “green” infrastructure using both natural resources such as dunes and wetland, along with “gray” man-made infrastructure such as sea walls and redesigned storm water systems. And that’s not even mentioning such basics as redrawing property lines. Any way you look at it, surveyors are going to be involved.
“As communities across the country become increasingly vulnerable to water inundation and flooding, effective risk management is going to become more heavily reliant on environmental data and analysis,” said Holly Bamford, NOAA acting assistant secretary for conservation and management.
The recent U.S. Hydro 2015 conference in National Harbor, Maryland — an area particularly called out for vulnerability to the oncoming floods — naturally found a lot to talk about in this and related areas of interest for surveyors, with session tracks including: Effects of Climate Change on our Oceans and Waterways; Coastal and Ocean Mapping Initiatives; Advances in Unmanned System Technology, and several more.
Some of the papers presented that GPS World found of interest, and hopes to present or encapsulate in some form in the near future, include:
Resolving Systematic GPS Interference from Aeronautical Distance Measuring Equipment during Mission-Critical Shallow Water Multibeam Surveys
GPS Water-Level Buoy for Hydropgraphic Survey Operations
Examining the Uncertainty Associated with the Establishmenbt of an Ellipsoid to Chart Datum Separation Surface Using GNSS Buoys
Comparison of Horizontal and Vertical Resolvable Resolution between Repetitive Multibeam Surveys Using Different Kinematic GNSS Methods.
And those just came from the poster sessions. In the technical sessions, Jack Riley from the NOAA Coast Survey’s Hydrographic Systems and Technology Program presented a GPS Buoy Water Level Uncertainty Case Study.
Data from on High
Since you can’t get at a coastline from all angles — with any degree of stability, that is — data from overhead, sometimes far overhead, proves invaluable. Such as that provided by aerial digital imagery, LiDAR, and increasingly, satellites.
Because digital aerial images are already in electronic form, they can quickly be processed and made available to users. Most of the special cameras in use nowadays provide direct georeferencing capability, which allows camera position and orientation to be determined automatically using GPS and inertial measurement equipment. An entire mini-industry has grown up around integrating aerial data with that taken from ground surveys.
Light detection and ranging (LiDAR), a remote sensing system, became available for commercial topographic mapping in 1993. An airborne laser scanning system paired with a kinematic GPS receiver and an inertial navigation system can calculate and produce a highly accurate spot elevation. It is possible to obtain point densities that would likely take months to collect using traditional ground survey methods. The National Geodetic Survey (NGS) is currently implementing LiDAR into their shoreline mapping production process.
Our Record So Far
Coverage of these salty issues has been sparse in GPS World and associated newsletters, but not entirely absent. In 2006, the May issue featured “GPS Buoys Nautical Measurement.”
In 2008, Richard Langley edited an Innovation column on “Tsunami Detection by GPS,” featuring work for which co-author Attila Komjathy eventually won a GPS World Leadership Award in 2013. And in 2010, Langley brought forth an Innovation column on “Monitoring Water Level with GNSS.”
And way, way back in 2005, we published “Abreast of the Waves: Open-Sea Sensor to Measure Height and Direction.” This was prior to our digital era, so until we can scan a paper copy into here, we’ll simply give the abstract: “Accurate and timely information on open-sea wave conditions can help in preventing large-scale maritime disasters. This article describes a new, low-cost Global Positioning System (GPS)-based sensor that measures wave height with an accuracy of several centimeters and direction with an accuracy of 5 degrees. The receiver is mounted on a buoy, and a high-pass filter is used to extract the movement of the buoy and thus minimize GPS positioning errors. The data provided by the sensor is intended to improve wave prediction models. In addition, since this GPS-based sensor transmits only analyzed ocean wave data, it reduces the volume of data and leads to lower operating and acquisition costs. The article describes the concept of the GPS-based wave sensor, algorithms that are used for filtering and extracting wave data, as well as the results of open-sea trials.”
So there’s more to come. Watch this space. In the meantime, we leave you with Bob Dylan’s prophetic words, circa 1967.
Well, it’s sugar for sugar And salt for salt If you go down in the flood It’s gonna be your own fault.
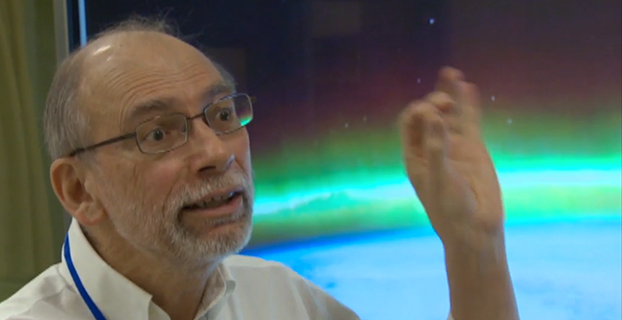
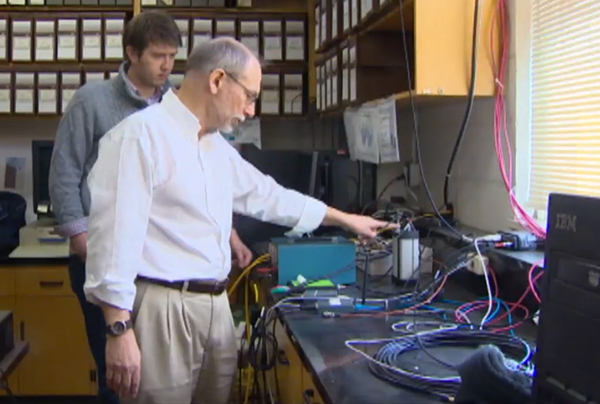
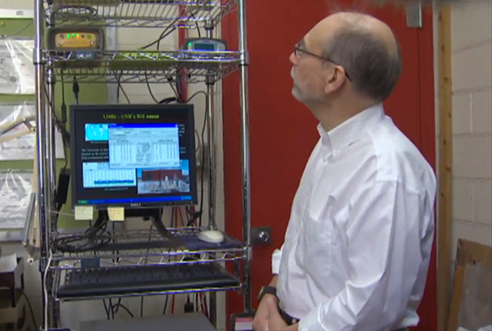
Langley, a professor at the University of New Brunswick, is working with the Jet Propulsion Laboratory in California to better understand how the ionosphere is disturbed by a variety of phenomena including solar outbursts and other natural hazards such as tsunamis. They are using the signals from GPS satellites to probe the ionosphere with the signals being picked up by receivers both on the ground and in low-Earth-orbiting satellites. The research could help find ways to mitigate ionospheric interference to GPS signals themselves as well as to other types of radio communications.
“GPS satellites are much higher than the ionosphere,” Langley told CBC News reporter Shane Fowler. “So the signals from the satellites have to come down through the ionosphere to receivers on or near the Earth’s surface. And as they come down through the ionosphere they get a little distorted. When you see auroras in the sky, that’s when you can tell the ionosphere is a bit disturbed. The average consumer may not notice these variances, but high-precision applications, like for scientific applications, we actually always see the effect of the ionosphere.”
Screen capture from CBC news video.
The research could also help develop early-detection systems for tsunamis. “The energy from that water displacement actually propagates up all the way into the atmosphere, all the way to the ionosphere,” Langley told CBC. “It basically moves around the electrons up there and GPS signals coming down from the satellites, through the ionosphere, pick up those small variations. It has the potential to save a lot of lives.”
Solar flares can also affect GPS signals. The Carrington Event, a solar storm in 1859, knocked out some of Earth’s telegraph systems. “The effect on the Earth’s magnetic field was so strong that currents were set up,” Langley told the CBC. “Those currents were so strong that telegraphs could run without batteries. There was enough current from this disturbance that it could run the telegraphs. And in some cases there was too much and rumour has it started small fires. Luckily we haven’t had one of those again; it seems to be a one-in-100-year, or a one-in-a-200-year, event.”
Abstract submissions are now being accepted for The Institute of Navigation’s (ION) Pacific PNT Conference, to be held April 20-23, 2015, at the Waikiki Beach Marriott, Honolulu, Hawaii. Abstracts are due November 14, 2014.
Pacific PNT, where “East Meets West in the Global Cooperative Development of Positioning, Navigation and Timing Technology,” brings together policy and technical leaders from Japan, Singapore, China, South Korea, Australia, the United States, and more for policy updates, program status and technical exchange.
“Global cooperative interoperability” will frame the technical program. Leaders representing academia, government, industry and the scientific community will convene to solve PNT challenges that impact Pacific Rim development.
Pacific PNT 2015 is organized by a Pacific Rim advisory board and will feature technical papers presented on a diverse array of topics including:
Aircraft Navigation and Surveillance
Agricultural, Construction and Mining
Algorithms and Methods
Alternative Navigation and Signals of Opportunity
Aviation Applications of GNSS
Challenging Navigation Problems
Collaborative Navigation Topics
Earthquake & Tsunami Prediction and Monitoring with GNSS
GNSS Augmentations
GNSS Correction and Monitoring Networks
GNSS Environmental Monitoring
GNSS Policy/Status Updates
GNSS Signal Structures
Inertial Navigation Technology and Applications
Interference and Spectrum
Ionosphere Monitoring with GNSS
Magnetic Field Navigation and Mapping
Maritime Navigation
Nature-Inspired Navigation
PNT and Automobile Safety
PNT and Social Media
PNT for Domestic and Healthcare Applications
Precision Agriculture and Machine Control
Time and Frequency Distribution
UAS Technologies
Abstracts are being accepted through November 14, 2014. For more information the ION’s Pacific PNT 2015, visit www.ion.org/pnt.
PTTI 2014 Registration Opens
Registration is now open for the ION Precise Time & Time Interval Meeting (PTTI) 2014 to be held December 1-4 at the Seaport Boston Hotel, Boston, Massachusetts. The technical program is available online.
The annual PTTI conference has a technical program designed to disseminate and coordinate PTTI information at the user level; review present and future PTTI requirements; inform government and industry engineers, technicians, and managers of precise time and frequency technology and its problems; and provide an opportunity for an active exchange of new technology associated with PTTI.
The Distinguished PTTI Service Award, which recognizes outstanding contributions related to the management of PTTI systems, will be presented on Thursday, December 4.
CoreLogic, a global property information, analytics and data-enabled services provider, has released a new version of its EQECAT natural catastrophe modeling platform, which contains three new proprietary risk models that quantify and analyze the potential financial impact of catastrophic natural hazards in peak exposure regions across the globe. The expansion of natural catastrophe risk analysis includes modeling for earthquake and tsunami events in Japan and earthquake events in Singapore, as well as for European windstorms, including a North European offshore wind farm risk model.
EQECAT, which was acquired by CoreLogic in December 2013, first introduced its natural catastrophe risk modeling platform RQE (Risk Quantification & Engineering) in January 2013 that includes more than 180 natural hazard models for 96 countries and territories spanning six continents. Loss calculations simulate 300,000 years of losses to provide comprehensive and highly credible estimates of risk exposure to earthquakes, tropical cyclones and windstorms, severe convective storms, brushfires, winter storms and flooding.
“This release of the RQE v15.0 platform not only advances the innovative and industry-leading science that is the hallmark of EQECAT risk models, but also demonstrates the commitment CoreLogic has to delivering timely enhancements and new platform features to our clients,” said Paul Little, head of EQECAT.
The additional catastrophe risk modeling delivered through the new RQE v15.0 platform includes:
The European Windstorm Model, which introduces the ability to analyze offshore wind farm turbines that are rapidly expanding in Europe as a result of major investments in alternative energy. The “Eurowind” model extends over the North Sea, Irish Sea, Baltic Sea and Atlantic Ocean, and gives insight into loss caused by wind storms. In addition, the windstorm model includes two views of frequencies — the empirical model based on the historical record from 1960 to present, and the analytic model with a continuous 1200-year simulation of an Earth System Model (ESM) driven by climatic background conditions to characterize the frequency and severity of European windstorms. The European Windstorm Model also now incorporates Spain and Portugal, extending the existing coverage to 24 countries and provides analysis of extratropical cyclone risk. Expanded capabilities also include access to Global Climate Model research used to help determine the frequency and scale of European windstorms.
The Japan Earthquake Model, which provides the most current view of earthquake risk across the country based on December 2013 research released by the Japanese government and national research organizations. This model accounts for previously un-modeled very large magnitude events with updated seismic source zones and increased maximum magnitudes. New damage and loss data from the 2011 Great East Japan (TÅhoku-oki) earthquake prompted a complete review and update to model vulnerability functions, including major changes to performance -based effects of deep building foundations and base isolation. For the first time, CoreLogic introduces tsunami as a sub-peril, offering both a fully probabilistic and a scenario-based tsunami risk model, using 30-meter digital elevation maps for more granular and precise risk evaluations for a complete view of earthquake and tsunami risk across Japan.
The Singapore Earthquake Model, which accounts for the increased probability of a near-term large-magnitude earthquake on the Sunda (Java) megathrust fault. This fault zone is one of the most active on Earth and largely influences earthquake risk in Singapore. This new model accounts for seismic risk factors specific to Singapore, such as soft soils that amplify intermediate-period ground motions from distant large earthquakes and the existence of reinforced concrete high-rise buildings.
“Combining more than 30 years of collected data from CoreLogic with EQECAT natural catastrophe models allows us to deliver a more comprehensive, highly credible analysis of key drivers of hazard risk at various levels of exposure around the globe, from across regional borders to individual site levels,” said Mahmoud Khater, chief science officer for catastrophe modeling.
The updated EQECAT RQE v15.0 platform also offers significant enhancements to user interface, reporting options and workflow management tools. Enhancements include a more comprehensive view of exposure data with expanded filter options, event-specific hazard intensity reports for individual locations, and analysis of annual exceedance probability refined by region and sub-peril to show drivers of portfolio losses, among other capabilities.
The explosion of an underground nuclear device by North Korea this week disturbed the Earth’s ionosphere. The blast generated infrasonic waves that propagated all the way to the upper atmosphere causing small variations in the density of electrons there.
By analyzing the signals from GPS satellites collected at ground-based monitoring stations in South Korea and Japan, scientists at the California Institute of Technology’s Jet Propulsion Laboratory, Purdue University, and the Korea Advanced Institute of Science and Technology independently confirmed the ionospheric disturbance generated by the North Korean test.
The researchers used the same GPS signals that are used by surveyors for precise positioning. These signals are slightly perturbed as they transit the ionosphere, and by processing the collected data with sophisticated software, the researchers were able to detect the small effect that the explosion-induced atmospheric waves had on the distribution of the ionosphere’s electrons.
The same technique is being used by the researchers and others to study the ionospheric effects from natural hazards such as tsunamis, earthquakes, and volcanic eruptions.
Led by Dr. Attila Komjathy, who received his Ph.D. from the University of New Brunswick in 1997, a team from NASA’s Jet Propulsion Laboratory has demonstrated a technique that has the potential to significantly improve tsunami monitoring and warning.
The technique uses data from multiple Global Positioning System receivers on the ground to measure small perturbations in the ionosphere’s electron density caused by a tsunami.
The changing sea level of a tsunami, even far from a coast, generates waves in the atmosphere that make it all the way up to the ionosphere, some 350 kilometres or so above the sea surface. Here, they disturb the electrons that affect the propagation of GPS signals. The disturbance is so small that ordinary GPS receivers do not notice the passage of the waves. However, with advanced software processing of the data collected by specialized receivers used, for example, by surveyors and geodesists, the waves can be visualized and used to track the progress of the tsunami.
The JPL team has dramatically demonstrated their technique for the devastating tsunami associated with last year’s massive offshore Japanese earthquake. They used data from the more than 1,000 receivers of Japan’s permanent GPS monitoring network. The propagating ionospheric waves can be clearly seen in a video the team has posted to YouTube.
An earlier report on NASA’s tsunami-detection work can be found here.
NASA is investing in research to obtain real-time GPS measurements from around the world so that researchers can integrate this technology into a global tsunami warning system. Additional potential applications might include the remote sensing of ionospheric perturbations generated by other natural hazards such as earthquakes and volcanic eruptions and human-made events such as nuclear tests.
Dr. Komjathy was one of the first to investigate the use of GPS signals to study the ionosphere. His pioneering Ph.D. research under Prof. Richard Langley was awarded a Gold Medal from the Governor General of Canada.
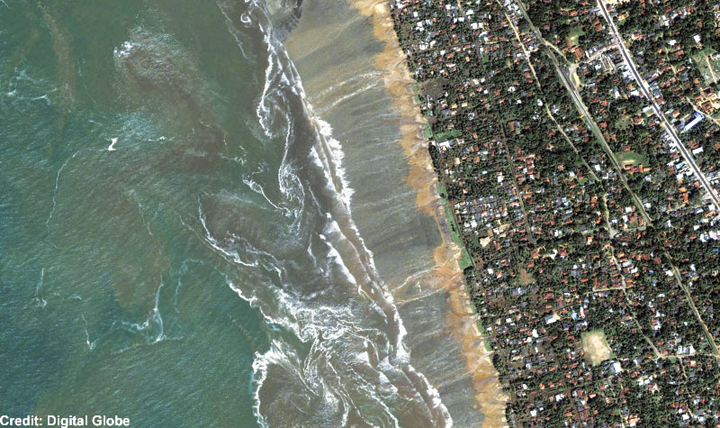
QuickBird satellite image of Kalutara Beach on the southwestern coast of Sri Lanka showing the receding waters and beach damage from the Sumatra tsunami.( Credit: Digital Globe)
How Ionospheric Observations Might Improve the Global Warning System
By Giovanni Occhipinti, Attila Komjathy, and Philippe Lognonné
Recent investigations have demonstrated that GPS might be an effective tool for improving the tsumani early-warning system through rapid determination of earthquake magnitude using data from GPS networks. A less obvious approach is to use the GPS data to look for the tsunami signature in the ionosphere.
INNOVATION INSIGHTS by Richard Langley
THE TSUNAMI generated by the December 26, 2004, earthquake just off the coast of the Indonesian island of Sumatra killed over 200,000 people. It was one of the worst natural disasters in recorded history. But it might have been largely averted if an adequate warning system had been in place.
A tsunami is generated when a large oceanic earthquake causes a rapid displacement of the ocean floor. The resulting ocean oscillations or waves, while only on the order of a few centimeters to tens of centimeters in the open ocean, can grow to be many meters even tens of meters when they reach shallow coastal areas. The speed of propagation of tsunami waves is slow enough, at about 600 to 700 kilometers per hour, that if they can be detected in the open ocean, there would be enough time to warn coastal communities of the approaching waves, giving people time to flee to higher ground.
Seismic instruments and models are used to predict a possible tsunami following an earthquake and ocean buoys and pressure sensors on the ocean bottom are used to detect the passage of tsunami waves. But globally, the density of such instrumentation is quite low and, coupled with the time lag needed to process the data to confirm a tsunami, an effective global tsunami warning system is not yet in place.
However, recent investigations have demonstrated that GPS might be a very effective tool for improving the warning system. This can be done, for example, through rapid determination of earthquake magnitude using data from existing GPS networks. And, incredible as it might seem, another approach is to use the GPS data to look for the tsunami signature in the ionosphere: the small displacement of the ocean surface displaces the atmosphere and makes it all the way to the ionosphere, causing measurable changes in ionospheric electron density.
In this month’s column, we look in detail at how a tsunami can affect the ionosphere and how GPS measurements of the effect might be used to improve the global tsunami warning system.
“Innovation” is a regular column that features discussions about recent advances in GPS technology and its applications as well as the fundamentals of GPS positioning. The column is coordinated by Richard Langley of the Department of Geodesy and Geomatics Engineering at the University of New Brunswick.
The December 26, 2004, earthquake-generated Sumatra tsunami caused enormous losses in life and property, even in locations relatively far away from the epicentral area. The losses would likely have never been so massive had an effective worldwide tsunami warning system been in place. A tsunami travels relatively slowly and it takes several hours for one to cross the Indian Ocean, for example. So a warning system should be able to detect a tsunami and provide an alert to coastal areas in its path. Among the strengths of a tsunami early-warning system would be its capability to provide an estimate of the magnitude and location of an earthquake. It should also confirm the amplitude of any associated tsunami, due to massive displacement of the ocean bottom, before it reaches populated areas. In the aftermath of the Sumatra tsunami, an important effort is underway to interconnect seismic networks and to provide early alarms quantifying the level of tsunami risk within 15 minutes of an earthquake.
However, the seismic estimation process cannot quantify the exact amplitude of a tsunami, and so the second step, that of tsunami confirmation, is still a challenge. The earthquake fault mechanism at the epicenter cannot fully explain the initiation of a tsunami as it is only approximated by the estimated seismic source. The fault slip is not transmitted linearly at the ocean bottom due to various factors including the effect of the bathymetry, the fault depth, and the local lithospheric properties as well as possible submarine landslides associated with the earthquake.
In the open ocean, detecting, characterizing, and imaging tsunami waves is still a challenge. The offshore vertical tsunami displacement (on the order of a few centimeters up to half a meter in the case of the Sumatra tsunami) is hidden in the natural ocean wave fluctuations, which can be several meters or more. In addition, the number of offshore instruments capable of tsunami measurements, such as tide gauges and buoys, is very limited. For example, there are only about 70 buoys in the whole world. As a tsunami propagates with a typical speed of 600–700 kilometers per hour, a 15-minute confirmation system would require a worldwide buoy network with a 150-kilometer spacing.
Satellite altimetry has recently proved capable of measuring the sea surface variation in the case of large tsunamis, including the December 2004 Sumatra event. However, satellites only supply a few snapshots along the sub-satellite tracks. Optical imaging of the shore hs successfully measured the wave arrival at the coastline (see ABOVE PHOTO), but it is ineffective in the open sea. At present, only ocean-bottom sensors and GPS buoy receivers supply measures of mid-ocean vertical displacement. In many cases, the tsunami can only be identified several hours after the seismic event due to the poor distribution of sensors. This delay is necessary for the tsunami to reach the buoys and for the signal to be recorded for a minimum of one wave period (a typical tsunami wave period is between 10 and 40 minutes) to be adequately filtered by removing the “noise” due to normal wave action.
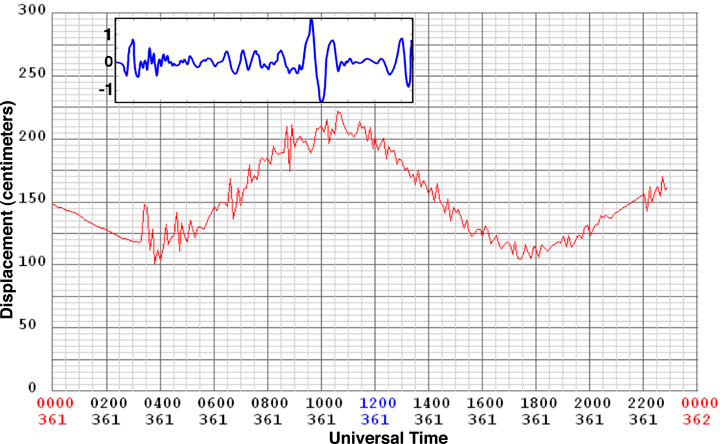
In the case of the December 2004 Sumatra event, the first tsunami measurements by any instrumentation were only made available about 3 hours after the earthquake. They were supplied by the real-time tide gauge at the Cocos Islands, an Australian territory in the southeast Indian Ocean (see FIGURE 1 where the tsunami signature is superimposed on the large semidiurnal tide fluctuation). Up until that time, the tsunami could not be fully confirmed and coastal areas remained vulnerable to tsunami damage. This delay in confirmation is a fundamental weakness of the existing tsunami warning systems.
Figure 1. The Sumatra tsunami signal measured at the Cocos Islands by the tide gauge (red) and by the co-located GPS receiver (blue). The tide gauge measures the sea-level displacement (tide plus superimposed tsunami) and the GPS receiver measures the slant total electron content perturbation (+/-1 TEC unit) in the ionosphere.
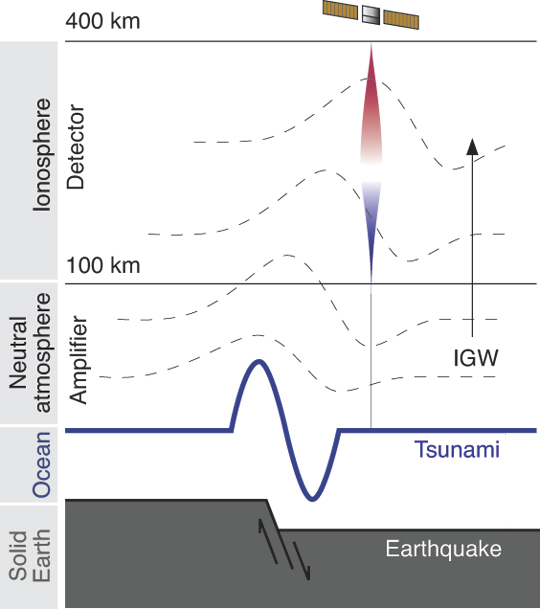
Ionospheric Perturbation. Recently, observational and modeling results have confirmed the existence and detectability of a tsunamigenic signature in the ionosphere. Physically, the displacement induced by tsunamis at the sea surface is transmitted into the atmosphere where it produces internal gravity waves (IGWs) propagating upward. (When a fluid or gas parcel is displaced at an interface, or internally, to a region with a different density, gravity restores the parcel toward equilibrium resulting in an oscillation about the equilibrium state; hence the term gravity wave.) The normal ocean surface variability has a typical high frequency (compared to tsunami waves) and does not transfer detectable energy into the atmosphere. In other words, the Earth’s atmosphere behaves as an “analog low-pass filter.” Only a tsunami produces propagating waves in the atmosphere. During the upward propagation, these waves are strongly amplified by the double effects of the conservation of kinetic energy and the decrease of atmospheric density resulting in a local displacement of several tens of meters per second at 300 kilometers altitude in the atmosphere. This displacement can reach a few hundred meters per second for the largest events.
At an altitude of about 300 kilometers, the neutral atmosphere is strongly coupled with the ionospheric plasma producing perturbations in the electron density. These perturbations are visible in GPS and satellite altimeter data since those signals have to transit the ionosphere. The dual-frequency signal emitted by GPS satellites can be processed to obtain the integral of electron density along the paths between the satellites and the receiver, the total electron content (TEC).
Within about 15 minutes, the waves generated at the sea surface reach ionospheric altitudes, creating measurable fluctuations in the ionospheric plasma and consequently in the TEC. This indirect method of tsunami detection should be helpful in ocean monitoring, allowing us to follow an oceanic wave from its generation to its propagation in the open ocean.
So, can ionospheric sounding provide a robust method of tsunami confirmation? It is our hope that in the future this technique can be incorporated into a tsunami early-warning system and complement the more traditional methods of detection including tide gauges and ocean buoys. Our research focuses on whether ground-based GPS TEC measurements combined with a numerical model of the tsunami-ionosphere coupling could be used to detect tsunamis robustly. Such a detection scheme depends on how the ionospheric signature is related to the amplitude of the sea surface displacement resulting from a tsunami. In the near future, the ionospheric monitoring of TEC perturbations might become an integral part of a tsunami warning system that could potentially make it much more effective due to the significantly increased area of coverage and timeliness of confirmation.
In this article, we’ll take a look at the current state of the art in modeling tsunami-generated ionospheric perturbations and the status of attempts to monitor those perturbations using GPS.
Some Background
Pioneering work by the Canadian atmospheric physicist Colin Hines in the 1970s suggested that tsunami-related IGWs in the atmosphere over the oceanic regions, while interacting with the ionospheric plasma, might produce signatures detectable by radio sounding.
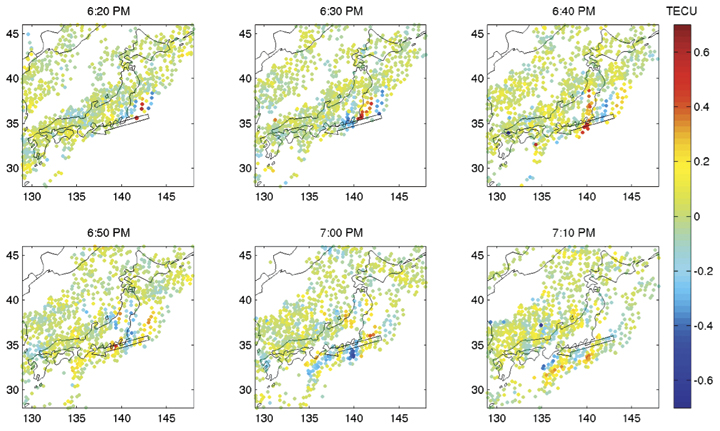
In June 2001, an episodic perturbation was observed following a tsunamigenic earthquake in Peru. After its propagation across the Pacific Ocean (taking about 22 hours), the tsunami reached the Japanese coast and its signature in the ionosphere was detected by the Japanese GPS dense network (GEONET). The perturbation, shown in FIGURE 2, has an arrival time and characteristic period consistent with the tsunami propagation determined from independent methods. Unfortunately, similar signatures in the ionosphere are also produced by IGWs associated with traveling ionospheric disturbances (TIDs), and are commonly observed in the TEC data. However, the known azimuth, arrival time, and structure of the tsunami allows us to use this data source, even if it contains background TIDs.
Figure 2. The observed signal for the June 23, 2001, tsunami (initiated offshore Peru). Total electron content variations are plotted at the ionosphere pierce points. A wave-like disturbance is seen propagating toward the coast of Honshu, the main island of Japan.
The December 26, 2004, Sumatra earthquake, with a magnitude of 9.3, was an order of magnitude larger than the Peru event and was the first earthquake and tsunami of magnitude larger than 9 of the so-called “human digital era,” comparable to the magnitude 9.5 Chilean earthquake of May 22, 1960.
In addition to seismic waves registered by global seismic networks, the Sumatra event produced infragravity waves (long-period wave motions with typical periods of 50 to 200 seconds) remotely observed from the island of Diego Garcia, perturbations in the magnetic field observed by the CHAMP satellite, and a series of ionospheric anomalies.
Two types of ionospheric anomaly were observed: anomalies of the first type, detected worldwide in the first few hours after the earthquake, were reported from north of Sumatra, in Europe, and in Japan. They are associated with the surface seismic waves that propagate around the world after an earthquake rupture (so-called Rayleigh waves).
Anomalies of the second type were detected above the ocean and were clearly associated with the tsunami. In the Indian Ocean, the occurrence times of TEC perturbations observed using ground-based GPS receivers and satellite altimeters were consistent with the observed tsunami propagation speed. The GPS observations from sites to the north of Sumatra show internal gravity waves most likely coupled with the tsunami or generated at the source and propagating independently in the atmosphere. The link with the tsunami is more evident in the observations elsewhere in the Indian Ocean. The TEC perturbations observed by the other ground-based GPS receivers moved horizontally with a velocity coherent with the tsunami propagation.
Figure 3. The tsunamigenic earthquake mechanism and transfer of energy in the neutral and ionized atmosphere. The solid Earth displacement produces the tsunami and the sea surface displacement produces an internal gravity wave in the neutral atmosphere, which perturbs the electron distribution in the ionosphere.
The amplitude of the observed TEC perturbations is strongly dependent on the filter method used. The four TECU-level peak-to-peak variations in filtered GPS TEC measurements from north of Sumatra are coherent with the differential TEC at the 0.4 TECU per 30 seconds level observed in the rest of the Indian Ocean. (One TEC unit or TECU is 1016 electrons per meter-squared, equivalent to 0.162 meters of range delay at the GPS L1 frequency.) Such magnitudes can be detected using GPS measurements since GPS phase observables are sensitive to TEC fluctuations at the 0.01 TECU level. We emphasize also the role of the elevation angle in the detection of tsunamigenic perturbations in the ionosphere. As a consequence of the integrated nature of TEC and the vertical structure of the tsunamigenic perturbation, low-elevation angle geometry is more sensitive to the tsunami signature in the GPS data, hence it is more visible.
The TEC perturbation observed at the Cocos Islands by GPS can be compared with the co-located tide-gauge (Figure 1). The tsunami signature in the data from the two different instruments shows a similar waveform, confirming the sensitivity of the ionospheric measurement to the tsunami structure.
The link between the tsunami at sea level and the perturbation observed in the ionosphere has been demonstrated using a 3D numerical modeling based on the coupling between the ocean surface, the neutral atmosphere, and the ionosphere (see FIGURE 3). The modeling reproduced the TEC data with good agreement in amplitude as well as in the waveform shape, and quantified it by a cross-correlation (see FIGURE 4). The resulting shift of +/-1 degree showed the presence of zonal and meridional winds neglected in the modeling. The presence of the wind can, indeed, introduce a shift of 1 degree in latitude and 1.5 degrees in longitude.
Since modeling is an effective method to discriminate between the tsunami signature in the ionosphere and other potential perturbations, the GPS observations can be a useful tool to develop an inexpensive tsunami detection system based on the ionospheric sounding.
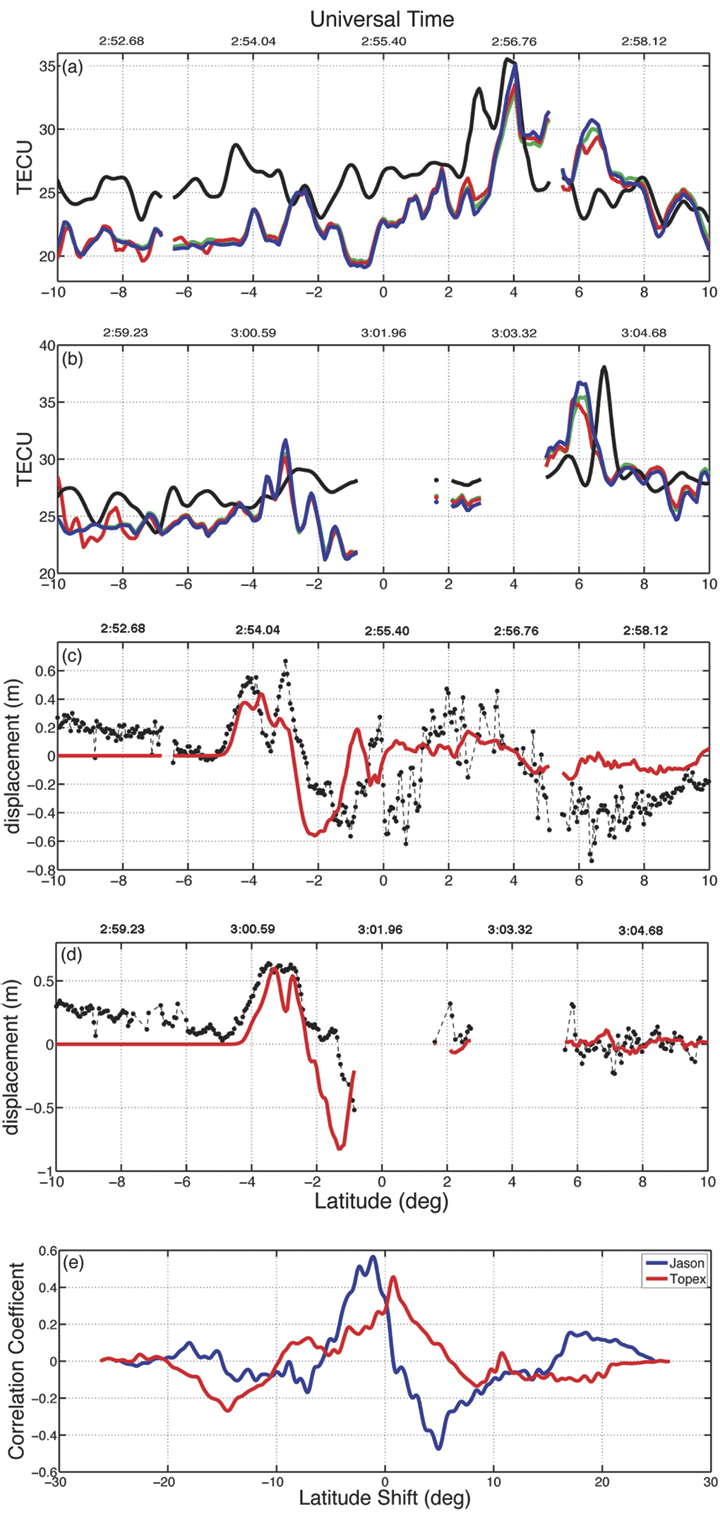
Figure 4. Satellite altimeter and total electron content (TEC) signatures of the Sumatra tsunami. The modeled and observed TEC is shown for (a) Jason-1 and for (b) Topex/Poseidon: data (black), synthetic TEC without production-recombination-diffusion effects (blue), with production-recombination (red), and production-recombination-diffusion (green). The Topex/Poseidon synthetic TEC has been shifted up by 2 TEC units. In (c) and (d), the altimetric measurements of the ocean surface (black) are plotted for the Jason-1 and Topex/Poseidon satellites, respectively. The synthetic ocean displacement, used as the source of internal gravity waves in the neutral atmosphere, is shown in red. In (e), the cross-correlations between TEC synthetics and data are shown for Jason-1 (blue) and Topex/Poseidon (red).
Modeling TEC Perturbations
A model to describe the effect of a tsunami on the ionosphere has been developed at the Institut de Physique du Globe de Paris (IPGP), France. It is comprised of three main parts. Firstly, it computes tsunami propagation using realistic bathymetry of, for example, the Indian Ocean. Secondly, an oceanic displacement is used to excite IGWs in the neutral atmosphere. Thirdly, it computes the response of the ionosphere induced by the neutral atmospheric motion resulting in enhanced electron densities. After integrating the electron densities, we obtain modeled (synthetic) TEC data. The modeling steps are as follows:
Tsunami Propagation. Tsunami modeling is an established science and the propagation of tsunamis is generally based on a shallow-water hypothesis. Under this hypothesis, the ocean is considered as a simple layer where the ocean depth, h, is locally taken into account in the tsunami propagation velocity, v = √ hg, which directly depends on h and the gravity acceleration g. The modeling, usually based on finite differences, solves the appropriate hydrodynamic equations.
Neutral Atmosphere Coupling. A tsunami is an oceanic gravity wave and its propagation is not limited to the oceanic surface; as previously discussed, the ocean displacement is transferred to the atmosphere where it becomes an internal gravity wave. This coupling phenomenon is linear and can be reproduced solving the wave propagation equations, nominally the continuity and the so-called Navier-Stokes equations. These equations are solved assuming the atmosphere to be irrotational, inviscid, and incompressible. The IGWs are, indeed, imposed by displacement of the mass under the effect of the gravity force, contrary to the elastic waves generated by compression (for example, sound waves), so the medium can be considered incompressible. FIGURE 5 shows the IGWs produced by the Sumatra tsunami. The inversion of the velocity with altitude (wind shear) is a typical structure of IGWs.
Neutral-Plasma Coupling. The tsunamigenic IGWs are injected into a 3D ionospheric model to reproduce the induced electron density perturbations. In essence, the coupling model solves the hydromagnetic equations for three ion species (O2 + , NO+ , and O+ ). Physically, the neutral atmosphere motion induces fluctuations in the plasma velocity by way of momentum transfer driven by collision frequency and the Lorentz term associated with Earth’s magnetic and electric fields. Ion loss, recombination, and diffusion are also taken into account in the ion continuity equation. Finally, the perturbed electron density is inferred from ion densities using the charge neutrality hypothesis. The International Reference Ionosphere model is used for background electron density; SAMI2 (a recursive acronym: SAMI2 is Another Model of the Ionosphere) is used for collision, production, and loss parameters; and a constant geomagnetic field is assumed based on the International Geomagnetic Reference Field. FIGURE 5 shows the perturbation induced in the ionospheric plasma by the tsunamigenic IGW following the Sumatra event. The perturbation is strongly localized to around 300 kilometers altitude where the electron density background is maximized.
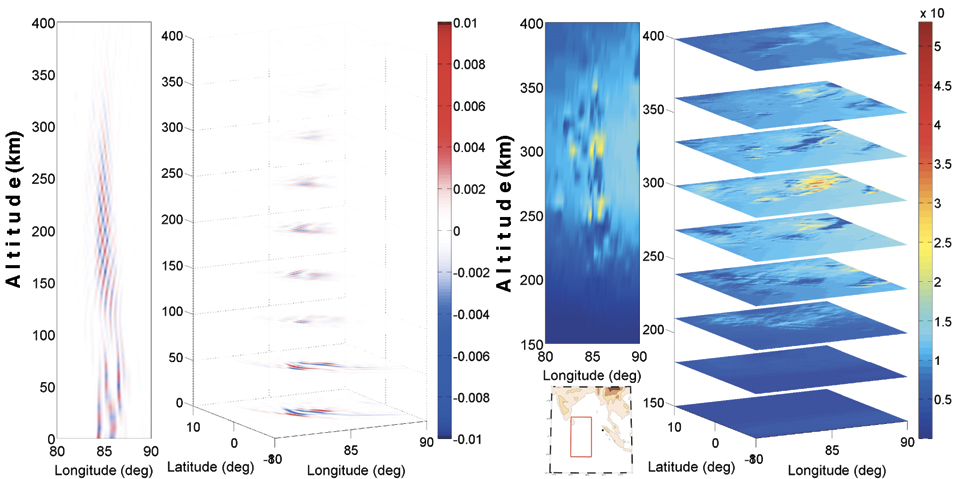
Figure 5. Internal gravity waves (IGWs) generated by the Sumatra tsunami and the response of the ionosphere to neutral motion at 02:40 UT (almost two hours after the earthquake). On the left, the normalized vertical velocity induced by tsunami-generated IGWs in the neutral atmosphere is shown. On the right, the perturbation induced by IGWs in the ionospheric plasma (in electrons per cubic meter) is shown, with the maximum perturbation at an altitude of about 300 kilometers. The vertical cut shown in these profiles is at a latitude of -1 degree.
The resulting electron density dynamic model described above allows us to compute a map of the perturbed TEC by simple vertical integration (see FIGURE 6). In addition to the geometrical dispersion of the tsunami, the TEC map shows horizontal heterogeneities in the electron density perturbation that are induced by the geomagnetic field inclination. The magnetic field plays a fundamental role in the neutral-plasma coupling, resulting in a strong amplification at the magnetic equator where the magnetic field is directed horizontally. The isolated perturbation appearing more to the south is probably induced by the full development of the IGW in the atmosphere. Recent work also explains this second perturbation as induced by the role of the magnetic field in the neutral-plasma coupling.
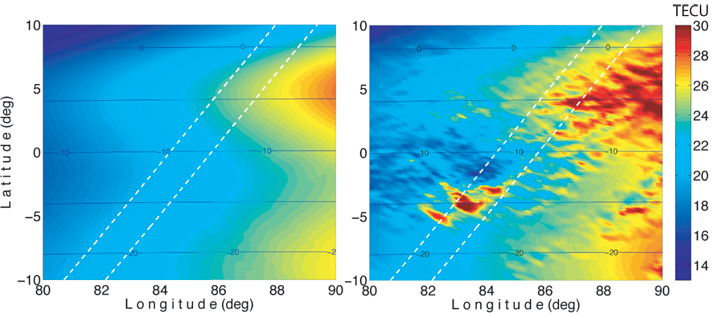
Figure 6. The signature of the Sumatra tsunami in total electron content (TEC) at 03:18 UT (right) compared with the unperturbed TEC (left). The TEC images have been computed by vertical integration of the perturbed and unperturbed electron density fields. The broken lines represent the Topex/Poseidon (left) and Jason-1 (right) trajectories. The blue contours represent the geomagnetic field inclination.
GPS Data Processing
To validate our model, we use ground-based GPS receivers to look for the ionospheric signal induced by tsunamis. Prior research has shown post-processed results detecting a tsunami-generated TEC signal using regional GPS networks such as GEONET in Japan (about 1,000 stations) or the Southern California Integrated GPS Network (about 200 stations). Those studies benefited from the very high density of GPS receivers in the regional networks, so that, for example, no forward modeling was needed to help initially identify the characteristics of the tsunami-generated signal.
High-Precision Processing. More than 1,300 globally-distributed dual-frequency GPS receivers are available using publicly accessible networks, including those of the International GNSS Service and the Continuously Operating GPS Stations coordinated by the U.S. National Geodetic Survey. Most researchers estimate vertical ionospheric structure and, simultaneously, treat hardware-related biases as nuisance parameters. In our approach for calibrating GPS receiver and satellite inter-frequency biases, we take advantage of all available GPS receivers using a new processing technique based on the Global Ionospheric Mapping software developed at the Jet Propulsion Laboratory (JPL). FIGURE 7 shows a JPL TEC map using 1,000 GPS stations. This new capability is designed to estimate receiver biases for all stations in the global network. We solve for the instrumental biases by modeling the ionospheric delay and removing it from the observation.
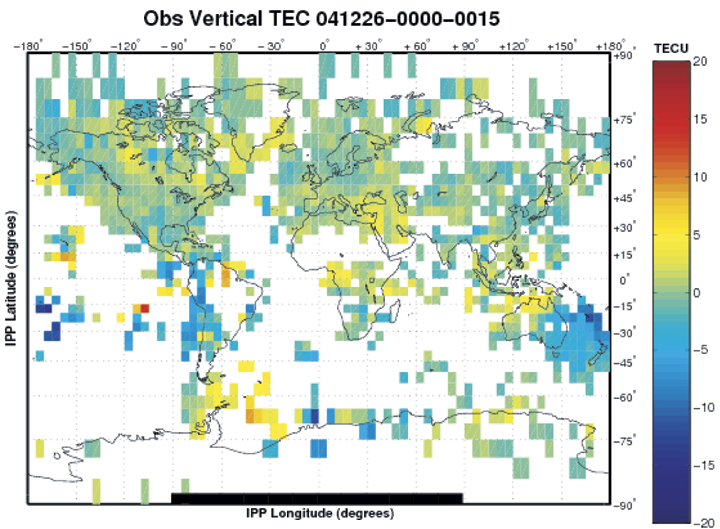
Figure 7. The total electron content (TEC) between 01:00 and 01:15 UT on December 26, 2004, at ionosphere pierce points (IPPs) provided by a global network of more than 1,000 GPS tracking stations. To highlight variations, a five-day average of TEC has been subtracted from the observed TEC.
Ionospheric Warning System
The currently implemented tsunami warning system uses seismometers to detect earthquakes and to perform an estimation of the seismic moment by monitoring seismic waves. After a potential tsunami risk is determined, ocean buoy and pressure sensors have to confirm the tsunami risk. Unfortunately, the number of available ocean buoys is limited to about 70 over the whole planet. With the existing system, it may take several hours to confirm a tsunami when taking into account both the propagation time (of tsunamis reaching buoys) and data-processing time. On the other hand, the proposed ionosphere-based tsunami detection system may only require the propagation time and data-processing delays of only up to about 15–30 minutes. GPS receivers are able to sound the ionosphere up to about 20 degrees away from the receiver location, and a dense GPS network can therefore increase the coverage of the monitored area.
The fundamental idea behind a detection method is that we need to separate tsunami-generated TEC signatures from other sources of ionospheric disturbances. However, the tsunami-generated TEC perturbations are distinguishable because they are tied to the propagation characteristics of the tsunami. Tsunami-related fluctuations should be in the gravity-wave period domain and cohere in geometry and distance with the earthquake epicenter (for example, they show up in data on multiple satellites from multiple stations and, with increasing distance from the epicenter, at a rate related to tsunami propagation speed).
The coupled tsunami model described earlier can also be used to compute a prediction for the tsunami-generated TEC perturbation based on the seismic displacement as an input parameter to the model. The model prediction may be used as a detection aid by indicating the location of the tsunami wave front with time. This permits us to focus our detection efforts on specific locations and times, and will allow us to discriminate signal from noise.
The model also provides information on the expected magnitude of the TEC perturbation. This provides further value in filter discrimination. Cross-correlations can be performed on nearby observations using different satellites and stations to take advantage of tsunami-related perturbations being coherent in geometry and distance from the epicenter. Once the signal is detected in data from multiple satellites and stations, we can “track” and image the tsunami during its propagation in space and time.
The goal of our research is to assess the feasibility of detecting tsunamis in near real time. This requires that GPS data be acquired rapidly. Rapid availability of ground-based GPS data has been demonstrated via the NASA Global Differential GPS System, a highly accurate, robust real-time GPS monitoring and augmentation system.
Conclusions
Earlier research using GPS-derived TEC observations has revealed TEC perturbations induced by tsunamis. However, in our research, we use a combination of a coupled ionosphere-atmosphere-tsunami model with large GPS data sets. Ground-based GPS data are used to distinguish tsunami-generated TEC perturbations from background fluctuations. Tsunamis are among the most disrupting forces humankind faces. The December 26, 2004, earthquake and resulting tsunami claimed more than 200,000 lives, with several hundreds of thousands of people injured. The damage in infrastructure and other economic losses were estimated to be in the range of tens of billions of dollars. To help prevent such a global disaster from occurring again, we suggest that ionospheric sounding by GPS be integrated into the existing tsunami warning system as soon as possible.
Acknowledgments
This article is based on the paper “Three-Dimensional Waveform Modeling of Ionospheric Signature Induced by the 2004 Sumatra Tsunami” published in Geophysical Research Letters. The authors wish to acknowledge François Crespon (Noveltis, Ramonville-Saint-Agne, France) for the TEC data analysis in Figure 1, Juliette Artru (Centre National d’Etudes spatiales – CNES, Toulouse, France) for her work on the detection of tsunamigenic TEC perturbations shown in this article, and Grégoire Talon for Figure 3. The IPGP portion of the work is sponsored by L’Agence Nationale de la Recherche, by CNES, and by the Ministère de l’Enseignement supérieur et de la Recherche. The first author would also like to thank John LaBrecque of NASA’s Science Mission Directorate for supporting his fellowship at the California Institute of Technology/JPL.
GIOVANNI OCCHIPINTI received his Ph.D. at the Institut de Physique du Globe de Paris (IPGP) in 2006. In 2007, he joined NASA’s Jet Propulsion Laboratory (JPL), California Institute of Technology, as a postdoctoral fellow to continue his work on the detection and modeling of tsunamigenic perturbations in the ionosphere. He will soon take up the position of assistant professor at the University of Paris and IPGP. His scientific interests are focused on solid Earth-atmosphere-ionosphere coupling.
ATTILA KOMJATHY is senior staff member of the Ionospheric and Atmospheric Remote Sensing Group of Tracking Systems and Applications Section at JPL, specializing in remote sensing techniques. He received his Ph.D. from the Department of Geodesy and Geomatics Engineering at the University of New Bruns-wick, Canada, in 1997. He has received the Canadian Governor General’s Gold Medal for Academic Excellence and NASA awards including an Exceptional Space Act Award.
PHILIPPE LOGNONNÉ is the director of the Space Department of IPGP, a professor at the University of Paris VII, and a junior member of the Institut Universitaire de France. His science interests are in the field of remote sensing and are related to the detection of seismic waves and tsunamis in the ionosphere. Also, he participates in several projects in planetary seismology.
FURTHER READING
Ionospheric Seismology
“3D Waveform Modeling of Ionospheric Signature Induced by the 2004 Sumatra Tsunami” by G. Occhipinti, P. Lognonné, E. Alam Kherani, and H. Hebert, in Geophysical Research Letters, Vol. 33, L20104, doi:10.1029/2006GL026865, 2006.
“Ground-based GPS Imaging of Ionospheric Post-seismic Signal” by P. Lognonné, J. Artru, R. Garcia, F. Crespon, V. Ducic, E. Jeansou, G. Occhipinti, J. Helbert, G. Moreaux, and P.E. Godet in Planetary and Space Science, Vol. 54, No. 5, April 2006, pp. 528–540.
“Tsunamis Detection in the Ionosphere” by J. Artru, P. Lognonné, G. Occhipinti, F. Crespon, R. Garcia, E. Jeansou, and M. Murakami in Space Research Today, Vol. 163, 2005, pp. 23–27.
“On the Possible Detection of Tsunamis by a Monitoring of the Ionosphere” by W.R. Peltier and C.O. Hines in Journal of Geophysical Research, Vol. 81, No. 12, 1976, pp. 1995–2000.
“Unusual Topside Ionospheric Density Response to the November 2003 Superstorm” by E. Yizengaw, M.B. Moldwin, A. Komjathy, and A.J. Mannucci in Journal of Geophysical Research, Vol. 111, A02308, doi:10.1029/2005JA011433, 2006.
“Automated Daily Processing of More than 1000 Ground-based GPS Receivers for Studying Intense Ionospheric Storms” by A. Komjathy, L. Sparks, B.D. Wilson, and A.J. Mannucci in Radio Science, Vol. 40, RS6006, doi:10.1029/2005RS003279, 2005.
“Space Weather: Monitoring the Ionosphere with GPS” by A. Coster, J. Foster, and P. Erickson in GPS World, Vol. 14, No. 5, May 2003, pp. 42–49.
“GPS, the Ionosphere, and the Solar Maximum” by R.B. Langley in GPS World, Vol. 11, No. 7, July 2000, pp. 44–49.