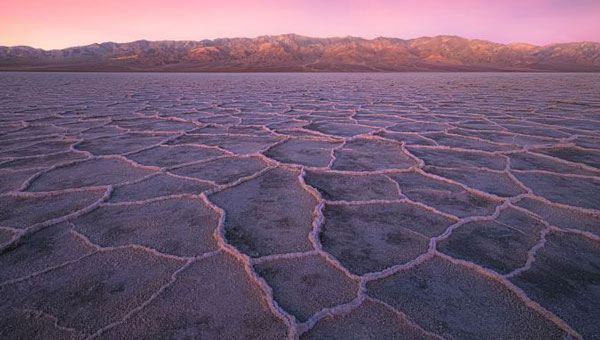
Landscape of Badwater Basin salt flats, with halite textures under a vibrant pink sky during sunset or sunrise at Death Valley National Park. (Photo: StephenBridger / iStock / Getty Images Plus / Getty Images)
The U.S. Geological Survey (USGS) has commissioned Woolpert to collect Quality Level 1 lidar data and conduct ground control surveys throughout Southern California in support of the 3D Elevation Program (3DEP) and The National Map.
Overseen by the USGS National Geospatial Program, 3DEP provides the nation’s first comprehensive, high-resolution topographic elevation data integrated into The National Map. The data will be accessible to local, state and national agencies to consider when making decisions that affect the immediate safety of life, property and the environment, as well as for long-term infrastructure planning.
Woolpert will collect roughly 60,000 km2 of aerial lidar data throughout Inyo County, California, including parts of the Mojave Desert and Death Valley National Park, using a Leica TerrainMapper. QL1 data are collected at eight points per square meter.
“Woolpert has had the honor of supporting USGS’ 3D Elevation Program since its launch nearly a decade ago,” said John Gerhard, Woolpert vice president and program director. “Critical decisions that depend on accurate and available elevation data are being made every day, and we are incredibly proud to continue our support for the U.S. Geological Survey and its commitment to completing the nation’s first-ever baseline of consistent high-resolution elevation data.”
Gerhard added that the data acquired for this project will also support the USGS 3D Hydrography Program (3DHP). The project is underway, and data is expected to be acquired by fall 2024.
The Japan Meteorological Agency (JMA) has reported that on July 10-17, data from GNSS signals indicated continuing minor inflation at shallow depths beneath Mount Ioyama, located on the northwest flank of the Karakuni-dake stratovolcano in the Kirishimayama volcano group in Japan.
Shallow volcanic earthquakes were recorded and vigorous fumarolic activity was visible at the fumarolic on the south side of Mount Ioyama. The alert level remained at two, on a five-level scale, and the public was warned to stay 1 km away from Mount Ioyama.
This JMA report was noted on July 18 in the Weekly Volcanic Activity Report, which is a cooperative project between the Smithsonian Institution’s Global Volcanism Program and the Volcano Hazards Program of the U.S. Geological Survey. The report is updated every Wednesday and averages 16 reported volcanoes.
The Hawaiian Volcano Observatory (HVO) of the U.S. Geological Survey has been working to rebuild its geodesic monitoring network after lava consumed several GNSS stations in 2018.
The work began following the 2018 Kīlauea lower East Rift Zone eruption and summit collapse, with funding from the Additional Supplemental Appropriations for Disaster Relief Act of 2019 (H.R. 2157).
Teams are rebuilding and improving HVO’s geodetic monitoring network to better detect, assess and respond to volcanic hazards related to Hawaiian volcanoes. The main geodetic datasets used by HVO scientists to measure surface deformation (ground movements) are GNSS, tilt and satellite radar (InSAR) imagery.
HVO’s geodetic network includes more than 70 GNSS stations and 15 tiltmeters on the Island of Hawai’i that continuously record and transmit data. These instruments require routine maintenance, must be upgraded periodically due to age, and must be replaced if destroyed by volcanic activity such as in 2018.
Network upgrades include replacing out-of-date instruments and improving HVO’s network of near real-time monitoring instruments at critical areas on Kīlauea’s summit and rift zones to support early detection of magma movement and associated hazards.
Lava takes out stations
In 2018, lava flows destroyed three GNSS stations in the lower East Rift Zone. Another three GNSS stations were destroyed in the caldera collapses at Kīlauea’s summit.
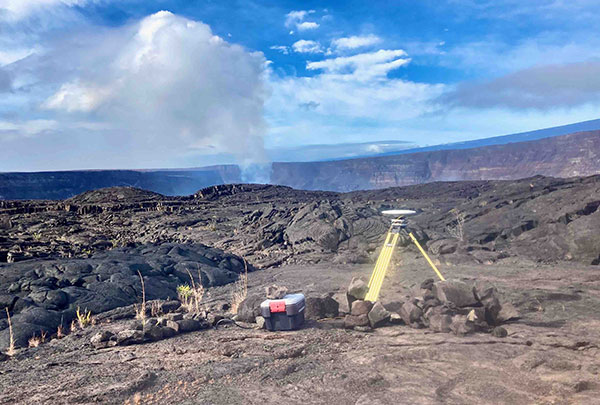
HVO staff rapidly deployed new GNSS stations at nearby locations to allow for continued monitoring during the eruption. These rapidly deployed sites included GNSS smart antennas mounted on surveys tripods — a setup typically only used for temporary deployments of several days to weeks.
Many of these rapidly deployed sites were decommissioned and removed after 2018. However, 13 of them are still being used for critical monitoring and remain on temporary tripods. These sites will be upgraded and hardened using engineered fixed monuments and masts. New sites will also be installed to replace sites destroyed in 2018.
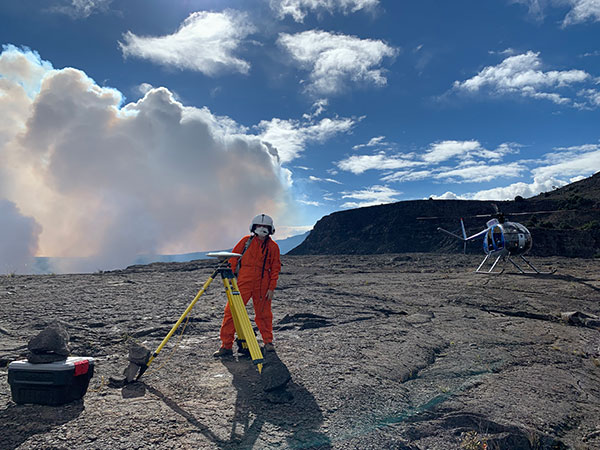
A temporary GNSS monitoring site in the Kīlauea caldera was part of the rapid response to the December 2020 Halema‘uma‘u eruption. The site will be upgraded into a continuously operating reference station with state-of-the-art instrumentation and a hardened antenna mast. (Photo: USGS/A.P Ellis)
Emergency monitoring ongoing
GNSS receivers acquired by supplemental funds already have supported emergency monitoring of active eruptions and other volcano-related activity. Data from these instruments help HVO detect volcanic activity and inform partners at Hawai’i Volcanoes National Park (HAVO), Hawai’i County Civil Defense (HCCD) and Hawai’i Emergency Management Agency (HI EMA).
For example, HVO rapidly deployed three new semi-continuous GNSS stations in response to the December 2020 Kīlauea eruption. These stations gave scientists a more complete view of magma returning to Kīlauea’s summit.
Similarly, HVO deployed rapid-response GNSS equipment at two pre-existing benchmarks during the Kīlauea south caldera intrusion event in August 2021, allowing scientists to track the migration of magma from the south caldera to farther south. New instruments give HVO a more detailed understanding of and ability to monitor Kīlauea’s volcanic processes.
HVO’s geodesy program plays a critical role in monitoring Hawaiian volcanoes. HVO’s updated geodetic network ensures that scientists can monitor changes in the shape of volcanoes, respond to eruptions, and understand magma storage and movement underground.
“Thanks to supplemental funding, HVO is in the best position ever to leverage our state-of-the-art geodetic network to gain insights into the active volcanoes in Hawai’i, assess their hazards, issue warnings, and advance scientific understanding to reduce the impacts of volcanic eruptions,” stated Volcano Watch, HVO’s weekly newsletter.
Beginning in September, GPS stations in Kilauea’s upper East Rift Zone observed increased rates of uplift, higher than they have been since the end of the eruption in 2018. According to the U.S. Geological Survey’s Hawaiian Volcano Observatory, earthquake rates increased in late November.
On Dec. 2, GPS stations and tiltmeters recorded a ground deformation quake at Kilauea’s summit accompanied by earthquake swarms.
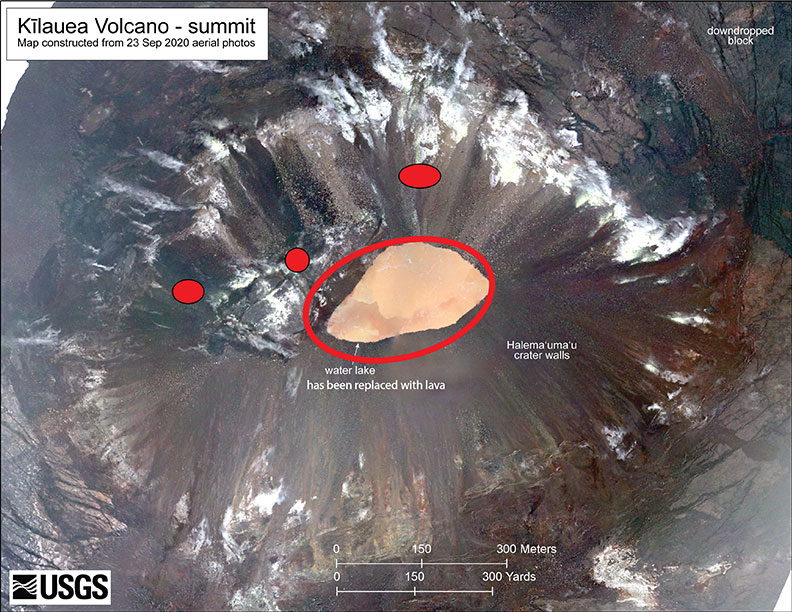
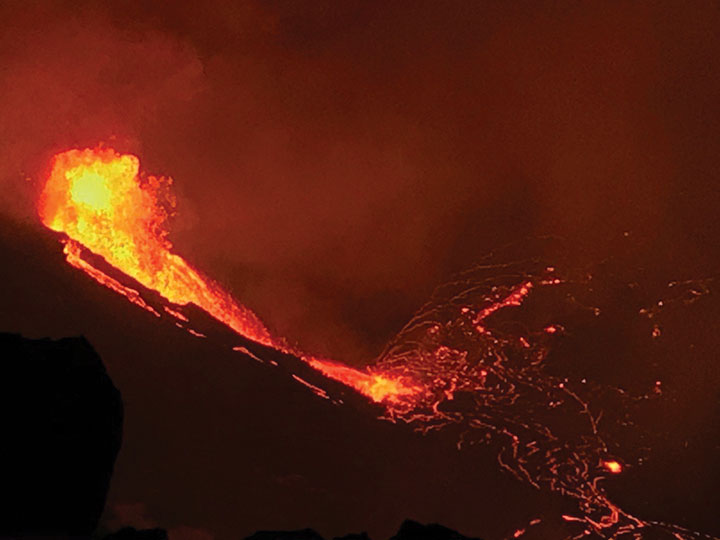
Then on Sunday, Dec. 20, a magnitude 4.4 earthquake struck on Kilauea’s south flank and three fissure vents broke open inside the caldera. Fountaining lava at these vents is estimated to be up to 82 feet high. The vents are feeding lava flows into the base of Halema‘uma‘u crater, which is being filled with lava. The lava lake has been rising several yards an hour since the eruption began at 9:36 p.m. Sunday. The eruption is currently confined to the crater.
According to the observatory, “The water lake at the summit of KIlauea has boiled away and an effusive eruption has commenced, with three vents in the wall of Halema‘uma‘u crater generating lava flows that are contributing to a growing lava lake at the base of the crater.”
As of Dec. 29, the summit eruption continued with the western vent active (the other vents have been covered by the lava lake). At 3:45 a.m. HST, field crews measured the lava lake as 179 meters (587 feet) deep, about 650 feet below the rim.
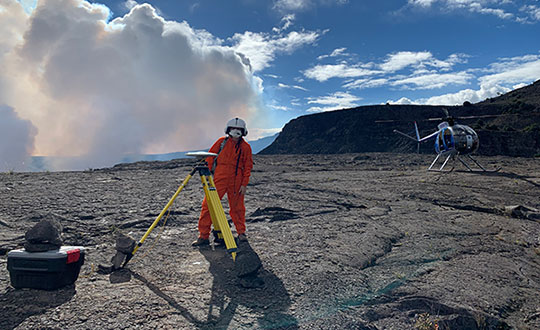
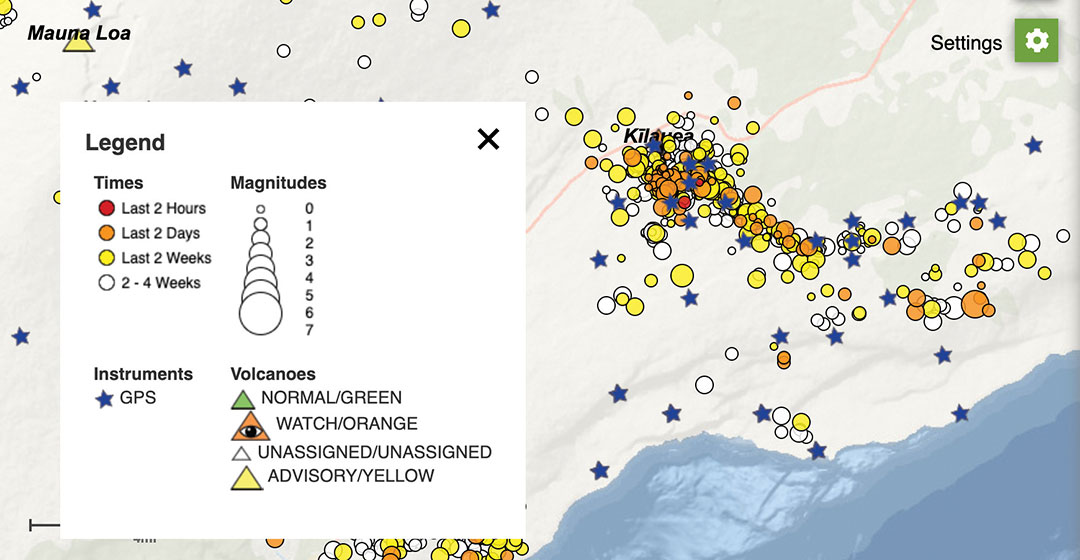
Shortly after 9:30 p.m. HST Dec. 20, an eruption began at the summit of Kīlauea Volcano in Hawaii. Red spots indicate fissure vents feeding lava into the bottom of Halema‘uma‘u crater. Lava coverage is 32 feet higher than the water in this photo (base map is from imagery collected on Sept. 23, 2020).The water lake at the base of Halema‘uma‘u crater has been replaced with a growing lava lake. View from the west rim of Kīlauea Caldera just before 5 a.m. HST on Dec. 21, 2020. A 59-foot fountain joins two other fissures to feed a growing lava lake at the base of Halema‘uma‘u crater. (Photo: USGS)The interactive USGS monitoring map shows GPS stations situated on and around Kilauea as well as volcano activity. (screenshot taken at 12 p.m. HST on Dec. 21).An HVO geophysicist deploys a GPS receiver on the Kilauea caldera floor to measure changes in ground motion. A volcanic gas plume rises in the background. GPS and tiltmeter data show contraction in the upper portion of the East Rift Zone (an area between Kīlauea’s summit and Pu‘u ‘Ō‘ō). (Photo: USGS)
Firm will provide geophysical surveying services across multiple states
Dewberry, a privately held professional services firm, has been awarded multiple task orders from the U.S. Geological Survey (USGS) under the Geospatial Products and Services Contract (GPSC) to perform airborne geophysical surveys in portions of Missouri, Illinois, Kentucky, Texas and New Mexico for the USGS Earth Mapping Resources Initiative (Earth MRI).
“Earth MRI is a play on words, as people are familiar with the use of magnetic resonance imaging (MRI) to image inside the human brain,” said Dewberry Project Manager David Maune. “Dewberry is excited to support USGS in its mission to assess critical minerals using airborne geophysical survey technology.”
Dewberry will perform very low-altitude magnetic and radiometric surveys from a fixed-wing aircraft and a helicopter with towed-array sensors to image subsurface geologic structures in search of undiscovered critical minerals and rare earth elements vital for the electronics industry.
These projects, which will be used to evaluate the potential for undiscovered critical mineral deposits contributing to an understanding of the major mineral systems for the two regions, are expected to be completed in early 2021.
ILMF is a technical conference and exhibition showcasing the latest airborne, terrestrial and underwater lidar, as well as emerging remote-sensing and data collection tools and technologies.
According to organizers, the show will allow attendees and exhibitors to connect with hundreds of professionals seeking lidar and other 3D geospatial data collection technologies to support asset management, civil infrastructure, coastal zone mapping, emergency services and disaster response, land and natural resource management, urban modeling and more. It will also cover the latest advances in lidar technology.
Keynote speakers at the event will include the U.S. Geological Survey’s Jeff Sloan, who will discuss if data from UAS sensors will overtake manned and satellite sources; Colorado State University’s Michael Lefsky, who will discuss reconstructing historic land use and forest structure using aerial photos and structure from motion analysis; and the NASA Jet Propulsion Laboratory’s Eric Larour, who will address a new tool from NASA for coastal planners.
ILMF will be co-located with the ASPRS Annual Conference. The combined event will feature a single exhibit hall. The two events will still have their own technical programs, and attendees will have the option to purchase a conference pass for programs of their choice or a universal pass for all offered programs.
The U.S. Geological Survey (USGS) has selected Dewberry, a privately held professional services firm, to collect and process Quality Level 1 topographic lidar data of Puerto Rico, including the islands of Culebra, Vieques and Isla de Mona; and the U.S. Virgin Islands of St. Croix, St. John and St. Thomas.
The new data will be used to identify the impact of Category 5 Hurricane Maria, which struck the territories in September 2017.
Digital elevation model of El Yunque National Forest produced from 2016 topographic lidar data. (Image: Dewberry)
The project will be completed under Dewberry’s Geospatial Product and Services Contract with USGS to support the agency’s 3D Elevation Program.
Dewberry has been performing mapping, mitigation planning and sea-level rise studies in Puerto Rico for more than 10 years, primarily serving the Federal Emergency Management Agency (FEMA).
In a similar effort, the firm recently collected and processed more than 3,400 square miles of topographic and bathymetric lidar data for USGS, the National Oceanic and Atmospheric Administration and the Commonwealth of Puerto Rico.
For that project, the data were collected prior to Hurricane Maria’s landfall, and the new data will be assessed in comparison to that dataset to evaluate the storm’s impact. Lidar data have not been collected for the U.S. Virgin Islands in more than 10 years.
Digital Elevation Model of the Guajataca Lake Dam produced from 2016 topographic lidar data. (Image: Dewberry)
The new lidar data will be collected, processed and delivered by the spring of 2019. Dewberry will perform all ground surveys and its geospatial team will complete the processing and creation of digital elevation models and other ancillary products. The firm’s subconsultant, Leading Edge Geomatics, will perform the data acquisition using two Riegl VQ1560i sensors.
“The pre-storm data we had collected and processed under our prior task order was instrumental in assisting FEMA, its partners and the local Puerto Rican government in planning and conducting its post-Maria disaster recovery work,” said Amar Nayegandhi, CP, CMS, GISP, vice president of geospatial and technology services for Dewberry. “The new data are being collected at a higher density to also support the infrastructure community and will show how the storm has altered the terrain.”
Lava inundation zones: In this USGS map, colors depict 3 of 18 lava Inundation zones for Mauna Loa. Yellow indicates the volcano’s Northeast Rift Zone, an area along which lava could erupt. The extent of the 1984 eruption and lava flow is superimposed on the map (red). (Map: USGS)
New U.S. Geological Survey (USGS) maps show areas that could be affected by Mauna Loa lava flows — information critical for response planning. Each zone identifies a segment of the volcano that could erupt lava and send flows downslope.
The volcano has erupted 33 times since 1843. Typically, eruptions began in the summit caldera, with a curtain of fire (a 1- to 2-kilometer line of lava fountains).
Using detailed geologic mapping and modeling of how a fluid (in this case, lava) responds to surface topography, the USGS Hawaiian Volcano Observatory constructed nine maps depicting 18 inundation zones on Mauna Loa, Hawaii.
Colored regions on these maps show areas on the volcano’s flank that could potentially be covered by flows from future Mauna Loa eruptions. These eruptions could originate from the volcano’s summit, rift zones or radial vents. It’s likely, however, that only part of a zone would be covered in a single eruption.
When a Mauna Loa eruption starts, the maps can help decision makers quickly identify communities, infrastructure and roads between possible vent locations and the coast, facilitating more efficient and effective allocation of response resources, the USGS said. The public can also use the maps to consider where lava flows might go once an eruption starts.
lava flow glow: Had the Mauna Loa inundation maps been available in April 1984, when the volcano last erupted, the maps could have been used to determine that the northern portion of Hilo was the most likely area to be impacted by the main lava flow. (Photo: David Little)
The U.S. Geological Survey (USGS) released six new sets of publicly available maps that show the diverse and complex range of seafloor habitats along 80 miles of the central California coast from the Monterey Peninsula north to Pigeon Point, according to a news release form the organization.
The new USGS publications, products of the California Seafloor Mapping Program, combine new and legacy data to reveal offshore bathymetry, habitats, geology and seafloor environments in high resolution. Environments range from the rugged granitic bedrock along the coasts of the Monterey Peninsula, to the bedrock reefs that form the surfing point breaks on the Santa Cruz County coast, to the smooth sand and mud in a large delta bar at the mouth of the Salinas River, and to the steep walls and sinuous channels of one of the largest underwater canyon systems in the world.
“The new high-resolution datasets and maps are stimulating research – scientists are excited,” said Sam Johnson, the USGS project lead. “Our stakeholders like to say that you can’t manage it, monitor it or model it if you don’t know what the ‘it’ is. Our seafloor mapping provides that important ‘it’ to the entire coastal community.”
Seamless onshore-offshore geologic maps incorporating subsurface data document the location and geometry of the San Gregorio fault and show how different strands of the fault extend through Carmel Canyon — across the continental shelf west of Santa Cruz and Davenport — and combine to uplift Año Nuevo State Park and Año Nuevo Island. A separate fault system to the east in Monterey Bay is part of an actively deforming wedge of the Earth’s crust caught between the converging San Andreas and San Gregorio faults, the organization said. The six new sets of California maps are Offshore of Pigeon Point, Offshore of Scott Creek, Offshore of Santa Cruz, Offshore of Aptos, Offshore of Monterey Canyon and Vicinity and Offshore of Monterey.
Each publication includes 10 map sheets, a pamphlet and a digital data catalog with web services. The web services are a new addition to the publications and all previous products in the map series, and can be viewed on smartphones. The USGS said the maps and data provide:
A foundation for assessing marine protected areas and habitats.
An understanding how marine species such as bull kelp, rockfish, crabs and sea otters use the seafloor.
Baselines for monitoring coastal change and sea-level-rise impacts.
Critical input data for modeling and mitigation of coastal flooding.
A framework for understanding coastal erosion and developing regional sediment management plans.
Contributions to earthquake and tsunami hazard assessments.
More accurate data for safer navigation.
Essential information for planning, siting or removing offshore infrastructure.
“These new seafloor maps – used in partnership with the USGS – will give us an additional tool to protect Californians, as well as fish and wildlife,” said John Laird, California’s secretary for natural resources and OPC chair. “The new maps will be used to analyze offshore faults and earthquake hazards. They will also help us identify sources of sand to replenish beaches – and will help establish a scientific baseline to track changes in habitat near shore over time. This investment will pay off for Californians in ways that we cannot even imagine now.”
The U.S. Geological Survey has made part of a huge national repository of geographically referenced USGS field photographs publicly available. USGS geographers developed a mapping portal called the Land Cover Trends Field Photo Map.
The entire collection contains more than 33,000 geo-referenced field photos with associated keywords describing the land-use and land-cover change processes taking place. Initially, nearly 13,000 photos from across the continental U.S. will be available to the public, yet the online collection will grow as more processed photos become available.
“This is a treasure trove of royalty and copyright-free photography collected using consistent procedures,” said Chris Soulard, project leader and USGS research geographer. “We envision that these photos will captivate general audiences and fulfill a myriad of scientific needs.”
Sharing these field photos provides a resource for the scientific community with potential to develop future research, such as future repeat photography projects or applications where photos may validate remote sensing classifications.
“The benefit of these photos being hosted by the USGS is equal access to all without copyright concerns and quality control,” said Jason Sherba, USGS geographer and project web developer.
The photography was collected as part the USGS National Land Cover Trends Project, a research effort that spanned over ten years and represented one of USGS’ largest cross-center research efforts. The project employed Landsat imagery between 1973-2000 to derive rates, causes and consequences of contemporary land-use and land-cover change. Photos were collected between 1999 and 2007.
The map viewer was developed to present photographs within a land use/land cover change mapping context, yet photos may also be found on the USGS Earth Explorer website.
The U.S. Geological Survey (USGS) has contracted with Woolpert to evaluate new lidar (light detection and ranging) technologies to assess the suitability to support the 3D Elevation Program (3DEP).
This use of the single photon and Geiger mode lidar for this evaluation is new to the commercial market, according to Woolpert Project Director John Gerhard.
“This technology provides the ability to fly at higher altitudes while acquiring data at an increased point density,” Gerhard said. “The USGS has asked us to provide an evaluation of this sensor technology in support of 3DEP.”
The USGS is developing the 3DEP initiative to respond to the growing need for high-quality topographic data nationwide, to address issues that include flood-risk management, precision agriculture, natural resource management, infrastructure management and hazard mitigation.
Woolpert — a national architecture, engineering and geospatial firm — will then evaluate the data, conduct an accuracy analysis, develop final data products and provide a comprehensive report to the USGS by the end of the year.