Techtree Innovation has launched AROUND, a high-precision, high-resolution 3D geospatial map platform designed to improve the quality and accuracy of existing 3D maps.
According to the company, AROUND is based on its existing 3D map generation and rendering technology. It offers four solutions for various industrial applications, such as urban or smart city planning, simulation, military and disaster management.
AROUND intends to provide high-precision, high-resolution 3D geospatial maps rendered with satellite maps, GIS data, 3D scanning using the photogrammetry software mapping (PSM) method, and high-end graphic production technology using the Unreal Engine, a 3D rendering platform.
The mapping platform aims to increase realism by implementing various visual geospatial information data — including terrain, buildings, vegetation, roads, transmission towers, traffic lights, signs and signboards, weather conditions, sunlight, coordinate data, elevation differences, and more from the real world. It is characterized by having accuracy and resolution within 5 cm and unifying all high and low altitude resolutions.
AROUND can be used for digital twins, smart city construction, autonomous driving, aviation, military training and education, disaster prediction, smart city or urban planning, review, architecture, design and more.
Image: Techtree
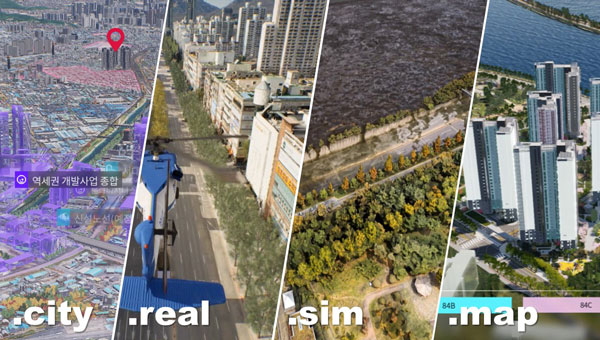
The platform offers four geospatial 3D map solutions tailored to users’ individual needs:
AROUND.city
AROUND.city is a solution that simulates the construction and development of urban areas or buildings. Through city simulation, 3D visualization, and data, AROUND.city can be used for analysis of various environments such as commercial, cultural, and residential facilities, and for space, environment, planning, design, and landscaping. The platform is designed to aid in the establishment and exploration of alternative plans, progress of development and evaluation in urban planning.
AROUND.real
AROUND.real provides high-quality 3D visualization mapping data with all collisions and blocks placed, which can be used in simulators of aircraft such as urban air mobility (UAM), helicopters, airplanes, autonomous cars, and various transportation means based on the development platform.
Using digital twins, AROUND.real allows for safe testing in risky real boarding and training areas. It also implements a variety of accurate and detailed visual-spatial information data, such as real terrain and buildings, grass, roads, utility poles, traffic lights, signs and signboards, weather conditions, and sunlight.
Around.sim
AROUND.sim visualizes refined data on various environmental factors such as building wind, flood, and population density in a specific area using the high-precision, real-world terrain and structures provided by the AROUND platform. Through this, users can predict problems about complex future situations in the same environment as reality, derive insights, or propose solutions.
AROUND.map
AROUND.map is a 3D real-estate marketing solution that already has commercialization achievements in the construction and allotment market. It visually represents the vision and buildings of the future that do not exist at the time of pre-sale, addressing the disadvantages of the existing pre-sale market, and implements all visual expressions such as virtual tours of all surrounding locations and pre-sale complexes, traffic, development plans, development benefits, view rights, and sunlight rights, just like reality.
Advances in geospatial technology have opened up many new possibilities in areas such as national security, urban planning and emergency preparedness. When I was embedded with the U.S. Army as a scientist in Afghanistan, I got to experience firsthand the exceptional value of 3D data. The military used nation-scale imagery and lidar to generate 3D maps that then informed their safety-critical operations. However, since lidar—like most three-dimensional unstructured data—contains incredible complexity and detail, it was painfully slow to analyze manually.
As a result, the impact of this technology was severely restricted by speed and cost due to the significant manual effort required to extract actionable insights. As we looked to the future, where lidar would become commonplace in consumer electronics and automobiles, it became clear that there was an opportunity to combine computer vision/AI with large-scale cloud computing to rapidly and automatically generate actionable insights from 3D data.
Screenshot: Enview
After returning from Afghanistan, I reconnected with Krassimir Piperkov, a former colleague from ICON Aircraft, and fellow Stanford alum, to launch Enview. Our objective was to automate 3D geospatial analytics and create a living 3D model of the world to help organizations to protect their critical infrastructure and communities.
Powering geospatial data with AI can take the limits off 3D data analytics, prevent threats from becoming incidents, and protect critical infrastructure. What used to take days or months to process can now be done in minutes, enabling analysts, operators, and decision-makers across the public sector to make timely and accurate decisions. By enhancing our understanding of the physical world, this technology empowers us to tackle pressing challenges like wildfire prevention, humanitarian assistance, disaster response, and more.
Let’s take a look at how AI-powered 3D modeling is being put to use.
Digital twins
A living 3D model of the world, or a digital twin, can be used for many purposes. Enview’s software fuses many different data sets together to create digital twins that are global in scale but have high-resolution to enable local decision-making. These digital twins include 3D terrain, vegetation, buildings, and infrastructure such as power lines, roads, and water works. Enview also fuses real-time and forecasted conditions, such as wind, temperature, humidity, traffic, and IoT (internet of things).
This sort of rich representation of the physical world is an incredibly complex big data challenge. Data comes from radically different sensor modalities, with different resolutions, formats, time-domains, and accuracy. AI plays a critical role in automating the fusion of these datasets, by helping to intelligently align and then fuse them into a cohesive entity. 3D geospatial data is particularly challenging, as it is unstructured data, which requires a new generation of deep learning frameworks whose convolutional kernels are specifically developed from the ground up to work on unstructured data. Further, the datasets are massive in scale. A square-mile of 3D lidar data can have hundreds of millions of points; the magnitude of the data easily passes the petabyte scale when one considers applications that span nation-scale areas. In order to process this volume of data, modern geospatial AI architectures must be containerized and dynamically deployable across cloud compute resources to generate timely insights.
AI is essential to help human experts to extract meaningful insight from this overabundance of data. The application of automated workflows allows experts to look at larger areas, with more speed and higher frequencies. This machine-assisted cognition draws upon the respective strengths of people and computers to do what neither could do on their own.
Humanitarian aid and disaster relief
3D models can be built to monitor hurricane hotspots, such as the Gulf Coast, before major storms strike. By layering in real-time weather information such as rainfall, winds, and flooding, these models can help with planning, emergency response, and relief efforts.
This data also provides life-saving insight that can assess damage to buildings, transportation, and downed power lines, in addition to determining where to send medical and relief supplies, and how to best get them there. 3D data can help to lessen the impact of future weather events by updating the baseline understanding of how storms impact coastal communities so they can plan for the future.
Screenshot: Enview
Infrastructure protection
Inadequate clearances between vegetation and power lines can result in wildfires and unplanned power outages. Many federal, state, and local regulations are in place to mandate clearances, and power line operators monitor their networks continuously to ensure that they abide by these regulations and prevent incidents and outages. However, doing so by walking or flying the lines and judging distances with the human eye is challenging and inaccurate.
The ability to identify the exact location and clearances of high-risk vegetation early, and at scale, lets operators identify, prioritize, and address problem areas proactively. Lidar-driven programs have helped with risk-reduction, but are constrained by the massive levels of manual data manipulation required to derive insights from this 3D data. The automation of 3D geospatial analytics through AI, machine vision, and parallel computing enables the accurate and rapid identification of at-risk areas, protecting critical infrastructure and communities.
Screenshot: Enview
Fighting wildfires
Devastating wildfires resulting in the loss of life and property have become commonplace in the western U.S. and other parts of the world. The tools and methods previously relied on to keep communities and infrastructure safe are now struggling to keep up with this increased threat.
Geospatial information, including 3D data, provides a digital view of the physical world and, when paired with AI, gives stakeholders the informational edge they need to minimize wildfire damage, injuries, and deaths. This technology can be used to automatically build and update real-time, high-resolution wildfire risk maps that give firefighters and communities more notice when threats are imminent, and provide firefighters with real-time situational awareness when they’re fighting the blazes.
Change detection
According to the Pipeline and Hazardous Materials Safety Administration (PHSMA), third-party excavations are one of the leading causes of pipeline incidents in the U.S. These incidents can lead to service disruptions, expensive repairs, and sometimes serious injuries or deaths.
Detecting signs of excavation or earth movement via aerial patrolling is challenging and costly, while resource limitations make it difficult for pipeline operators to continuously monitor remote areas such as farms. AI-powered 3D maps can be used to monitor topography and accurately detect changes that threaten pipelines in real time.
3D data provides remarkable value when it comes to decision-making as it relates to many different applications—from military defense to protecting neighborhoods from wildfires. However, its success hinges on one thing: speed. The ability to process 3D geospatial data rapidly, and at scale, is made possible through advances in AI and cloud computing. In the future, we can expect to see more exciting and innovative use cases for AI-powered geospatial technology.
San Gunawardana is co-founder and CEO of Enview, a geospatial analytics company. After finishing a Ph.D. in aerospace engineering at Stanford, Gunawardana went to Afghanistan, where he combined data analytics and remote sensing to detect threats and prevent incidents. He is excited to apply those insights to help the energy sector solve problems. He has done computer vision at NASA, built imaging satellites with the Air Force, and was an early employee at ICON Aircraft.
GIS is growing in importance to urban development, whether for environmental impact studies, geofencing or building information modeling (BIM). Sharing GIS data with developers is critical to a coordinated approach to smart city growth.
By Christine Easterfield, Principal Analyst, Cambashi
Just over half the world’s 7 billion population lives in cities. In Europe, this rises to three quarters, and 30 cities worldwide have populations of more than 10 million — the majority in India, China and South America.
This trend will continue. It is projected that the global population will reach almost 10 billion by 2050, which means cities will need to cope with increasing demands on housing, transport and communications.
Growing urban populations place considerable stress on housing stock. Cities need to provide scope to build new, but also to look at best use of existing properties.
In the growing urban population, there will always be a proportion that needs more support as employment rates shift and wages do not always keep up with city expenses. Social housing projects need to keep pace, and making the most of city resources opens opportunities for smart buildings.
The role of GIS
Proposed Indianapolis zoning map. (Image: City of Indianapolis)
Coordinating new build and refurbishment plans across a city requires planning and organization, and a set of tools to support planners and designers. The layout of city-planning zones is the starting point for many new developments — sharing data about these areas is typically achieved using a GIS (geographic information system).
The standard city map with records of roads, emergency routes, bike routes, key buildings, new development zones, existing housing stock, utility services and street lighting are a central resource for most cities.
Sharing data between these city maps and developers’ plans is critical to a coordinated approach to city growth.
Environmental impact
The early stages for many developments involve an environmental impact study. How will the new development fit into the existing landscape? What restrictions are imposed because of the conditions of the site or the current demands on local resources? What options are there for addressing these constraints?
This last point is important for acceptance of the development. Being able to show a level of flexibility to accommodate local concerns and developers’ challenges will build a cooperative relationship. The ability to easily integrate building plans with the city map means that confidence is quickly built into the new plans.
Combining the geography of the city view with the building model destined for development provides a perfect foundation for an integrated GIS/BIM model to take the development from drawing board to handover.
Maintaining a digital twin of a development, in the form of a BIM, provides a rich source of information about the as-built building — exact measurements, materials used, changes from the original design and more. Integrating this with the city maps held in GIS means a continuous dataset can be formed.
Tools for construction site inspection and reporting
Photo: Alen Ajan/Fotolia.com
Developing building information models (BIMs) requires monitoring the build activity and accurate recording of the construction. The best way to do this is as it happens.
Simple-to-use tools that are robust enough to cope with a construction site are becoming more available from software providers. These support gathering data by construction teams and contractors as the work is completed.
As well as recording data, these tools are also useful in registering the progress and completion of tasks. Many enable interaction with central systems that can send changes and updates directly to the site for immediate action.
The same tools can register the location of the user, enabling safer working practices to be enforced.
The practice of geofencing to monitor or even restrict access to parts of a construction site, by registering the location of a device against a predefined region on a map of the site, can track critical activities and react with the most appropriate action if an incident is reported.
Remote site inspection and reporting
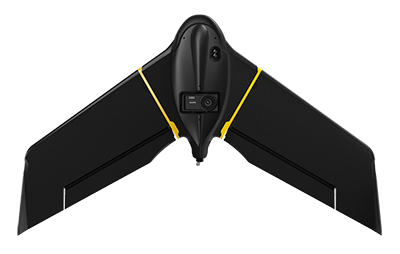
The Aeryon SkyRanger. (Photo: Aeryon Labs)
The safest inspections don’t involve human intervention at all. Sending an unmanned aerial vehicle, UAV or drone, to fly over your site removes risk to staff when viewing hazardous environments.
Photographic imagery collected by drone can be loaded into GIS tools and accurately registered against the map of the area to provide a seamless view of the site.
Data integration is key
The range of data that can be accurately gathered and viewed together now covers original 3D designs, 2D construction plans, inspection photo-imagery and as-built updates.
Integration of BIM and GIS tools means that these different data types can be viewed together and in the same spatial context.
Support for building operation, management and maintenance in the wider context of a smart city
On-the-spot data capture of accurate as-built building information models that can seamlessly integrate with existing city plans leads to a data resource that cities can build on to improve safety, security and facilities for their citizens.
So what should the smart city planner be looking for?
Existing geospatial and data management tools already address many of these challenges, and when an opportunity for a technology refresh is presented, the approach to smart city support should be a big part of the mix.
Christine Easterfield
Christine Easterfield is principal analyst for Cambashi. She has more than 20 years’ experience in the software business. Her experience has covered geospatial asset management for the utility industry: assessing market needs and opportunities, managing customer requirements, liaising with development teams and running global product introduction programs.
Previous roles include programming, training, consultancy and product marketing management.
She has worked for a range of companies from multinationals to small start-ups, resulting in an understanding of how different sized organisations operate, grow and manage change. Christine has a BSc in Computational Sciences and an MA in English Literature.
SenseFly, provider of fixed-wing drones, has launched the eBee X for mapping.
The eBee X, part of the Parrot Business Solutions portfolio, is designed to boost the quality, efficiency and safety of an operator’s geospatial data collection.
The eBee X. (Photo: senseFly)
It offers a camera to suit every job, the accuracy and coverage capabilities to meet the requirements of demanding projects, and is durable enough to work virtually every site, the company said.
“The eBee X is a giant leap forward for mapping technology and underscores senseFly’s position as the leader in the fixed-wing drone market,” said Gilles Labossière, executive vice president and COO of Parrot Group and senseFly CEO. “No matter what type of project a professional is undertaking, the eBee X has the coverage, data and accuracy capabilities needed to get the job done.”
The eBee X includes a range of cameras for jobs ranging from land surveying and topographic mapping to urban planning, crop mapping, thermal mapping, environmental monitoring and more. Cameras include:
The senseFly S.O.D.A. 3D: a unique drone photogrammetry camera with a one-inch sensor, which changes orientation during flight to capture three images (two oblique, one nadir) every time, instead of just one, for a much wider field of view. The result is stunning digital 3D reconstructions in vertically-focused environments—such as urban areas, open pit mines and coastlines—over larger areas than quadcopter drones can achieve. senseFly S.O.D.A. 3D is optimised for quick, robust image processing with Pix4Dmapper software.
The senseFly Aeria X: a compact drone photogrammetry camera with APS-C sensor. This rugged innovation offers an ideal blend of size, weight and DSLR-like image quality. Thanks in part to its built-in Smart Exposure technology, it provides outstanding image detail and clarity, in virtually all light conditions, allowing operators to map for more hours per day than ever before.
The senseFly Duet T: a dual-camera thermal mapping rig, which lets mapping professionals create geo-accurate thermal maps and digital surface models quickly and easily. The Duet T includes both a high-resolution (640 x 512 px) thermal infrared camera and a senseFly S.O.D.A. RGB camera with one-inch sensor. Both image sources can be accessed as required, while the rig’s built-in Camera Position Synchronisation feature works in sync with Pix4Dmapper photogrammetry software (optional) to simplify the map reconstruction process.
The eBee X is also compatible with the Parrot Sequoia+ multispectral camera for agriculture, the senseFly S.O.D.A. drone photogrammetry camera and senseFly Corridor for simple linear mapping.
The eBee X can meet the exacting requirements of every project. Its unique Endurance Extension option unlocks a flight time of up to 90 minutes (versus a maximum endurance of 59 minutes by default).
With this capability activated, the drone is able to achieve vast single-flight coverage of up to 500 hectares (1,235 acres) at 122 meters (400 feet), while the eBee X’s built-in High-Precision on Demand (RTK/PPK) function helps operators to achieve absolute accuracy of down to 3 centimeters (1.2 inch) — without ground control points.
According to senseFly, the eBee X allows users to work virtually every site, no matter how demanding, thanks to the drone’s built-in Steep Landing technology, ultra-robust design, live air traffic data and more, all backed by senseFly’s professional, localized support.
The eBee X is ideally suited to the varied and evolving needs of mapping professionals. These include: surveying and construction companies, quarry and mine operators, agronomists and forestry engineers, professional drone service providers, aerial imagery companies, environmental researchers and more, the company added.
The eBee X is supplied with senseFly’s eMotion flight planning and data management software.
The report also provides suggestions for how local governments can craft their own drone ordinances to encourage innovation while also protecting their cities.
In 2015, world sales of drones hit 4.3 million. Cities are using drones in a variety of ways, including for law enforcement and firefighting, as rural ambulances, and for inspections, environmental monitoring and disaster management. Commercial uses include precision farming, aerial photography, and — in the near future — package delivery.
“This report serves as a primer on drones for local officials,” said National League of Cities (NLC) CEO and Executive Director Clarence E. Anthony. “Whether they are revolutionizing search and rescue capabilities or helping realtors show off their homes, drones are lowering the cost and increasing the reach of airborne services. As our skies are becoming more crowded, cities must be able to decide how and when they want to see drones used in their communities.”
According to NLC, city officials must tackle three spheres of drone activity: private use, public use and commercial use. “To protect communities, promote innovation and avoid preemptive regulatory action, cities should focus on the following issues when enacting a drone related ordinance: using land use and zoning powers to designate when and where drones may take off, land and operate, as well as any operational limitations or criteria; creating an ordinance that punishes operators for operating an unmanned aircraft in a manner that recklessly endangers persons or property while considering appropriate enforcement infrastructure.”
The National League of Cities (NLC) is dedicated to helping city leaders build better communities. NLC is a resource and advocate for 19,000 cities, towns and villages, representing more than 218 million Americans. www.nlc.org
Cityworks has released Cityworks 15.1, making the care of critical infrastructure, capital assets and property easier and more straightforward.
Cityworks 15.1—Platform 4.1 introduces Cityworks “apps” — functional applications that run parallel to the platform, providing faster updates for fixes and new functionality.
Cityworks 15.1—Platform 4.1 includes updates to Cityworks AMS and PLL, Web Services (APIs) and Storeroom, as well as the release of the Cityworks apps. As part of the enhancements to the core functionality, Cityworks AMS now provides more robust options and methodology for inspection data as well as a new design for comments to support extended functionality, formatting and preferences for end users.
GIS-centric functionality has also been furthered to support population of GIS data across fields on service requests, work orders and inspections.
New functions related to Respond 1.1 include a standardized layout and design for ease of use and responsiveness across multiple devices. This version improves upon the initial release of Respond and provides a superior UI and design, as well as added functionality. The extended functionality allows users to create and edit work orders and inspections, and to edit service requests.
“We’re really excited that the new model of Cityworks apps will allow us to more efficiently and effectively provide improvements to our clients,” said Becky Tamashasky, executive director of product roadmap. “With this change, individual apps are able to be upgraded on a release cycle independent of the platform. This important improvement allows Cityworks to be more effective as we constantly work to upgrade the existing suite of products and provide expanded functionality as our users’ needs continue to grow and evolve.”
CyberCity 3D has developed a 3D Smart Cities mapping platform to help municipal authorities and planners visualize their towns and cities in 3D. Existing and future city plans, proposed developments and schemes, can all be visualized together with relevant data using a simple, out-of-the-box solution, with streaming to any web connected device.
The CyberCity 3D Smart City maps can be used for a host of applications including planning, transport, environment and tourism. The models are fully interoperable and will perform on most proprietary software applications such as GIS and 3D design packages and can be streamed via the web. The live streaming uses Cesium open architecture, a cross-platform virtual globe designed for dynamic-data visualization, allowing the 3D models to be viewed on tablets, phones, desktops and laptops.
CyberCity 3D employs patented 3D modeling process to generate high resolution building models from stereo imagery. The smart buildings automatically contain valuable measurement data, such as height and roof slope, with up to 12.5 cm accuracy. Cities across the world have employed CyberCity 3D technology to support work such as urban planning, economic development, flood risk assessment, transportation planning and line-of-sight studies.
In the UK, CyberCity 3D has teamed up with aerial mapping company Bluesky, which provides a huge data library covering 150,000 sq km of digital aerial photography, allowing CyberCity 3D to gain access to urban centers across the UK for 3D modeling. CyberCity 3D also has access to Bluesky’s National Tree Map, a digital map detailing more than 300 million trees across the UK, which adds a useful dimension to the 3D Smart City projects, the company said.
CyberCity 3D has a large smart 3D GIS building library, covering more than 80 cities around the world. Applications include master planning and proposed construction maps, stakeholder, management, engagement and communication, flood analysis visualization, leisure and tourism. CyberCity 3D data is also used in applications such as 3D gaming and augmented reality.
Trimble has launched its Trimble VRS Now correction service in New Mexico. The commercial subscription service provides surveyors, civil engineers and geospatial professionals in the region with instant access to real-time kinematic (RTK) GNSS corrections without the need for a base station.
Using both the GPS and GLONASS constellations, the Trimble service delivers centimeter-level RTK corrections customized for each GNSS receiver’s location anywhere in the network via cellular communications. The Trimble VRS Now service supplies accurate, reliable and easy-to-use GNSS positioning for a variety of applications including surveying, urban planning, urban and rural construction, environmental monitoring, resource and territory management, disaster prevention and relief and scientific research, Trimble said.
“As we continue to expand our VRS Now network infrastructure throughout the U.S., users in New Mexico now have increased reliability from both GPS and GLONASS corrections to enhance their work,” said Lisa Wetherbee, business area director of Trimble’s Positioning Services Division. “Our suite of correction services offers a variety of performance options, designed to meet the different requirements and budgets of our customers. VRS Now in New Mexico delivers centimeter-level accuracy to a wide range of industry professionals.”
Service in New Mexico is a continuation of Trimble’s focus on providing solutions that enable customers to increase productivity by simplifying access to high-precision positioning around the world. Similar VRS Now services are operating in Illinois, Indiana, Iowa, Nebraska, Colorado, Florida, Alabama, Mississippi, Texas, Oregon and parts of Europe and Australia.
Modern layer management and enhanced real-time shadows based on daytime and location are available in the latest release of CityEngine.
The release of Esri CityEngine 2015 allows GIS professionals, architects, planners, and urban designers to create 3D city models faster and share them easily via ArcGIS Online. These new features open the use of 3D models for every day, real-world simulation, emergency response, urban planning, and entertainment scenarios.
“CityEngine 2015 is faster, sports higher-quality visuals, and introduces an innovative and unique 3D design experience. The latter is possible with Procedural Handles, a novel user interface for the intuitive editing of 3D models. We worked very hard on this and are excited to release it,” said Pascal Mueller, director of the Esri R&D Center, Zurich AG.
Companies like Esri partner SmarterBetterCities use CityEngine to help clients view and investigate building development proposals in a true 3D environment.
“CityEngine provides decision makers with the opportunity to do more advanced planning than when they are using a typical CAD or spreadsheet system,” said Antje Kunze, CEO, SmarterBetterCities. “We are now able to help our clients better visualize rules and regulations and perform analytics that no one has been able to address in the past.”
Advancements from user requests—including a modern editor for managing layers, real-time shadows based on daytime and location, faster data export, and improved publishing workflows—have been implemented. More information can be found in the release notes.
“With CityEngine 2015, we made a huge step forward in user experience and speed, resulting in less coding and more designing,” said Dominik Tarolli, director of international business development for 3D geodesign at Esri.
CityEngine 2015 is available for Windows, Mac, and Linux platforms. A free 30-day trial with full export capabilities can be downloaded at esri.com/cityengine.
A city hall built in Minecraft. (Photo: Wikimedia Commons)
Safe Software is offering a webinar that discusses how the popular building game Minecraft offers a gaming approach to real-world geospatial scenarios. The presenters will discuss examples such as rapid design prototyping to increasing citizen and youth engagement, and helping urban planners create the perfect city block.
The presenters say they also will show attendees how they can integrate GIS, CAD, and BIM data sources with Minecraft in an automated way.