Tag: USGS Hawaiian Volcano Observatory

  • USGS upgrading Hawaiian geodetic network to monitor volcanoes

    USGS upgrading Hawaiian geodetic network to monitor volcanoes

    The Hawaiian Volcano Observatory (HVO) of the U.S. Geological Survey has been working to rebuild its geodesic monitoring network after lava consumed several GNSS stations in 2018.

    The work began following the 2018 Kīlauea lower East Rift Zone eruption and summit collapse, with funding from the Additional Supplemental Appropriations for Disaster Relief Act of 2019 (H.R. 2157).

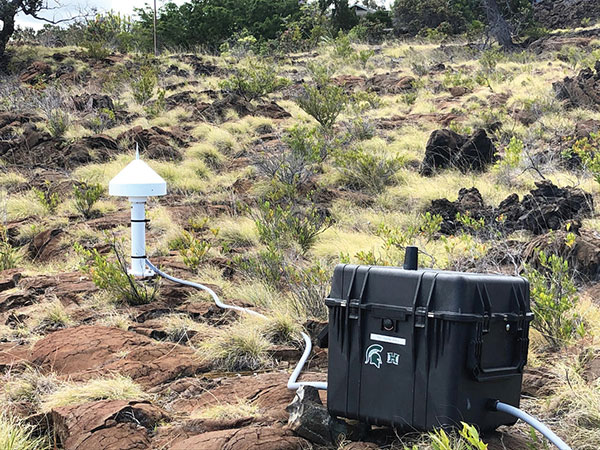
    Teams are rebuilding and improving HVO’s geodetic monitoring network to better detect, assess and respond to volcanic hazards related to Hawaiian volcanoes. The main geodetic datasets used by HVO scientists to measure surface deformation (ground movements) are GNSS, tilt and satellite radar (InSAR) imagery.

    HVO’s geodetic network includes more than 70 GNSS stations and 15 tiltmeters on the Island of Hawai’i that continuously record and transmit data. These instruments require routine maintenance, must be upgraded periodically due to age, and must be replaced if destroyed by volcanic activity such as in 2018.

    Network upgrades include replacing out-of-date instruments and improving HVO’s network of near real-time monitoring instruments at critical areas on Kīlauea’s summit and rift zones to support early detection of magma movement and associated hazards.

    Lava takes out stations

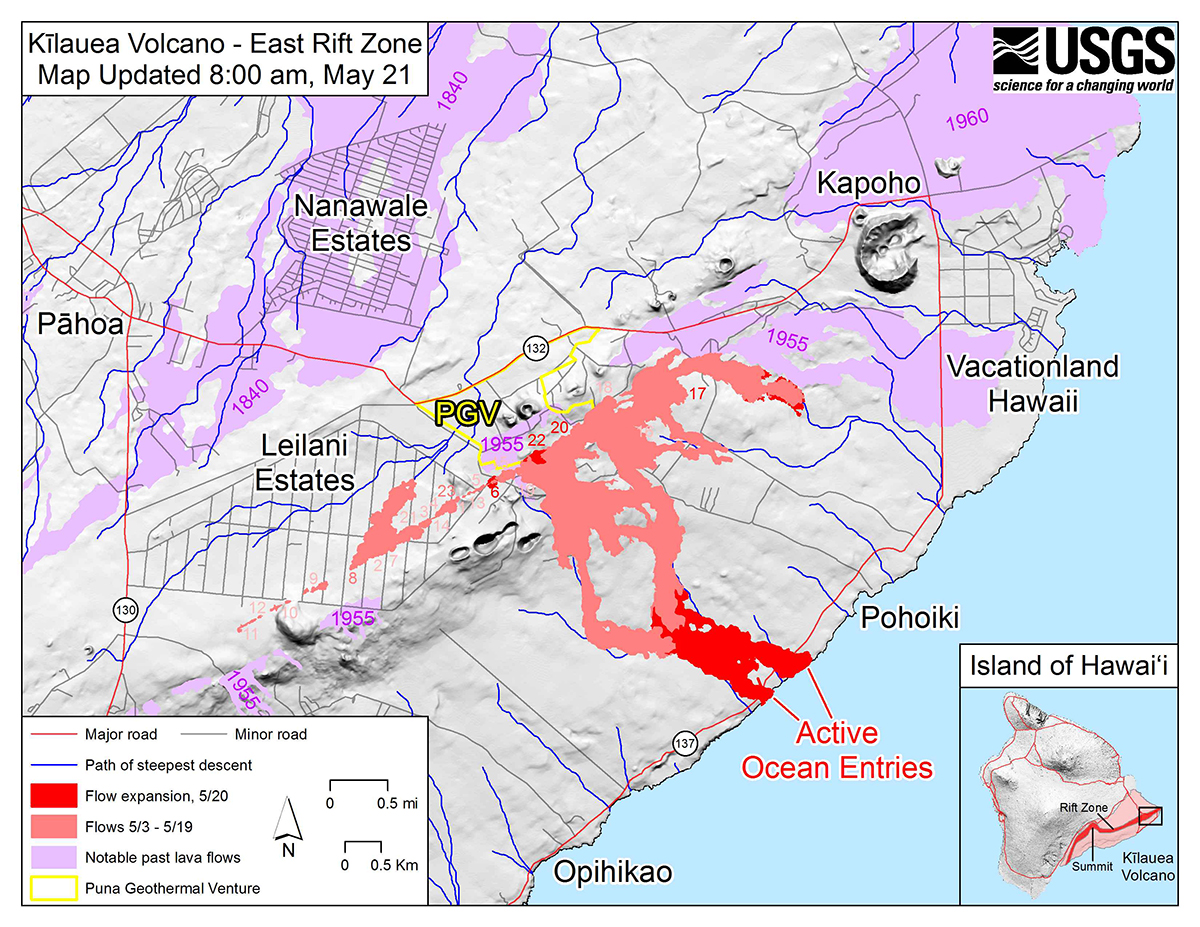
    In 2018, lava flows destroyed three GNSS stations in the lower East Rift Zone. Another three GNSS stations were destroyed in the caldera collapses at Kīlauea’s summit.

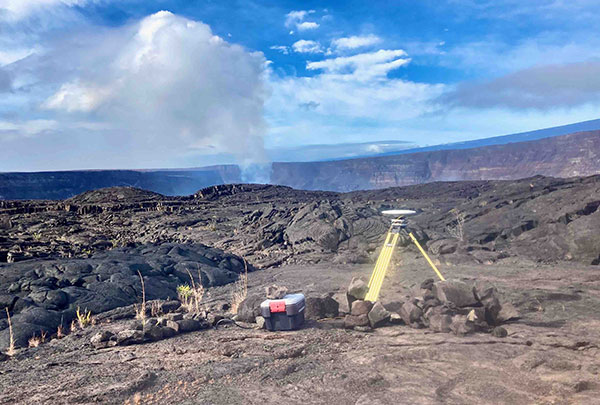
    HVO staff rapidly deployed new GNSS stations at nearby locations to allow for continued monitoring during the eruption. These rapidly deployed sites included GNSS smart antennas mounted on surveys tripods — a setup typically only used for temporary deployments of several days to weeks.

    Many of these rapidly deployed sites were decommissioned and removed after 2018. However, 13 of them are still being used for critical monitoring and remain on temporary tripods. These sites will be upgraded and hardened using engineered fixed monuments and masts. New sites will also be installed to replace sites destroyed in 2018.

    A temporary GNSS monitoring site in the Kīlauea caldera was part of the rapid response to the December 2020 Halema‘uma‘u eruption. The site will be upgraded into a continuously operating reference station with state-of-the-art instrumentation and a hardened antenna mast. (Photo: USGS/A.P Ellis)
    A temporary GNSS monitoring site in the Kīlauea caldera was part of the rapid response to the December 2020 Halema‘uma‘u eruption. The site will be upgraded into a continuously operating reference station with state-of-the-art instrumentation and a hardened antenna mast. (Photo: USGS/A.P Ellis)

    Emergency monitoring ongoing

    GNSS receivers acquired by supplemental funds already have supported emergency monitoring of active eruptions and other volcano-related activity. Data from these instruments help HVO detect volcanic activity and inform partners at Hawai’i Volcanoes National Park (HAVO), Hawai’i County Civil Defense (HCCD) and Hawai’i Emergency Management Agency (HI EMA).

    For example, HVO rapidly deployed three new semi-continuous GNSS stations in response to the December 2020 Kīlauea eruption. These stations gave scientists a more complete view of magma returning to Kīlauea’s summit.

    Similarly, HVO deployed rapid-response GNSS equipment at two pre-existing benchmarks during the Kīlauea south caldera intrusion event in August 2021, allowing scientists to track the migration of magma from the south caldera to farther south. New instruments give HVO a more detailed understanding of and ability to monitor Kīlauea’s volcanic processes.

    HVO’s geodesy program plays a critical role in monitoring Hawaiian volcanoes. HVO’s updated geodetic network ensures that scientists can monitor changes in the shape of volcanoes, respond to eruptions, and understand magma storage and movement underground.

    “Thanks to supplemental funding, HVO is in the best position ever to leverage our state-of-the-art geodetic network to gain insights into the active volcanoes in Hawai’i, assess their hazards, issue warnings, and advance scientific understanding to reduce the impacts of volcanic eruptions,” stated Volcano Watch, HVO’s weekly newsletter.

  • Seen & Heard: Illegal coffee farms, Nikon camera upgrade

    Seen & Heard: Illegal coffee farms, Nikon camera upgrade

    “Seen & Heard” is a monthly feature of GPS World magazine, traveling the world to capture interesting and unusual news stories involving the GNSS/PNT industry.


    Screenshot: Global News video
    Screenshot: Global News video

    Our Spinning Globe

    A highlight of the opening ceremony at the Tokyo 2021 Olympics was a revolving globe above the Olympic stadium. The 1,824 Intel Shooting Star 3 drones formed a complex set of geometrical shapes before transitioning into the games’ emblem, and then a 3D representation of Earth. The Intel Shooting Star 3 drones are designed for entertainment purposes. Each drone weighs 340 grams, is equipped with four extremely bright LEDs, and features real-time kinematic (RTK) GPS for the increased positional accuracy needed for high-resolution animations, sharp imagery and dynamic 3D animations.


    Photo: slowmotiongli/iStock/Getty Images Plus/Getty Images
    Photo: slowmotiongli/iStock/Getty Images Plus/Getty Images

    Coffee Buzz

    Illegal coffee plantations have appeared inside Bukit Barisan Selatan National Park in Indonesia, a key habitat for the endangered Sumatran tiger and other species. Conservationist Matt Leggett noticed in satellite images the declining size of the forest, and sent a team of researchers on an undercover operation on dirt bikes with cameras and GPS receivers, reports the Aug. 11 New York Times Magazine. Leggett’s team mapped hundreds of small coffee farms and investigated the complex chain of custody, which ends with major brand names. No solution has been found, though some farmers have promised to replant the forest over the next 15 years, while others continue to clear park land.


    Hawaiian GPS station. (Photo: USGS/Jeff Freymueller)
    Hawaiian GPS station. (Photo: USGS/Jeff Freymueller)

    Now that’s heavy

    Seven scientific-grade GPS stations are joining a network of 65 that the USGS Hawaiian Volcano Observatory operates on the Hawaiian Islands. As Hawaiian volcanoes erupt and grow, they add weight to the Earth’s surface, causing the Pacific Plate to flex downward and possibly causing the shelf to splinter. Earthquakes this spring in Hawaii likely were related to weight on the underlying crust and mantle from eruptions. Collecting years of data from these stations should help scientists better understand motions of the Pacific Plate, according to researcher Jeff Freymueller, Michigan State University. The first three GPS stations were installed in May; others are being installed this summer.


    Photo: Zephyr18/iStock/Getty Images Plus/Getty Images
    Photo: Zephyr18/iStock/Getty Images Plus/Getty Images

    Camera Upgrade

    Nikon could be launching a consumer camera equipped with GNSS instead of only GPS, providing a major upgrade for the geolocation coordinates provided with photo metadata. Filings with the governments of Russia and Indonesia describe a camera dubbed N2014, which will be equipped with GNSS as well as Wi-Fi and Bluetooth. A number of Nikon CoolPix digital cameras have built-in GPS, while other cameras — Nikon D-SLRs and select Nikon 1 — can use optional accessory GPS devices.

  • Volcanic GIS: Mapping and imaging the Kilauea eruption

    A number of geospatial companies played a key role in the government’s response to the Kilauea Volcano eruption. The volcano on the Big Island of Hawaii began erupting May 3, and while quiet for more than a week, it could resume erupting at any time.

    Mapping the flow. As a resident of Hawaii, Brennan O’Neill, Hawaiian branch manager of Frontier Precision, was in a unique position to offer support. Frontier Precision provided free access to technology and expertise to assist in mapping the lava flow.

    “I had to help out,” O’Neill said. “It was tearing at my soul. For a geologist, it’s even more powerful than that. The lava flow is like a living mass that has a mind of its own, creeping, glowing — an upside-down conveyor belt surging forward and burning everything in its path.”

    Through Frontier Precision, O’Neill offered high-tech mapping equipment, his own expertise, and the help of Nathan Stephenson, an applied geospatial engineer working in the company’s Denver office.

    “We used a combination of Trimble R10s and Trimble R8s to gather accurate data points on the ground,” Stephenson said.

    This thermal map shows the fissure system and lava flows as of 6 a.m. on Saturday, Aug. 11. The thermal map was constructed by stitching many overlapping oblique thermal images collected by a handheld thermal camera during a helicopter overflight of the flow field. The base is a copyrighted color satellite image (used with permission) provided by Digital Globe. (Map: USGS)
    This thermal map shows the fissure system and lava flows as of 6 a.m. on Saturday, Aug. 11. The thermal map was constructed by stitching many overlapping oblique thermal images collected by a handheld thermal camera during a helicopter overflight of the flow field. The base is a copyrighted color satellite image (used with permission) provided by Digital Globe. (Map: USGS)

    The mapping team flew UAS drones over the flow to gather visual imagery data, matched it to the ground reference points, stitched the photos together and draped it over county maps. The process was repeated as often as needed — daily, and sometimes even hourly — to show the speed and direction of the flow.

    Stephenson isn’t new to mapping lava flows. As a graduate student at the University of Hawaii – Hilo, he worked on collecting data on the Pahoa eruption in 2014, and he’s seen advances in technology in just a few years.

    “One thing we have now that we didn’t have in 2014 was a thermal radiometric camera that helps us map more accurately at night and enables us to capture large heat signatures.”

    The collected data helps Hawaii Civil Defense and other agencies keep the public informed and safe, and in the long term it also contributes to the store of scientific knowledge about eruptions and lava flow behavior.

    Lidar image of the Hawaii dataset showing the Kilauea Calderand the Halena'uma'u Crater and within it. (Image: Quantum Spatial)
    Lidar image of the Hawaii dataset showing the Kilauea Calderand the Halena’uma’u Crater and within it. (Image: Quantum Spatial)

    Airborne lidar insights. Another technology that aids in volcano response is lidar. High-resolution lidar surveys help first responders, scientists and government agencies monitor Kilauea conditions and predict future lava flows.

    Independent geospatial data firm Quantum Spatial Inc. (QSI) has conducted high-resolution lidar surveys of areas surrounding the Kilauea volcano eruption in Hawaii.

    The emergency response effort was part of the U.S. Geological Survey’s (USGS) Rapid Response Imagery Products (RRIP) in support of the Kilauea’s 2018 East Rift Zone – Remote Sensing Acquisition Requirement.

    The USGS Hawaiian Volcano Observatory (HVO), along with emergency responders, government agencies and academics, will use the data to better understand the conditions and characteristics of the volcano, and help planners model potential lava flows, which may better predict and respond to future flows and enhance safety of residents.

    The QSI team, which included GEO1 and Windward Aviation, deployed within days to acquire high-resolution lidar at point densities averaging from 40 to 80 ppsm, with up to 150 ppsm in select areas and 100-mp digital imagery using a Riegl dual VUX-1 LR sensor pod equipped with ABGPS/IMU mounted on a Hughes 500D helicopter.

    The project required 11 missions over the course of six days, operating at times as low as 500 feet above the ground and above active flows and nearby erupting calderas. With a need for a quick turn around, QSI deployed an analyst with the flight crew to post process each mission within hours of collection.

    The data was uploaded to the Geospatial Repository and Data Management System (GRiD) interface, developed by the U.S. Army Corps of Engineers (USACE), where additional data products have been developed and provided to the response team that includes FEMA, Hawaii’s Emergency Operations Center (EOC) and the Hawaii County Civil Defense.

    After data collection, QSI measured topographic shifts during the processing by comparing new data with a 2011 lidar collection from the same area. Survey specialists and USGS experts confirmed within hours of processing QSI’s lidar data that areas within the site had shifted up to 1.5 meters east, 2 meters to the north and 1 meter in elevation.

    USGS scientists will continue to examine the new topographic data to better understand the nature of these shifts, and integrate it into lava flow models for more accurate predictive modeling.

    The eruption in action. Using small unmanned aerial systems (sUAS) together with air-quality sensors, advanced imaging tools and Esri’s spatial analytics and mapping, a team from the Center for Robot-Assisted Search and Rescue (CRASAR) provided real-time aerial views of the eruption.

    The five volunteers armed with drones, advanced sensor systems and GIS technologies joined the response effort May 14-19 at Kilauea Volcano Lower East Rift Zone to assist in tracking and predicting the ongoing volcanic eruption. The team supplemented the University of Hawaii Hilo’s (UHH) sUAS capabilities, allowing UHH sUAS operators to focus on geographical and volcanology.

    The CRASAR team identified a new fissure not visible from the ground, projected the lava flow rate during the night when manned helicopters were not allowed to fly, and provided ongoing data collection from new thermal sensors technology.

    After the project, CRASAR published lessons learned on its blog:

    • Night flights of UAVs are very effective.
    • Rotorcraft UAVs can effectively sample gas.
    • Rotorcraft UAVs with thermal sensors are very effective.
    • Rotorcraft UAVs provide a quick look at lava flow rates.
    • Plumes will interfere with photogrammetric mapping.
    • Hanger 360 (software) rapidly produced panoramas.

    During the six-day Leilani deployment, the CRASAR team flew 44 sUAS flights, including 16 at night, using DJI 200, 210, Inspire, and Mavic Pro drones. Esri’s Drone2Map for ArcGIS together with Hangar’s Enterprise Platform for 360-degree imaging enabled rapid 360-imaging for situational awareness.

    DJI’s new XT2 thermal sensor provided unprecedented drone-based air-quality monitoring. Video and data were shared with local first responders using FirstNet, the first high-speed, nationwide wireless broadband network dedicated to public safety.

    The CRASAR response marks the first known use of sUAS for emergency response to a volcanic eruption and first known use of sUAS for sampling air quality.

    The GIS mapping and imaging technologies responders used on the scene at Kilauea Volcano Lower East Rift Zone are available here.

  • Quantum Spatial lidar surveys provide volcano eruption insights

    Looking southwest towards Leilani Estates with Fissure 8 erupting in the background. (Image: Ron Chapple/GEO 1)
    Looking southwest towards Leilani Estates with Fissure 8 erupting in the background. (Image: Ron Chapple/GEO 1)

    High-resolution lidar surveys help first responders, scientists and government agencies monitor Kilauea conditions and predict future lava flows.

    Independent geospatial data firm Quantum Spatial Inc. (QSI) has conducted high-resolution lidar surveys of areas surrounding the Kilauea volcano eruption in Hawaii.

    The emergency response effort was part of the U.S. Geological Survey’s (USGS) Rapid Response Imagery Products (RRIP) in support of the Kilauea’s 2018 East Rift Zone – Remote Sensing Acquisition Requirement.

    The USGS Hawaiian Volcano Observatory (HVO), along with emergency responders, government agencies and academics, will use the data to better understand the conditions and characteristics of the Kilauea volcano, which has been continually erupting since May 3.

    Data also will assist planners in modeling potential lava flows, which may better predict and respond to future flows and enhance safety of residents.

    The USGS National Geospatial Program (NGP) selected QSI to perform the first of two planned surveys over the active volcanic area. The QSI team, which included GEO1 and Windward Aviation, deployed within days to acquire high-resolution lidar at point densities averaging from 40 to 80 ppsm, with up to 150 ppsm in select areas and 100-mp digital imagery using a Riegl dual VUX-1 LR sensor pod equipped with ABGPS/IMU mounted on a Hughes 500D helicopter.

    Five distinct locations, covering an area of 57 square miles, were targeted:

    • Kīlauea Summit Caldera
    • Pu’u O’o Crater and flow
    • Chain of Craters Road / Kaoe
    • Puna Geothermal Venture (PGV)
    • Western Leilani Estates lava field.

    The project required 11 missions over the course of six days, operating at times as low as 500 feet above the ground and above active flows and nearby erupting calderas. With a need for a quick turn around, QSI deployed an analyst with the flight crew to post process each mission within hours of collection.

    The data was uploaded to the Geospatial Repository and Data Management System (GRiD) interface, developed by the U.S. Army Corps of Engineers (USACE), where additional data products have been developed and provided to the response team that includes FEMA, Hawaii’s Emergency Operations Center (EOC) and the Hawaii County Civil Defense.

    After data collection, QSI measured topographic shifts during the processing by comparing new data with a 2011 lidar collection from the same area. Survey specialists and USGS experts confirmed within hours of processing QSI’s lidar data that areas within the site had shifted up to 1.5 meters east, 2 meters to the north and 1 meter in elevation.

    USGS scientists will continue to examine the new topographic data to better understand the nature of these shifts, and integrate it into lava flow models for more accurate predictive modeling.

    “Airborne lidar and imagery remote sensing surveys are invaluable tools for understanding the effects of active volcanic eruptions, which change the topography as fissures emerge and lava flows extend to the ocean,” said Michael Shillenn, vice president at QSI. “We were honored to work with the USGS and others on this critical project. We believe that data and analysis provided by the QSI team will provide insights into future scenarios, enabling emergency responders to protect the surrounding community.”

  • GPS actively monitoring Kilauea’s eruptions, lava flows

    GPS actively monitoring Kilauea’s eruptions, lava flows

    GPS measurements are playing a key role in monitoring the erupting Kilauea volcano in Hawaii.

    The floor of the Pu’u ‘O’o Crater started to collapse on April 30, following weeks of uplift and increasing lava levels within the cone and seismicity in the East Rift Zone. The eruptions began on May 3, when a magnitude 5 earthquake struck, causing further collapse of the crater.

    The Hawaiian Volcano Observatory (HVO) has monitored volcanic activity on the islands since 1912. The HVO is operated by the U.S. Geological Survey (USGS) and is issuing continuous updates on Kilauea.

    The HVO is closely monitoring the biggest fissures in what is known as the lower East Rift Zone. Geologists are onsite to track ongoing and new fissure activity and the advance of lava flows.

    Kilauea eruption map as of 8 a.m. HST, May 21. Shaded purple areas indicate lava flows erupted in 1840, 1955, 1960 and 2014–2015. (Photo: USGS)

    GPS stations monitor land movement of Kilauea. The Big Island’s most active volcano has erupted nearly continuously for more than three decades.

    “Magma supplied to the Lower East Rift Zone was indicated by the northwest displacement of a GPS monitoring station,” the HVO said in its May 26 status update, but the station ceased movement a few hours later, telling a new story.

    “Magma continues to be supplied to the Lower East Rift Zone; however, a GPS instrument near the Lower East Rift Zone is no longer moving, suggesting that the rift zone is no longer inflating in this area,” the HVO stated. “Elevated earthquake activity continues, but earthquake locations have not moved farther downrift in the past couple of days.”

    Map of GPS stations installed near the Pu’u O’o vent on Kilauea. (Photo: USGS)

    The GPS stations also monitor earthquake activity associated with the volcano. For instance, the May 4 magnitude 6.9 earthquake resulted in seaward motion of 1.5 feet along portions of Kīlauea’s south flank as measured by GPS stations across the volcano.

    “Because active volcanoes make for unstable land, highly sensitive seismometers come in handy to track the frequency and strength of micro-earthquakes,” the HVO explained. “Global Positioning System (GPS) devices and another satellite-based technology, InSAR (Interferometric Synthetic Aperture Radar), map ground deformation (inflation and deflation) to within a fraction of an inch while tiltmeters measure slope from ground level. Together, these technologies help track lava’s movement underground and help pinpoint where it might break through the surface.”

  • Locating lava flows before an eruption

    Locating lava flows before an eruption

    lava inundation zones: In this USGS map, colors depict 3 of 18 lava Inundation zones for Mauna Loa. Yellow indicates the volcano’s Northeast Rift Zone, an area along which lava could erupt. The extent of the 1984 eruption and lava flow is superimposed on the map (red). (Map: USGS)
    Lava inundation zones: In this USGS map, colors depict 3 of 18 lava Inundation zones for Mauna Loa. Yellow indicates the volcano’s Northeast Rift Zone, an area along which lava could erupt. The extent of the 1984 eruption and lava flow is superimposed on the map (red). (Map: USGS)

    New U.S. Geological Survey (USGS) maps show areas that could be affected by Mauna Loa lava flows — information critical for response planning. Each zone identifies a segment of the volcano that could erupt lava and send flows downslope.

    The volcano has erupted 33 times since 1843. Typically, eruptions began in the summit caldera, with a curtain of fire (a 1- to 2-kilometer line of lava fountains).

    Using detailed geologic mapping and modeling of how a fluid (in this case, lava) responds to surface topography, the USGS Hawaiian Volcano Observatory constructed nine maps depicting 18 inundation zones on Mauna Loa, Hawaii.

    Colored regions on these maps show areas on the volcano’s flank that could potentially be covered by flows from future Mauna Loa eruptions. These eruptions could originate from the volcano’s summit, rift zones or radial vents. It’s likely, however, that only part of a zone would be covered in a single eruption.

    When a Mauna Loa eruption starts, the maps can help decision makers quickly identify communities, infrastructure and roads between possible vent locations and the coast, facilitating more efficient and effective allocation of response resources, the USGS said. The public can also use the maps to consider where lava flows might go once an eruption starts.

    A pamphlet about the maps is available here.

    lava flow glow: Had the Mauna Loa inundation maps been available in April 1984, when the volcano last erupted, the maps could have been used to determine that the northern portion of Hilo was the most likely area to be impacted by the main lava flow. (Photo: David Little)