The Icelandic Road and Coastal Administration (IRCA) has commissioned the Dutch UAV manufacturer Acecore to map the extent and aftermath of the Eldvörp-Svartsengi volcanic system eruption using its high-end UAV solutions. Grindavík, a fishing village on the Reykjanes Peninsula in southwestern Iceland, has only recently welcomed residents home following a series of earthquakes. However, the area is still not completely at ease, with the latest reports saying that a nearby magma chamber could again erupt near the village.
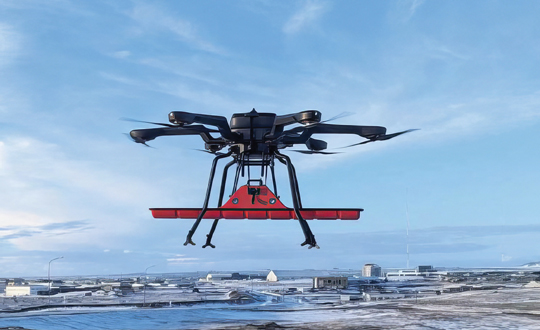
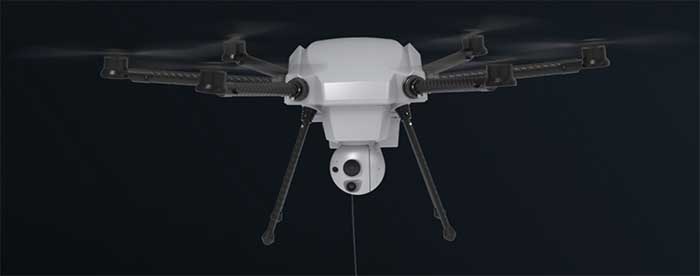
Acecore’s new hybrid drone model. (Photo: Acecore)
“Acecore drones are particularly suitable for use under tough circumstances,” said Jorrit Linders, founder and CEO of Acecore, on the Dutch public-service radio station NPO Radio 1. “The drones can operate in severe weather conditions, such as wind force 7 or 8, temperatures well below zero and hail and snow showers. This is due to their robust frame, their strong design and the right components. The robust construction is produced entirely in the Netherlands. This, combined with a continuous flight time of 2.5 hours, is essential for projects such as the volcanic eruption in Iceland.”
Acecore has been mapping in the region near Grindavík for four weeks as of March 2024. The surveys were done not without challenges and risks, as they involved operating in areas that had not yet been declared safe. The high workload and poor weather conditions forced the on-site team to rotate every five to six days. Linders was able to train both Acecore employees and pilots working for The Icelandic authorities on how to properly conduct aerial surveys to collect the relevant data effectively.
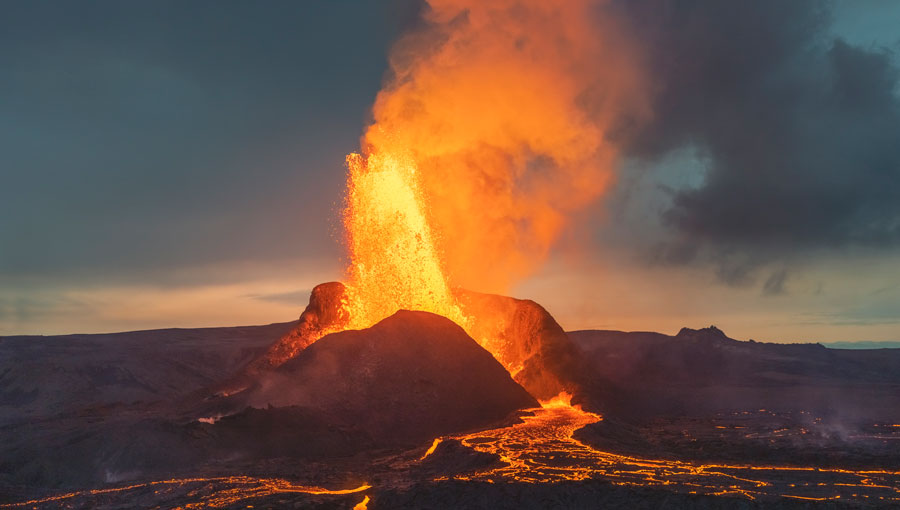
Lava flowing down the main road toward Grindavík. (Photo: Acecore)
Acecore developed and deployed a hybrid version of its Noa UAV, which already was used by the Icelandic authorities. The gas-electric platform was able to achieve flight times of 132 minutes with the Radarteam Cobra ground penetrating radar (GPR) of 5.2kg. The Noa Hybrid UAV has liquid heat management for its gasoline boxer engine, making it highly capable of dealing with Icelandic temperatures of up to -12°C. It uses a dual antenna and dual-band GNSS high-precision receiver to accurately measure yaw using GPS, so as not to be affected by electromagnetic interference from power lines and metal structures while mapping the village.
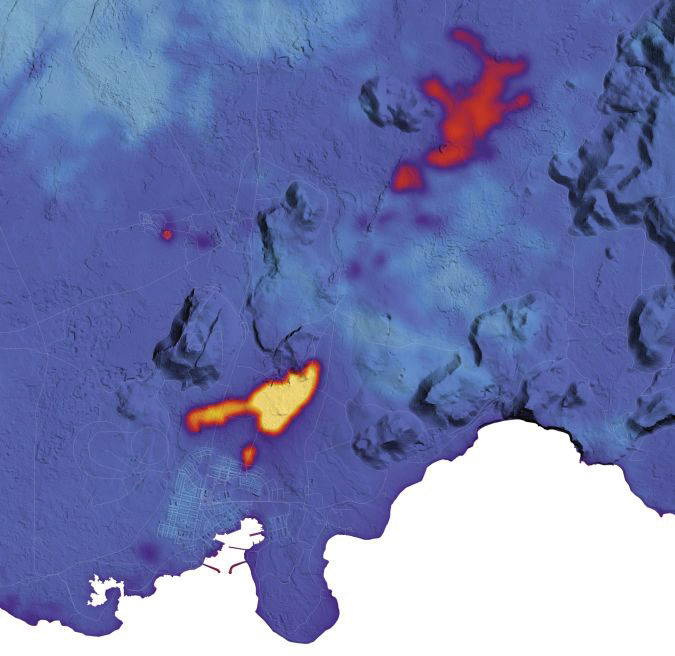
This map indicates the location and extent of recent activity using data acquired on January 16, 2024, by the TIRS-2 (Thermal Infrared Sensor 2) on the Landsat 9 satellite. The data is overlaid on a digital elevation model of the area. (Photo: NASA Earth Observatory/Lauren Dauphin, contains Landsat data from the USGS)
The UAV flights take off from fixed locations to perform their automated missions: scanning the affected area to collect all data needed by the Icelandic authorities. This involves data generated by a GPR sensor mounted under the UAV.
“We take a kind of X-ray of the ground as the basis for accurately mapping the subsidence and cracks,” explained Linders. “This then allows the Icelandic scientists to do a careful analysis of the area.” The GPR technology allows cracks to be scanned and underground fissures and shifts to be identified so scientists can predict where more eruptions are likely to occur and assess the safety of the location.”
The GPR technology allows cracks to be scanned and underground fissures and shifts to be identified so scientists can predict where more eruptions are likely to occur and assess the safety of the location.
The ongoing efforts in Iceland are a testament to Acecore Technologies’ dedication to pushing the boundaries of what is possible with UAVs. As they continue to map the area around Grindavik, their expertise and technology are not just tools for assessment but also a sign of hope for a community looking toward recovery. There is more work to be done, said Acecore’s Youri van Helden, “We haven’t put our snow boots in storage yet.”
The Japan Meteorological Agency (JMA) has reported that on July 10-17, data from GNSS signals indicated continuing minor inflation at shallow depths beneath Mount Ioyama, located on the northwest flank of the Karakuni-dake stratovolcano in the Kirishimayama volcano group in Japan.
Shallow volcanic earthquakes were recorded and vigorous fumarolic activity was visible at the fumarolic on the south side of Mount Ioyama. The alert level remained at two, on a five-level scale, and the public was warned to stay 1 km away from Mount Ioyama.
This JMA report was noted on July 18 in the Weekly Volcanic Activity Report, which is a cooperative project between the Smithsonian Institution’s Global Volcanism Program and the Volcano Hazards Program of the U.S. Geological Survey. The report is updated every Wednesday and averages 16 reported volcanoes.
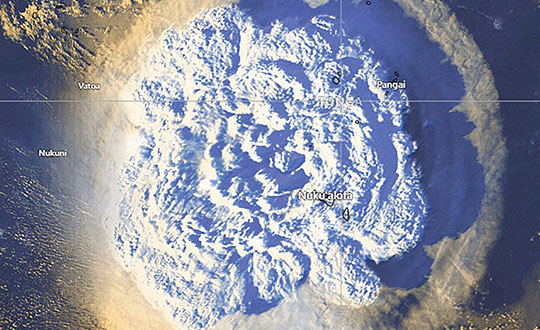
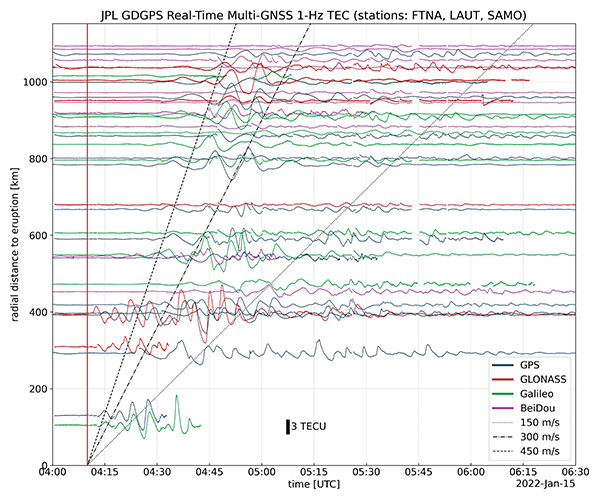
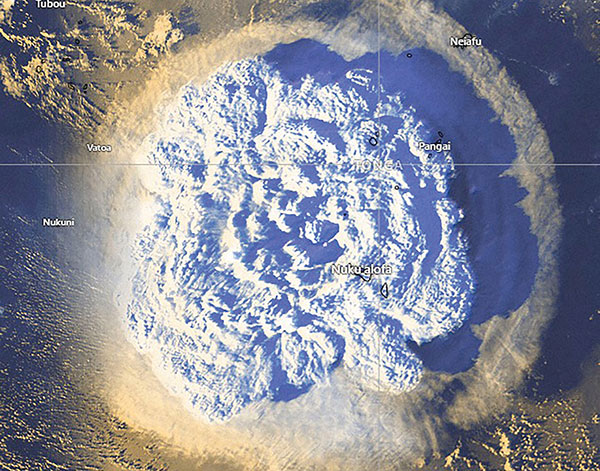
On Jan. 15, Hunga-Tonga-Hunga-Ha’apai, an uninhabited volcanic island on the Tongan archipelago in the South Pacific Ocean, erupted with spectacular force, churning ocean waters halfway across the globe.
GNSS engineers also detected its effects hundreds of miles above, in the ionosphere. The GNSS community is now moving from such after-the-fact detection to real-time monitoring using NASA’s Global Differential GPS (GDGPS) system, according to a team with the Tracking Systems and Application Section at NASA’s Jet Propulsion Laboratory (JPL) in Southern California.
“We monitored, in real time, four GNSS satellite constellations from numerous stations around the world using the GDGPS network. In particular, the three stations closest to the volcano, in Samoa, Fiji and Tahiti,” said postdoctoral associate Leo Martire. “We could see extremely high and strong signals in the ionosphere, which is very unusual. As a function of radial distance from the eruption, the first detected ionospheric perturbation likely originated directly from the explosion. Then we see patterns propagating at increasing distances at different radial propagation speeds.”
Monitoring such events adds information to the catalog of signals from natural hazards, pointed out Siddharth Krishnamoorthy, a research technologist who manages JPL’s GUARDIAN near-real-time tsunami warning system, currently under development. “That is useful because, in the future, if you want to be able to spot natural hazards and issue alerts, you need to know what the signal looks like. There have been reports of a tsunami in Tonga due to this event, so we will look at potential tsunami-induced signatures in the ionosphere. We are trying to get to a place where we pick up a signal like this and we are able to say, ‘This is a tsunami propagating at this speed and in this direction.’”
Chart: Jet Propulsion Laboratory
Before being detected in the ionosphere, signals from natural hazards must travel all the way from the surface. For tsunamis, this usually takes more than 10 to 20 minutes, but the volcanic eruption only took a couple of minutes to reach the ionosphere because it shot straight up. “We do not know yet, based on observations, how exactly different events on the surface caused by natural hazards couple with the atmosphere,” said research technologist Panagiotis Vergados. “Every event is unique in its spectral properties.”
The event did not affect the quality of GDGPS’s GNSS positions or orbits, because dual-frequency measurements remove significant ionospheric effects. “Instead of looking at the direct effects on the position of our available reference stations, which is what our traditional real-time monitoring does and which was basically negligible, imagine the links from each of those stations to a dozen or more satellites,” said Larry Romans, GDGPS chief technologist. “Every time one of those many links pierces the ionosphere, we can monitor that signal for ripples as waves go by. So, this is an incredibly powerful method for seeing disturbances, just in terms of the density of data. It is very complementary to position-based natural-hazards monitoring because the data is much richer.”
In addition to volcanoes and tsunamis, several other natural events, such as earthquakes and very large thunderstorms, also produce these effects. “These natural forcings cause large-scale, low-frequency pressure perturbations that tend to travel up and be visible in the ionosphere,” Krishnamoorthy said. “There are also perturbations of the ionosphere due to events from outside the Earth, such as solar flares or bolide impacts.”
Many of these perturbations start from the troposphere, which ranges between 10 km and 15 km in altitude — including hurricanes, which overshoot gravity waves all the way to the ionosphere, and thermal tides that have been observed to go all the way up to 600 km, said Vergados. “There are also geomagnetic storms and sub-storms that, during electron precipitation, can change the ionization of the ionosphere. So, the coupling can happen from either below or above or simultaneously, and then the effect can be dramatically enhanced.”
Most of the perturbations that come from below are of a pressure nature — that is, they start out as mechanical waves — while most of those that come from above are electromagnetic. “Aside from nuclear explosions, very large chemical ones, such as the 2020 Beirut explosion, also cause a signature on the ionosphere because they create very large pressure waves,” Krishnamoorthy said.
Photo: Tonga Meteorological Services, Government of Tonga
Beginning in September, GPS stations in Kilauea’s upper East Rift Zone observed increased rates of uplift, higher than they have been since the end of the eruption in 2018. According to the U.S. Geological Survey’s Hawaiian Volcano Observatory, earthquake rates increased in late November.
On Dec. 2, GPS stations and tiltmeters recorded a ground deformation quake at Kilauea’s summit accompanied by earthquake swarms.
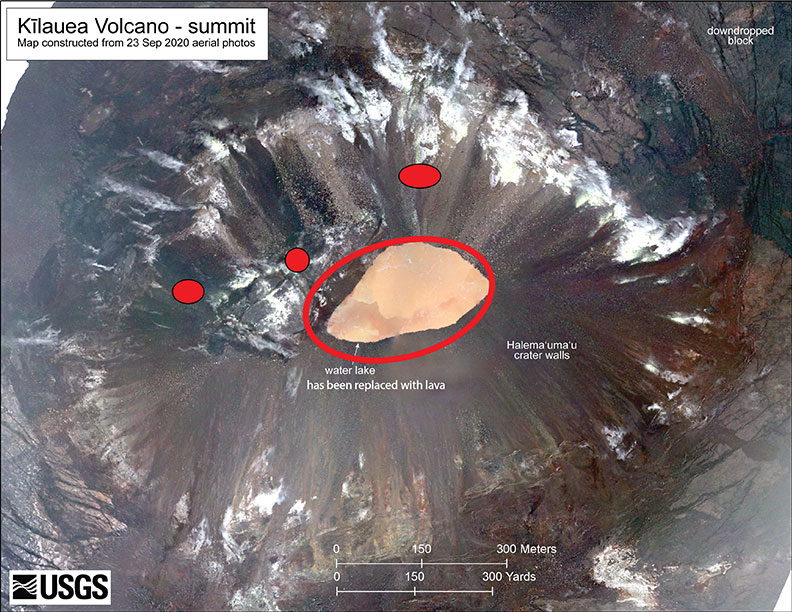
Then on Sunday, Dec. 20, a magnitude 4.4 earthquake struck on Kilauea’s south flank and three fissure vents broke open inside the caldera. Fountaining lava at these vents is estimated to be up to 82 feet high. The vents are feeding lava flows into the base of Halema‘uma‘u crater, which is being filled with lava. The lava lake has been rising several yards an hour since the eruption began at 9:36 p.m. Sunday. The eruption is currently confined to the crater.
According to the observatory, “The water lake at the summit of KIlauea has boiled away and an effusive eruption has commenced, with three vents in the wall of Halema‘uma‘u crater generating lava flows that are contributing to a growing lava lake at the base of the crater.”
As of Dec. 29, the summit eruption continued with the western vent active (the other vents have been covered by the lava lake). At 3:45 a.m. HST, field crews measured the lava lake as 179 meters (587 feet) deep, about 650 feet below the rim.
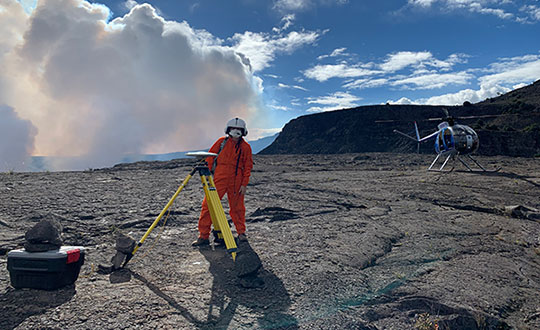
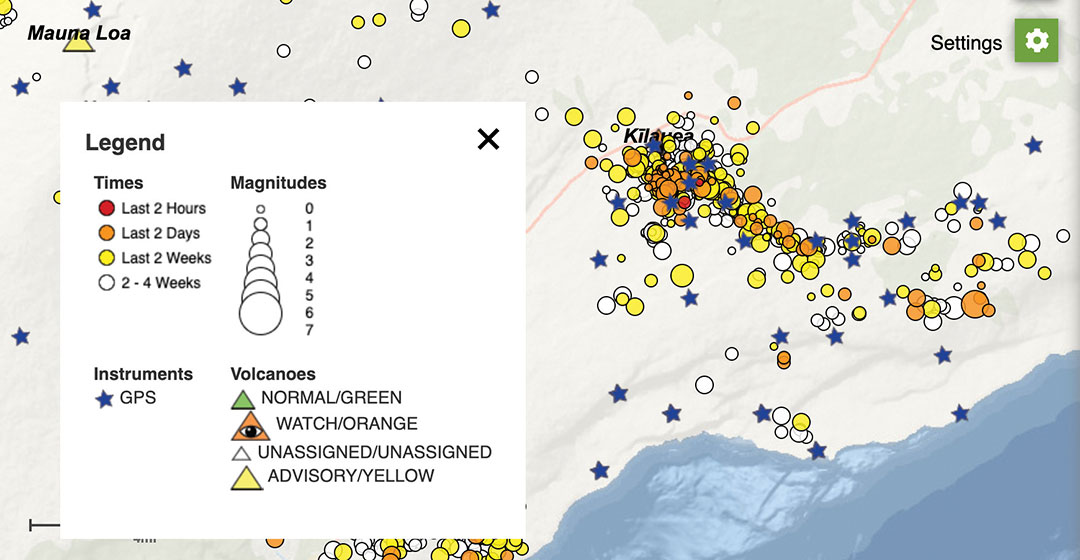
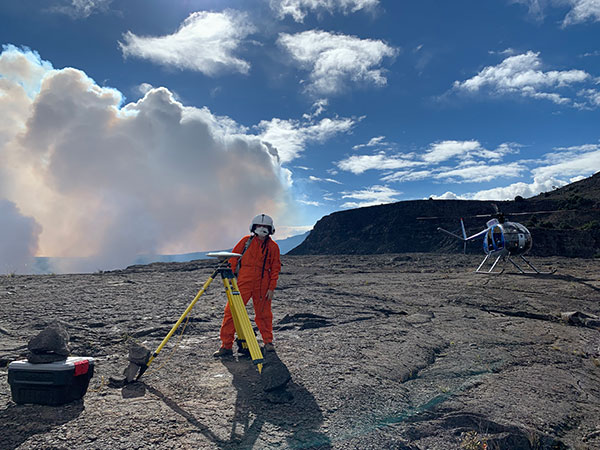
Shortly after 9:30 p.m. HST Dec. 20, an eruption began at the summit of Kīlauea Volcano in Hawaii. Red spots indicate fissure vents feeding lava into the bottom of Halema‘uma‘u crater. Lava coverage is 32 feet higher than the water in this photo (base map is from imagery collected on Sept. 23, 2020).The water lake at the base of Halema‘uma‘u crater has been replaced with a growing lava lake. View from the west rim of Kīlauea Caldera just before 5 a.m. HST on Dec. 21, 2020. A 59-foot fountain joins two other fissures to feed a growing lava lake at the base of Halema‘uma‘u crater. (Photo: USGS)The interactive USGS monitoring map shows GPS stations situated on and around Kilauea as well as volcano activity. (screenshot taken at 12 p.m. HST on Dec. 21).An HVO geophysicist deploys a GPS receiver on the Kilauea caldera floor to measure changes in ground motion. A volcanic gas plume rises in the background. GPS and tiltmeter data show contraction in the upper portion of the East Rift Zone (an area between Kīlauea’s summit and Pu‘u ‘Ō‘ō). (Photo: USGS)
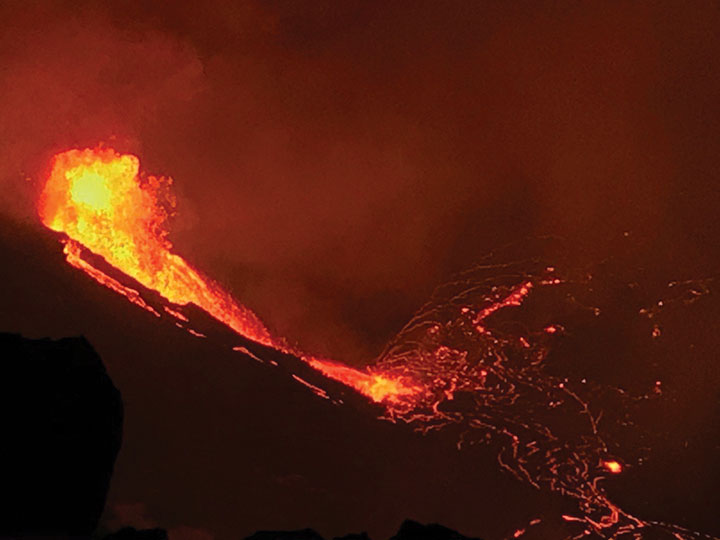
Just a couple of pieces of drone news this month — who would imagine flying a fixed-wing drone into the plume of a volcano? And some new advances in tethered drone capability.
Global warming/climate change — a collection of words which can sometimes lead to disputes, disagreements and dismay. These words can fill people with enthusiasm for change and in others have them just shaking heads. I saw a video some time ago made by an eminent scientist who claimed that all the efforts made by humans to pollute over the centuries and the efforts being made now to help the atmosphere, were insignificant when all the junk kicked out on a daily basis by volcanoes around the world was taken into account.
Nevertheless, it’s for sure that the climate is changing — by human hand or by nature — some people are still seeking a scientific basis to establish if it can somehow be remedied — a greener approach which could stop or limit our ability to go on polluting the only world we have, or at least some version of curbing what we are doing to make things worse.
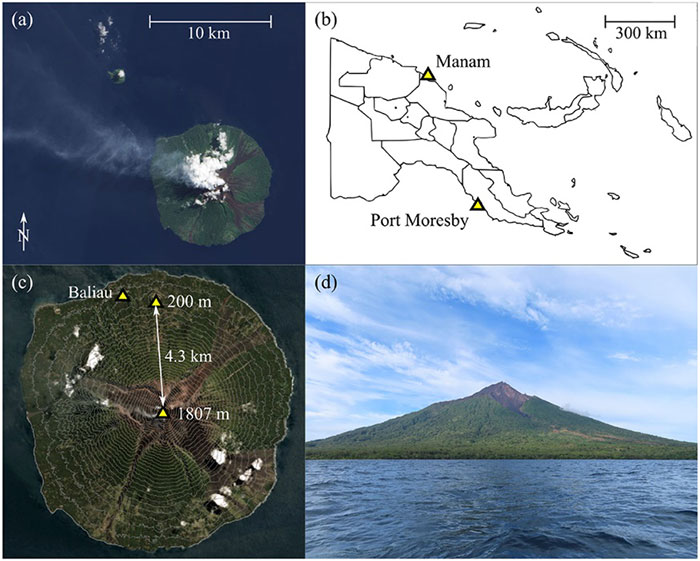
So it was exciting for me to see recent reports of an expedition from last year in Papua New Guinea where an international group used drones in an attempt to measure carbon dioxide, sulfur dioxide and hydrogen sulfide coming out of the active Manam volcano. The objective appeared to be direct sampling of the volcano plume to determine content, not just for measurement alone but perhaps also eventually maybe monitoring changes in gas content to forecast future eruptions.
A series of significant eruptions last took place 2004-2006, and again in 2014, but since then Manam has continued to be explosively active all the way up to the present day. It’s possible to climb almost 6,000 feet to the upper dome, but for more efficient regular monitoring the expedition wanted to demonstrate that a fixed wing drone, operated from a village 2.7 miles away, almost at sea level, would work better. Satellite data on emissions is also available, but apparently no predictions of CO2 content has so far been possible, so land based survey and direct sampling might greatly improve understanding.
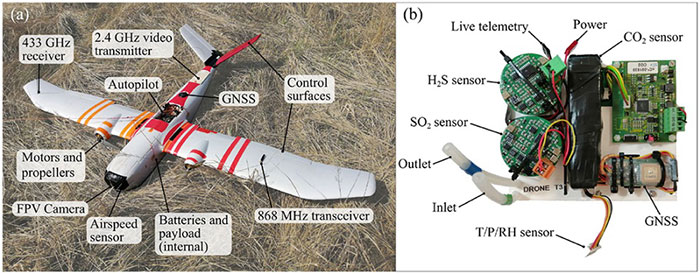
Hand launched, with an internal parachute system for recovery, the Titan UAV, which can lift a payload of around 2 pounds to an altitude of 7,500 feet and has a range of more than six miles. For the trip to the volcano, two 4k cameras provided forward and rear views, oversized electric motors were installed to provide more thrust and onboard data capture allowed for subsequent analysis of the vehicle dynamics as well as the gas content of the environment. Live data was also transmitted real-time to the operator and monitoring crew and was also stored for later review. The autopilot on the drone is capable of automatic GPS waypoint navigation and manual flight mode may be engaged by the operator. The drone carries GNSS, barometric altitude, airspeed indication and IMU sensors.
The automatically flown flight path up 5,300 feet to one of the two volcanic outlets on the mountain followed a zig-zag path to a point offset from the smoking caldera, and if the drone failed to then turn and intercept the plume automatically, it was manually maneuvered in level flight into the smoke column. Plume intercept was interpreted as a steep increase in sulphur dioxide concentration, and at the same time there were increases forces on the drone, at times up to 2.5 g, with roll deviations up to 25 degrees and significant uplift. Not unsurprising rock and roll given the energy being released by the volcano.
After each plume intercept the drone then left the area and descended in a spiral to the launch site, being recovered by manual parachute release. Two flights were successful, yielding lots of data for analysis, but there was an upset while in the plume on the third flight and the vehicle was lost, thought to be related to pulsating increases in the velocity of gas released by magma in the crater and what looked like a 7-g increase in forces on the vehicle. The plume was figured to be between 1800 ft and 2,500 feet wide, using the length of time spent in the smoke column and the speed being flown.
The flights were all conducted under Beyond Visual Line of Sight (BVLOS) conditions as agreed by the local air control agency and significant drone design improvements and flight techniques for subsequent ‘volcano operations’ were recommended. Gas emissions were measured at 3,450 to 4,360 tons/day CO2 and 4,840 to 5,880 tons/day SO2 — so lots of carbon pollution from one of the earth’s most active volcanos, one of around 500 worldwide.
Tethered drones offer advantages for some specific applications such as longer flight times for surveillance. Recent outings by Elistair tethered drone systems have included crowd monitoring and TV coverage for Super Bowl in Atlanta, Ryder Cup golf near Paris France, traffic monitoring in Lyon France, TV coverage for the Alpine World Ski Championships in Sweden, Paris Le Bourget airport approach light monitoring, Trinidad carnival crowd monitoring, Kentucky festival crowd monitoring and communications relay, fire control exercises in Greece, New Year’s crowd monitoring in Vienna and crowd monitoring at Madrid’s soccer stadium.
The Orion 2 tethered drone (Photo: Elistair)
But endurance is a key element for longer term surveillance, so Elistair has come out with Orion 2 which has extended the previous 8-12 hours operations envelop all the way out to 24 hours — and added IP54 dust and water rating, so weather shouldn’t interrupt service.
The tether now extends up to 330 feet so the drone can see out further and it can now also lift a 4.5-pound payload such as a combined ISR (intelligence, surveillance and reconnaissance) and telecom platform. While streaming georeferenced electro-optical and infrared video, 4G/5G communications nodes may also be brought online at the same time.
So an insight into what it takes to fly a drone into active volcano emissions to move us further towards understanding climate change, and improvements in tethered drone endurance. Doubt many of would expect a drone to survive the extreme turbulence created by the energy released from a volcano, or would even try to do so, but one group has been successful and found a new way to monitor activity and measure bad stuff being pumped into the atmosphere. And if we can hover a multi-rotor drone in the air for 24 hours at about 300 feet, who knows what new applications will soon come out of it.
GNSS and inertial navigation sensors are meeting the challenges of extreme conditions, from freezing Arctic ice to the edges of steaming volcanoes, from high-speed aircraft over cities to the subways under them. Even beyond, into deep space.
IN THE ARCTIC
Wave Buoys Help Study Arctic Climate Change
Where the edge of Arctic ice transitions to open water, towering seas are smashing sea ice into melting pieces, with far-flung effects on climate and nature. Over recent decades, the Arctic has warmed more than any other region, leading to a significant reduction in sea ice volume. The combination of increased ice-free area and more mobile ice cover has led to the emergence of a seasonal marginal ice zone (MIZ) in the Beaufort Sea, north of Prudhoe Bay, Alaska.
The United States Office of Naval Research conducted a five-year study of the MIZ, which included intense field work in the freezing Arctic sea. Here, the ice is vulnerable to ocean surface waves that form in the open water, resulting from strong winds and frequent storms. Also studied were in-ice waves, where ice and water clash. The goal was to understand how both factors impact the ice floe melting.
The MIZ lies in the subarctic seas in winter and transitions into the interior of the Arctic Basin in summer. To investigate the MIZ’s dynamics, ONR engaged an international program of observations and simulations using several autonomous systems, including wave buoys. The wave buoys — officially designated the autonomous ocean flux buoys — integrate SBG Systems’ miniature inertial sensors.
The MIZ study comprised an international team of scientists from more than a dozen organizations.
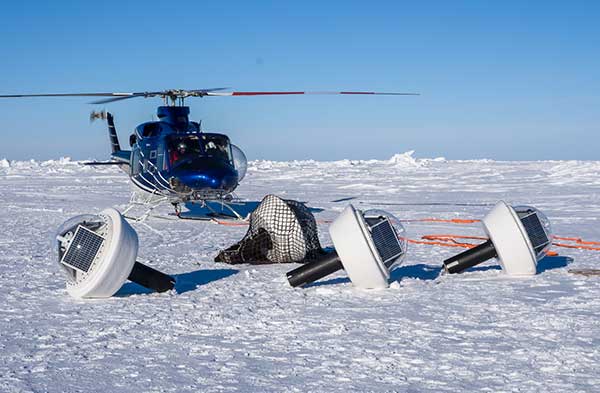
Buoys for All Seasons. The program included 20 buoys deployed in the summer, and five in the winter, to quantify open ocean and in-ice wave characteristics and evolution. “We needed a very rapid and cost-effective solution to measuring directional wave spectra in the ocean,” said Martin Doble, oceanographer at the French UPMC School and member of the research program. “Time to deployment was very short, so an integrated solution, giving us good heave numbers straight out of the box, was essential. Delivery time of the units was also critical.”
Drilled into the ice, the summer buoys were powered with solar panels and equipped with SBG Systems’ IG-500A miniature attitude and heading reference system to detect both distant and near-wave effects on the local ice floe. Once the ice melted, the summer buoys continued to measure open ocean characteristics.
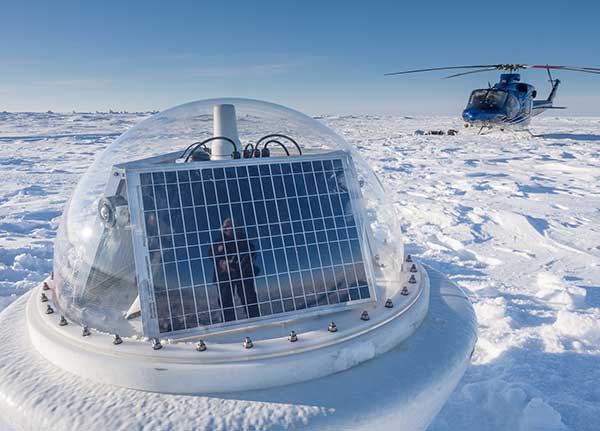
Five winter buoys were installed on the ice. These buoys were made of aluminum for better resistance and contained enough battery power to keep them going through the dark winter months. Every buoy also contained processing and control electronics, an SD card, a GPS receiver and an Iridium satellite modem and antennas to transmit the recorded data to its base station. Both summer and winter data from the buoys were used to quantify the wave attenuation rate.
Winter buoy installed on an ice floe. (Photo: SBG Systems)
By measuring the waves and ice, the buoys help scientists understand how waves are approaching and breaking up the sea ice. When winter approaches and ice begins to refreeze, the buoys help show how the waves interact with the ice as the temperatures change.
Calibration. The IG-500A inertial sensors were used for wave height and direction. IG-500A measures in real time the roll, pitch, heading (accurate to 0.35°) and heave (accurate to 10 centimeters). Every sensor is calibrated for bias, linearity, gain, misalignment, cross-axis and gyro-g from –40° to +85°C. The calibration is key to enabling the sensors to provide reliable data in the harsh environment.
Doble said the units were reliable, with no failures in the harsh Arctic conditions. They ran continuously for more than a year without requiring power cycling, and “the numbers look good, giving clear results.”
The data is helping researchers understand the physics that control sea ice breakup and melt in and around the ice edge. “We have this amazing picture of the ocean, atmosphere, and ice going from the fully frozen period in March to meltdown and breakup right through to freeze-up,” said Craig Lee of the University of Washington’s Applied Physics Laboratory.
The IG-500A sensors also delivered heave measurement, important for instrumented ocean buoys. During the project, SBG Systems released the Ellipse Series, and the new line replaced the IG-500 series. More accurate in attitude and more reliable (with an IP68 rating) for the same budget, the new miniature inertial sensors now provide a heave measurement that automatically adjusts to the wave period, resulting in higher performance.
Clear differences were measured between surface wave activity outside of the ice, and then moving into the ice, with huge attenuation as the waves enter the ice and die back quickly.
Current Arctic Program. Following the close of the MIZ project in 2015, the ONR launched a new project for 2016–2020, the Stratified Ocean Dynamics in the Arctic (SODA). SODA is also taking place in the Beaufort Sea, and is using the autonomous ocean flux buoys. The buoys are now equipped with SBG’s Ellipse-A sensors.
Why the Arctic Matters
“There’s no question that the Arctic sea ice extent is decreasing,” said Martin Jeffries, program officer for the ONR Arctic and Global Prediction Program. “Multiple sources of data — autonomous underwater gliders, ice-measuring buoys and satellite images of the marginal ice zone — were used to help understand why the ice is retreating.”
The implications for the U.S. Navy, and the world, are significant. If there were no sea ice in the Arctic at the end of summer, that would mean that the Arctic Ocean would, until the winter ice came in, be completely open — something unprecedented in living memory, Jeffries noted.
Naval leaders have made it clear that understanding a changing Arctic is essential for the Navy to be prepared to respond effectively to future needs.
“[T]he opening of the Arctic Ocean has important national security implications as well as significant impacts on the U.S. Navy’s required future capabilities,” said then Chief of Naval Operations Admiral Jonathan Greenert, in his introduction to the U.S. Navy Arctic Roadmap, 2014–2030, published in 2014. “The United States has a history of maritime homeland security and homeland defense concerns in the Arctic Region […] .”
In the period between 2007 and 2014, satellites recorded the eight lowest sea ice levels ever. A key goal of the MIZ and SODA programs is to use the new data collected to make better predictive computer models — ensuring safer operations for not only naval vessels, but also anticipated increased sea traffic by shipping and fishing industries; oil, gas and mining companies; and tourism operations.
Much of the data coming in to Arctic scientists is now from improved sensors, with greater ability to survive the harsh weather and ocean conditions.
Inside the Ellipse
Alexis Guinamard, chief technology officer of SBG Systems, described to GPS World the company’s most advanced sensor for extreme environments.
“Of course we have more precise sensors like Ekinox, Apogee or even Horizon, for ‘extreme’ precision. But for extreme environments, the more appropriate sensor line is the Ellipse series,” Guinamard said. “There are several key parameters that make them better for this kind of environment.”
Those features include a high-temperature calibration range, from –40°C to +85°C, which enables the sensors to operate at the same performance level in the most extreme temperature environments.
“While typical entry-level or industrial-grade sensors only provide a room temperature or basic temperature calibration, we have developed a calibration procedure used for both survey-grade and industrial-grade sensors using a precision two-axis rotary table with temperature chamber,” Guinamard said. “An advanced thermal modeling minimizes the calibration error over the full temperature range.”
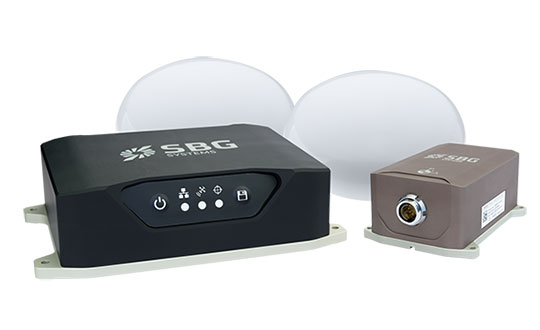
Ellipse-D dual-antenna mini INS/GNSS. (Photo: SBG Systems)
The sensors work in highly dynamic and vibrating environments because their gyros operate well, changing position up to 900° per second. Similarly, their accelerometers can reach up to 40 g, with excellent behavior in vibrating environments. “We can typically install our sensors directly on the chassis of the vehicle, while lower grade sensors may require specific dampers that are complex to design and make it difficult to precisely align the sensor,” Guinamard said.
A GNSS interference-mitigation capability enables the sensors to perform in challenging GNSS environments.
With the Ellipse-D, high latitude operation is possible because it provides a dual-antenna heading that is insensitive to higher latitudes, Guinamard explained.
Saltwater-Proof. SBG Systems sensors typically have waterproof (IP68) enclosures that can deal with harsh conditions and sustain exposure to saltwater for a limited period of time. For long exposure to salt water, the company offers specific titanium enclosures. For instance, its Navsight series has a saltwater-proof inertial measurement unit.
Navsight marine solution. (Photo: SBG Systems)
The Navsight Marine Solution is a motion and navigation solution for hydrographers available as a motion reference unit (MRU), as an inertial navigation solution (INS) with embedded GNSS, and as an INS using a third-party GNSS receiver.
Navsight can be outfitted for demanding shallow- or deep-water environments to survey highly dense areas (bridges and buildings), as well as applications where only a single antenna can be used.
With the addition of the Horizon inertial measurement unit (IMU) to the Navsight line in January, which joined the Ekinox and Apogee IMUs, the line is suitable for large hydrographic vessels surveying harsh environments. The Horizon IMU is based on a closed-loop fiber-optic gyro (FOG) technology that enables ultra-low bias and noise levels, allowing robust and consistent performance.
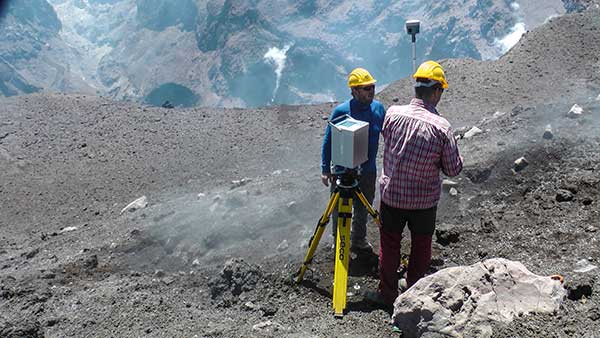
Dust, noxious gas and loose rock near the summit makes volcanic surveying especially challenging. (Photo: Trimble)
AT VOLCANO’S EDGE
GNSS Tracks Magma on Mount Etna
Scientists seeking to better understand volcanoes are using GNSS to investigate one of the most active in the world.
Mount Etna, in eastern Sicily, Italy, has been erupting for hundreds of thousands of years. The constant activity makes it a popular tourist attraction — smoke often billows from the mountain and fiery lava spews down its sides.
Researchers flock to Mount Etna, too, to study the movement of magma — the hot fluid beneath the Earth’s surface from which rocks are formed when cooled.
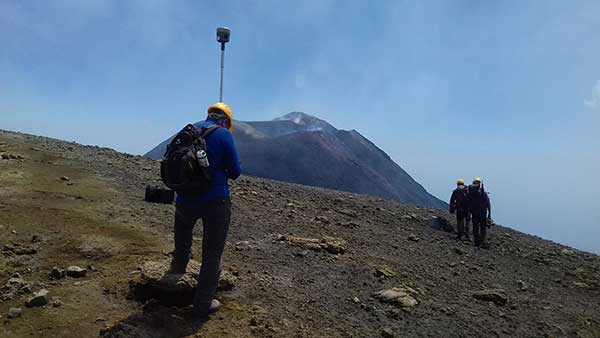
To measure the vertical gradients of gravity on Mount Etna’s slopes and summit craters, geophysicists from Slovakia and Italy teamed up on a field campaign during which they used high-accuracy GNSS positioning with emphasis on accurate height measurements to collect gravimetry and topographic information.
The extreme environment and spotty cellular coverage on Mount Etna made using GNSS with real-time kinematic (RTK) or virtual reference station (VRS) a challenge. The geophysicists used the Trimble CenterPoint RTX correction service and Trimble R10 GNSS receivers to ensure reliable GNSS performance.
“On many points, especially the higher part of the volcano, Internet signals were poor or [there were] none at all,” said Juraj Papčo, a geodesist with the Earth Science Institute of the Slovak Academy of Sciences. “Only by using RTX were we able to collect real-time data. It performed well in higher elevations and difficult conditions.”
The project teams also used Trimble RTX to navigate to locations where they needed measurements. At each station, they collected static and real-time positions and later compared post-processed results with the real-time positions.
Dust, noxious gas and loose rock made approaching the summit especially challenging. Trimble RTX helped the Slovak-Italian team of geophysicists better understand volcanoes and anticipate volcanic events.
Researchers used high-accuracy GNSS positioning to collect gravimetry and topographic information. (Photo: Trimble)Prisms affixed to the track enable measurement of change and structural movement. (Photo: Topcon)
UNDER A METROPOLIS
Harsh Construction Environment Monitored
Deep beneath Paris, work is underway to expand the Metro, the city’s rapid transit system. The Grand Paris Express project encompasses a 200-kilometer-long network of railway lines — mostly underground — that will link the suburbs to the city.
The contractor responsible for monitoring construction of the first stage of the project’s infrastructure, Cementys, is using more than 100 instruments from Topcon’s MS series of robotic total stations because they can withstand the harsh construction environment.
Monitoring structural movement across the network is critical; the goal is to protect the surrounding Parisian structures and the people who live and work in them. Use of the monitors also ensures that the expensive equipment used on the project is not stolen.
Topcon’s MS Series robotic total stations continuously measure the angles and distances of prisms fixed to structures. As a result, site engineers know immediately when measurement change and structural movement occurs. The technology also includes Matrix Detection software to help increase the measurement system’s speed and accuracy. The company’s TSshield integrated security software, standard on all its total stations, provides remote locking and location positioning data to within 100 meters, depending on GPS and cellular coverage.
“We have been able to integrate this open technology perfectly into our global data management system, which also includes optical fibers sensors, vibrating wire sensors, and others,” said Cementys CEO Vincent Lamour.
Construction of the Grand Paris Express project is taking places in stages and is expected to be complete in 2030.
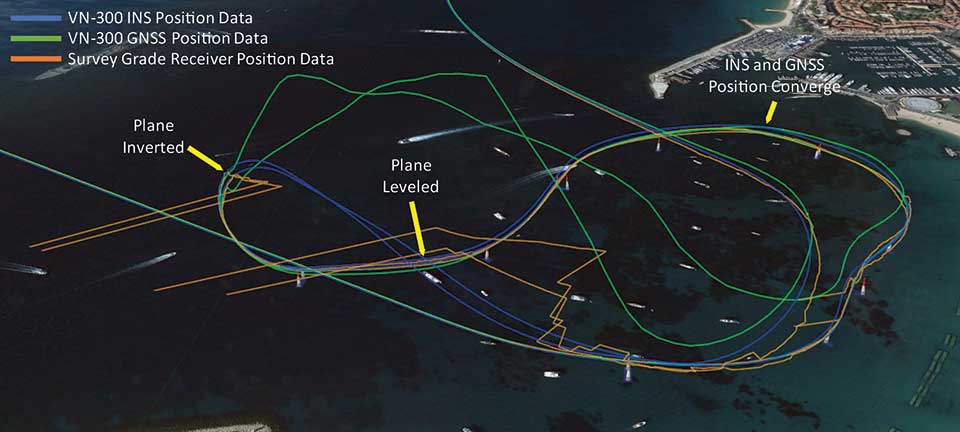
Photo:Position tracks from two laps of the race show that when the plane inverts and starts to track the reflected signal, the VN-300 GNSS/INS (blue trace) reverts to free inertial navigation and propagates the position based on inertial data. The trace follows a smooth trajectory through the next air gate until the GNSS data converges with the INS position. (Image: Google Earth with VectorNav Data)
ABOVE THE SEA
Flying High with Augmented Reality
The 2018 Red Bull Air Race World Championship in Cannes, France, made it easier for fans to follow along. Though pilots race one at a time, the new “Ghost Plane” augmented reality imagery provided fans with a real-time representation of each pilot’s flight, which challenges their speed, precision and skill maneuvering lightweight racing planes.
The Ghost Plane is driven by onboard telemetry data gathered during flight. For a pilot’s run to be accurately represented, the onboard telemetry system has to track position, velocity and attitude (yaw, pitch and roll) through high-dynamic maneuvers and in challenging environmental conditions.
While every Red Bull Air Race track layout is different, they all include a difficult vertical turning maneuver (VTM), where pilots pass through a gate and turn 180 degrees to reverse course quickly without exceeding the g limit.
Each plane is fitted with several GNSS receivers to track the plane, but dynamic maneuvers made during the race rapidly changes which satellites the GNSS receiver can track, which typically results in a loss of position fix.
To further increase the challenge for the telemetry systems, races are commonly held over water, which can reflect GNSS signals and create significant multipath errors at low altitudes. During the VTM, the plane can experience 300°/second angular rates and 12-g accelerations, during which GNSS tracking is typically lost because the antennas no longer point to the sky.
To make the Ghost Planes possible, a VectorNav VN-300 dual-antenna GNSS/INS (inertial navigation system) couples gyroscope and accelerometer data to propagate position and velocity estimates during loss of GNSS measurements through maneuvers such as the VTM.
The VN-300 combines two GNSS receivers with a 9-axis inertial measurement unit (IMU). It couples acceleration and angular rates from the IMU with position and velocity data from the receiver using a quaternion based Extended Kalman Filter (EKF). VectorNav algorithms work in conjunction with the state estimation filter, making the VN-300 more robust and intelligent, and enabling it to reject poor GNSS data and perform accurately in high-dynamic maneuvers and challenging operating conditions.
NEW EQUIPMENT
Antenna Designed for Challenging Environments
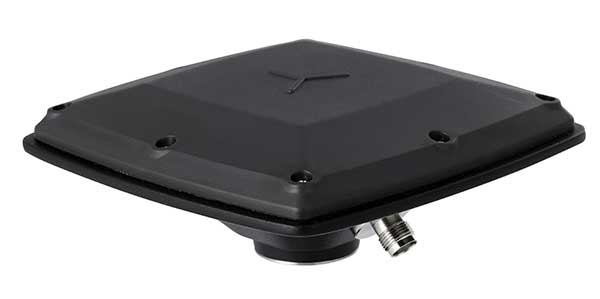
CHC Navigation’s latest GNSS antenna is an example of a product designed specifically for harsh environments.
AT311T antenna. (Photo: CHC Navigation)
The heavy-duty CHCNAV AT311T is designed for demanding applications subject to shocks and vibrations. With advanced filtering and robust signal tracking, it provides survey-grade GNSS signals to enhance position reliability for marine applications, machine control, precision agriculture and industrial automation.
Features include multi-constellation GNSS tracking using GPS, GLONASS, BeiDou, Galileo, QZSS, IRNSS and SBAS. Its IP68 water-resistant design makes it safe to use in extreme conditions with a wide temperature range (–40°C to +85°C). Its internal stacked structure enhances performance in high-interference environments, and the 40-dB signal gains, advanced signal filtering and multipath rejection design provide superior and robust GNSS signal tracking in challenging surroundings.
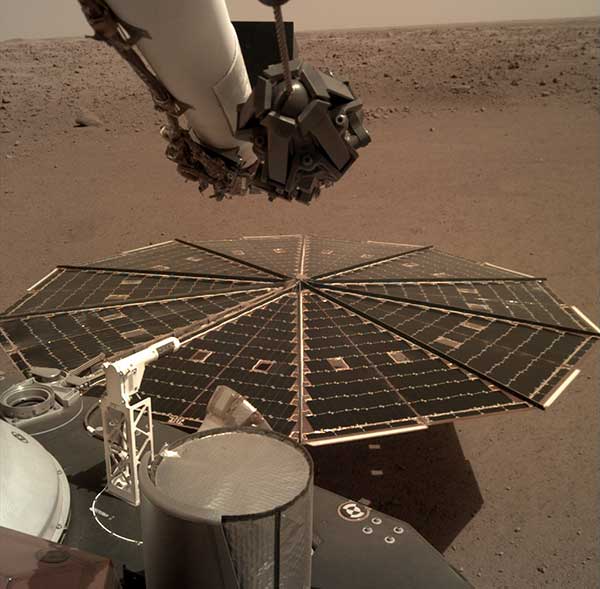
One of the two solar arrays on the InSight lander dominates this view of the plain of Elysium Planum, taken Dec. 4, 2018. (Image: NASA/JPL-Caltech)
IN OUTER SPACE
Exploring Beyond Earth
While GNSS isn’t useful on the surface of Mars, inertial navigation is a key technology for exploration of the red planet. For instance, the Northrop Grumman LN-200S sensor guided the Mars Opportunity rover, which explored Mars for 15 years until a storm struck in June 2018.
The LN 200S sensed acceleration and angular motion, with its data output used by the rover’s control systems for guidance.
The hermetically sealed unit, suitable for planetary and asteroid probes, helped position the rover’s antennae to relay photos and data to satellites. Opportunity beamed back 187,000 raw images, according to NASA.
Because IMUs don’t depend on satellites, they work well for deep space missions, Honeywell explained in a press release.
In November 2018, NASA’s InSight spacecraft landed on Mars to study the interior with a heat probe and listen for marsquakes with a seismometer. Aboard was Honeywell’s Miniature Inertial Measurement Unit (MIMU), an IMU that has been a part of Lockheed Martin’s Mars satellites and landers since 1998.
The MIMU is a three-axis strapdown device specifically designed for the satellite and deep-space-probe market (more than 500 MIMUs have been deployed throughout the solar system). It uses ring laser gyros to help control and stabilize a spacecraft during entry, descent and landing, as well as maintain orbit and payload orientation. The radiation-hardened design supports 15-year missions.
GPS measurements are playing a key role in monitoring the erupting Kilauea volcano in Hawaii.
The floor of the Pu’u ‘O’o Crater started to collapse on April 30, following weeks of uplift and increasing lava levels within the cone and seismicity in the East Rift Zone. The eruptions began on May 3, when a magnitude 5 earthquake struck, causing further collapse of the crater.
The Hawaiian Volcano Observatory (HVO) has monitored volcanic activity on the islands since 1912. The HVO is operated by the U.S. Geological Survey (USGS) and is issuing continuous updates on Kilauea.
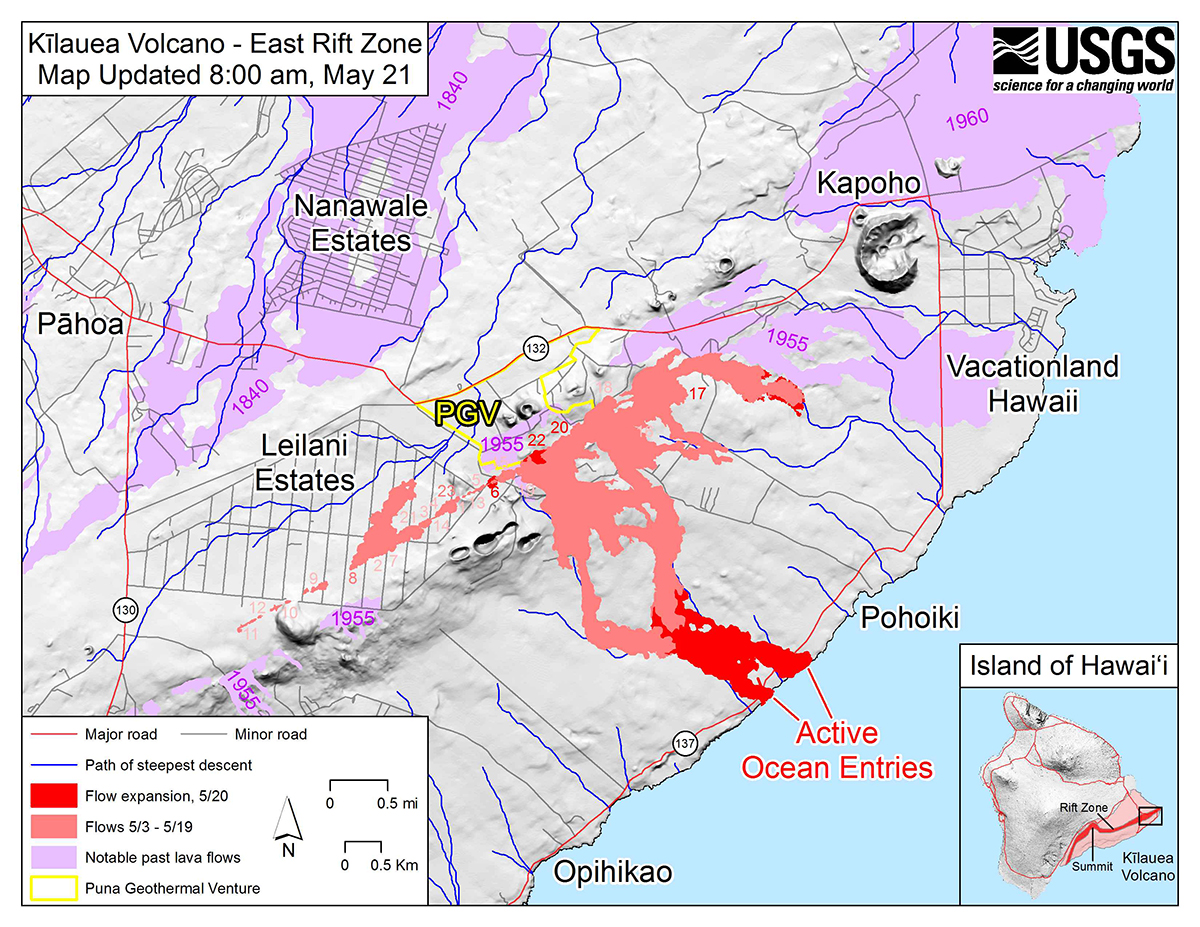
The HVO is closely monitoring the biggest fissures in what is known as the lower East Rift Zone. Geologists are onsite to track ongoing and new fissure activity and the advance of lava flows.
Kilauea eruption map as of 8 a.m. HST, May 21. Shaded purple areas indicate lava flows erupted in 1840, 1955, 1960 and 2014–2015. (Photo: USGS)
GPS stations monitor land movement of Kilauea. The Big Island’s most active volcano has erupted nearly continuously for more than three decades.
“Magma supplied to the Lower East Rift Zone was indicated by the northwest displacement of a GPS monitoring station,” the HVO said in its May 26 status update, but the station ceased movement a few hours later, telling a new story.
“Magma continues to be supplied to the Lower East Rift Zone; however, a GPS instrument near the Lower East Rift Zone is no longer moving, suggesting that the rift zone is no longer inflating in this area,” the HVO stated. “Elevated earthquake activity continues, but earthquake locations have not moved farther downrift in the past couple of days.”
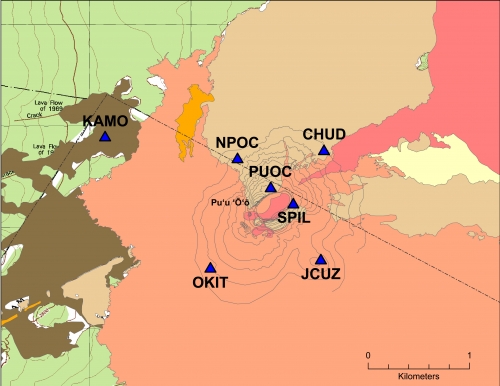
Map of GPS stations installed near the Pu’u O’o vent on Kilauea. (Photo: USGS)
The GPS stations also monitor earthquake activity associated with the volcano. For instance, the May 4 magnitude 6.9 earthquake resulted in seaward motion of 1.5 feet along portions of Kīlauea’s south flank as measured by GPS stations across the volcano.
“Because active volcanoes make for unstable land, highly sensitive seismometers come in handy to track the frequency and strength of micro-earthquakes,” the HVO explained. “Global Positioning System (GPS) devices and another satellite-based technology, InSAR (Interferometric Synthetic Aperture Radar), map ground deformation (inflation and deflation) to within a fraction of an inch while tiltmeters measure slope from ground level. Together, these technologies help track lava’s movement underground and help pinpoint where it might break through the surface.”
lava inundation zones: In this USGS map, colors depict 3 of 18 lava Inundation zones for Mauna Loa. Yellow indicates the volcano’s Northeast Rift Zone, an area along which lava could erupt. The extent of the 1984 eruption and lava flow is superimposed on the map (red).
New U.S. Geological Survey (USGS) maps show areas that could be affected by Mauna Loa lava flows — information critical for response planning. Each zone identifies a segment of the volcano that could erupt lava and send flows downslope.
The volcano has erupted 33 times since 1843. Typically, eruptions began in the summit caldera, with a curtain of fire (a 1- to 2-kilometer line of lava fountains).
Using detailed geologic mapping and modeling of how a fluid (in this case, lava) responds to surface topography, the USGS Hawaiian Volcano Observatory constructed nine maps depicting 18 inundation zones on Mauna Loa, Island of Hawai’i.
Colored regions on these maps show areas on the volcano’s flank that could potentially be covered by flows from future Mauna Loa eruptions. These eruptions could originate from the volcano’s summit, rift zones or radial vents. It’s likely, however, that only part of a zone would be covered in a single eruption.
When a Mauna Loa eruption starts, the maps can help decision makers quickly identify communities, infrastructure and roads between possible vent locations and the coast, facilitating more efficient and effective allocation of response resources, the USGS said. The public can also use the maps to consider where lava flows might go once an eruption starts.
lava flow glow: Had the Mauna Loa inundation maps been available in April 1984, when the volcano last erupted, the maps could have been used to determine that the northern portion of Hilo was the most likely area to be impacted by the main lava flow. (Photo: David Little)
Lava inundation zones: In this USGS map, colors depict 3 of 18 lava Inundation zones for Mauna Loa. Yellow indicates the volcano’s Northeast Rift Zone, an area along which lava could erupt. The extent of the 1984 eruption and lava flow is superimposed on the map (red). (Map: USGS)
New U.S. Geological Survey (USGS) maps show areas that could be affected by Mauna Loa lava flows — information critical for response planning. Each zone identifies a segment of the volcano that could erupt lava and send flows downslope.
The volcano has erupted 33 times since 1843. Typically, eruptions began in the summit caldera, with a curtain of fire (a 1- to 2-kilometer line of lava fountains).
Using detailed geologic mapping and modeling of how a fluid (in this case, lava) responds to surface topography, the USGS Hawaiian Volcano Observatory constructed nine maps depicting 18 inundation zones on Mauna Loa, Hawaii.
Colored regions on these maps show areas on the volcano’s flank that could potentially be covered by flows from future Mauna Loa eruptions. These eruptions could originate from the volcano’s summit, rift zones or radial vents. It’s likely, however, that only part of a zone would be covered in a single eruption.
When a Mauna Loa eruption starts, the maps can help decision makers quickly identify communities, infrastructure and roads between possible vent locations and the coast, facilitating more efficient and effective allocation of response resources, the USGS said. The public can also use the maps to consider where lava flows might go once an eruption starts.
lava flow glow: Had the Mauna Loa inundation maps been available in April 1984, when the volcano last erupted, the maps could have been used to determine that the northern portion of Hilo was the most likely area to be impacted by the main lava flow. (Photo: David Little)
Pictured are the Three Sisters volcanoes in Central Oregon. Photo: USGS / Lyn Topinka
Septentrio has completed delivery of PolaRx5 multi-constellation GNSS reference receivers and antenna systems to the U.S. Geological Survey (USGS).
The monitoring systems will be deployed through the Volcano Hazards Program (VHP) for volcano monitoring stations in Alaska and at various international locations through the Volcano Disaster Assistance Program (VDAP) — a cooperative effort between the USGS and the U.S. Agency for International Development’s Office of U.S. Foreign Disaster Assistance.
The PolaRx5 receivers take full advantage of the new 5.1.0 firmware which includes support for onboard PPP and dynamic response tuned for seismic applications. The PolaRx5 tracks all visible signals from Galileo, GPS, GLONASS, BeiDou, IRNSS and QZSS constellations. It provides measurement quality and robust interference mitigation through Septentrio’s patented AIM+ technology. The PolaRx5 supports these advanced features and more with a power consumption that is scalable from less than 2.0 watts.
“USGS and their partners will be among the first to exploit the PolaRx5’s seismic monitoring features,” said Neil Vancans, vice president of Septentrio Americas. “The PolaRx5 is Septentrio’s most complete GNSS receiver to date and provides the ideal upgrade for modernizing any continuously-operating reference station (CORS) network.”
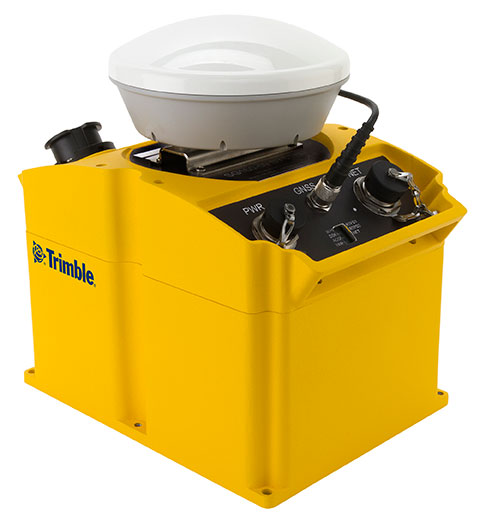
Trimble has introduced an integrated GNSS reference receiver, broadband seismic recorder and a force-balance triaxial accelerometer for infrastructure and precise scientific applications.
The Trimble SG160-09 SeismoGeodetic system provides real-time GNSS positioning and seismic data for earthquake early warning and volcano monitoring as well as infrastructure monitoring for buildings, bridges, dams, as well as other natural and manmade structures.
The Trimble SG160-09 SeismoGeodetic system combines the innovation, reliability and data integrity of both the Trimble and REF TEK brands into a single instrument, Trimble said. The system integrates seismic recording with GNSS geodetic measurement in a single compact, ruggedized package. It includes a low-power, 220-channel GNSS receiver powered by the latest Trimble-precise Maxwell 6 technology and supports tracking of both GPS and GLONASS signals plus the Galileo E1 frequency.
The system includes both the SG160-09 and utilization of Trimble’s CenterPoint RTX correction service, which provides on-board GNSS point positioning. Based on Trimble RTX technology, the service utilizes satellite clock and orbit information delivered over cellular networks or Internet Protocol (IP), allowing cm-level position displacement tracking in real-time anywhere in the world. The SG160-09 system will be available for purchase without the RTX correction service for those applications using real-time kinematic (RTK) positioning.
The seismic recording sensor includes an ANSS Class A, low-noise, force-balance triaxial accelerometer with the latest, low-power, 24-bit A/D converter, which produces high-resolution seismic data. The internally built accelerometer has +/- 4g full scale output, large linear range, high resolution and sensitivity, which makes it ideal for both portable and permanent deployment. The SG160-09 processor acquires and packetizes both seismic and geodetic data and transmits it to system operators using an advanced, error-correction protocol with back-fill capability providing data integrity between the field and the processing center.
The SG160-09 system is ideal for earthquake early warning studies and other hazard mitigation applications, such as volcano monitoring, building, bridge and dam monitoring systems. The SG160-09 system features a variable size industrial grade USB drive to support real-time telemetry data transmission. In the event of a telemetry link outage, the data is stored on the USB drive and can be re-transmitted to the centralized processing station as soon as the communication link comes back up, allowing no data loss during the system operation.
The Trimble SG160-09 system is optimized for field use with instrument mounted or externally mounted GNSS antenna configurations. The lightweight yet rugged SG160-09 consumes very little power and can be used for projects with remote connectivity and in extreme weather conditions. Because the SG160-09 combines both GNSS and strong motion in a single instrument, site installation time is reduced, data communications flow through a single pathway, and station power infrastructure is streamlined, making the SG160-09 a cost competitive solution compared to other systems on the market today. It has an IP67 rating, which means it is sealed against dust and can be submerged in water up to a meter for approximately 30 minutes. The SG160-09 also meets MIL-STD 810F standard for drops, vibration and temperature extremes.
“The SG160-09 is another example of Trimble’s on-going focus in GNSS and seismic technology for the scientific and engineering communities,” said Ulrich Vollath, general manager for Trimble’s Infrastructure Division. “Trimble has developed a combined state-of-the-art GNSS receiver with a high-dynamic range, low-noise accelerometer that provides dynamic monitoring with the flexibility required for today and tomorrow’s challenges.”
The Trimble SG160-09 SeismoGeodetic system is expected to be available in the fourth quarter of 2014.
“In an ever-changing environment, it would be ideal if the U.S Geological Survey had a presence in every corner of the nation. While we may not be able to cover every inch of the landscape, we can greatly enhance our scope with your help,” the USGS continues.
The USGS has a variety of citizen science efforts where people can report what’s happening in their own backyards. It’s seeking information on events such as earthquakes, landslides, new construction, and climate. “If you live in Alaska, we want you to tell us if you experience a volcanic ash fall and even collect a sample,” the USGS said.
The information gets aggregated and disseminated through a variety of tools geared toward making this information easily accessible so it can be put to use. Using , there are interactive online systems where people can report what it was like during an earthquake, and then see all the reports for that event mapped out for the affected area.
“Through your contribution, not only will your observations build a much larger and more complete database, but you will also become a virtual member of the USGS scientific team!” the USGS said.
Map of tweets containing the word “terremoto” (Italian for “earthquake”) collected in the two minutes following a magnitude 6.0 earthquake in Northern Italy on May 5, 2012. The red star shows the location of the earthquake. The tweets are concentrated in the epicentral area but discussion of the earthquake has already spread beyond the impacted region. This shows the speed that USGS Tweet Earthquake Dispatch (TED) collects tweets to provide insight into potential earthquake events. Image Credit: USGS.
The valuable role of crowd-sourcing data is outlined in a 2013 report by the Woodrow Wilson International Center for Scholars, authored in collaboration with the USGS. The report highlights success stories from the USGS’ Tweet Earthquake Dispatch (@USGSted) program, Did You Feel It? and related USGS activities. For example, although there was an exceedingly swift international aid response to the massive 2008 earthquake in Wenchuan, China, the first reports of the event outside of the impacted area came from citizens, and information spread through the use of social networking tools such as Twitter. Similarly, 148,000 individuals used Did You Feel It? to describe their experience of a magnitude 5.8 earthquake that occurred in Virginia on August 23, 2011. Because large-magnitude earthquakes are fairly rare along the East Coast, there were only a handful of seismometers installed nearby to record the event. Thus, much of the preliminary data regarding this earthquake came from the DYFI? system.
These are the ways USGS gathers information from the public:
Improving Earthquake Monitoring
Did You Feel It? (DYFI?) is an online crowd-sourcing system developed by the USGS for the public to provide first-hand accounts of earthquakes they experience. As one of the longest standing and most successful examples of citizen-based science to date, it has garnered more than 2,790,000 total responses since its launch in 1997.
Through this program, users are able to document the shaking level they experienced and find out what was felt elsewhere. Specifically, USGS scientists aggregate results by zip code (domestically) and by city (globally) to show reported shaking intensity. Those reports also augment shaking data from sensors and are incorporated in ShakeMaps used for emergency response. To document a seismic encounter, visit the DYFI? home page and fill out a brief questionnaire.
Tweeting and Shaking
Many regions around the world have only a scant number of seismometers, complicating the rapid detection and characterization of earthquakes. To enhance earthquake monitoring, Twitter has proven to be an advantageous source for USGS scientists to receive rapid firsthand accounts of potential events.
The USGS Tweet Earthquake Dispatch (TED) program rapidly detects possible earthquakes when a large number of public tweets mention “earthquake” or its equivalent in several languages. These tweet-based detections often come prior to sensor alerts in sparsely instrumented regions. USGS analysts at the National Earthquake Information Center (NEIC) receive these indicators and then turn to more accurate earthquake sensors and instrumental data for confirmation and quantitative assessment. For earthquakes with a magnitude 5.5 or greater, the USGS sends out notifications via the Twitter account @USGSted to people around the world.
Did You See It? Watch Out for Landslides
In an average year, landslides can cost the United States up to $2 billion in damage. Now, scientists at the USGS are asking the public to help track landslides to better understand how to protect lives and property. This is being done through the system, Did You Feel It? This program allows respondents to report detailed accounts of observed landslides, including photographs. To make your contribution, visit the DYSI? webpage and click on the Report a Landslide tab.
Ascending eruption cloud from Redoubt Volcano as viewed to the west from the Kenai Peninsula. Photo Credit: R.J. Clucas, USGS.
Is Ash Falling? Helping Monitor Volcanic Eruptions
This tool will help AVO scientists build a more complete record of the amount, duration, and extent of ash fall. Getting first-hand accounts of ash fall will also help refine computer models of ash cloud movement and interpretation of satellite imagery. Citizens are also encouraged to collect ash samples and send them to AVO. With your help, volcano scientists can greatly expand their sampling of ash deposits.
The National Map Corps
Citizen volunteers are also making significant additions to The National Map (TNM), a web-based geospatial visualization platform. The public is encouraged to collect data on manmade structures such as schools, hospitals, post offices, police stations, and other buildings. The project started in 2012 in Colorado and has expanded to 35 states. A recognition program has also been created where badges can be earned based on the number of data points a volunteer contributes. This effort is through The National Map Corps (TNMCorps) Volunteered Geographic Information project, which partners with organizations such as 4-H and GISCorps.
Observing Nature’s Calendar
As the seasons come and go, temperatures fluctuate, leaves emerge and change colors, and animals migrate. The USA National Phenology Network gives you this opportunity through its program Nature’s Notebook. Volunteers are collecting observations of these seasonal changes—referred to as phenology—to help scientists better understand subjects including climate change, invasive species, agricultural production, impacts of frosts and freezes, and the timing of pests and diseases.