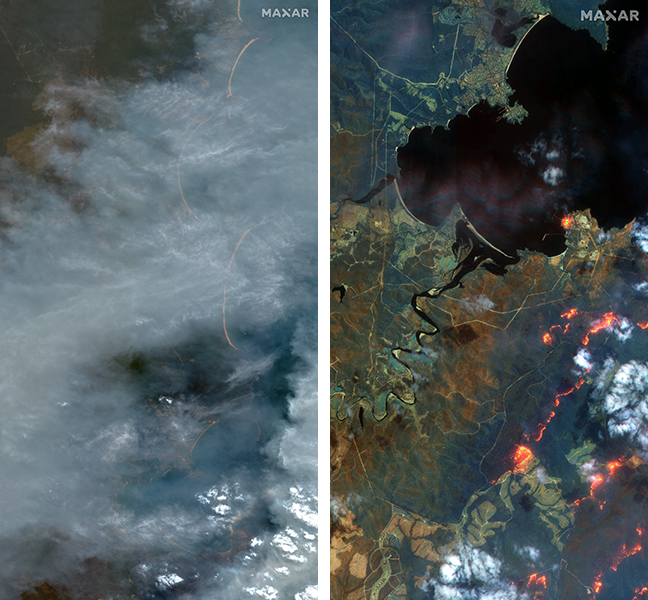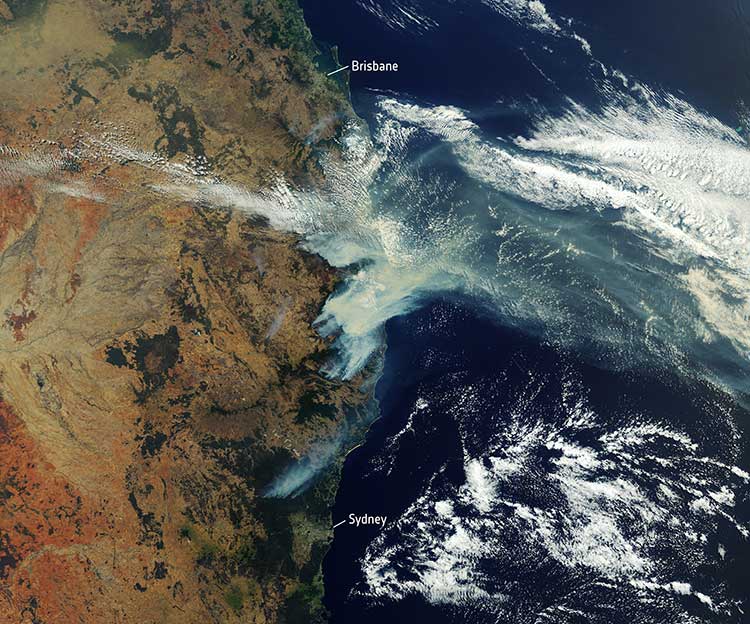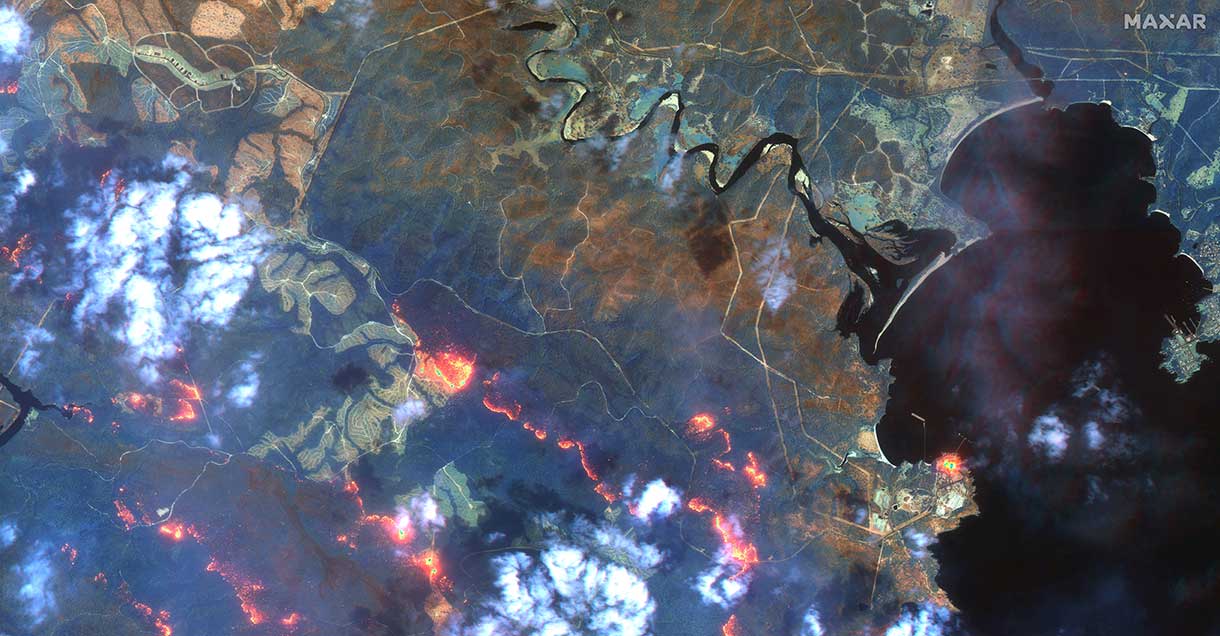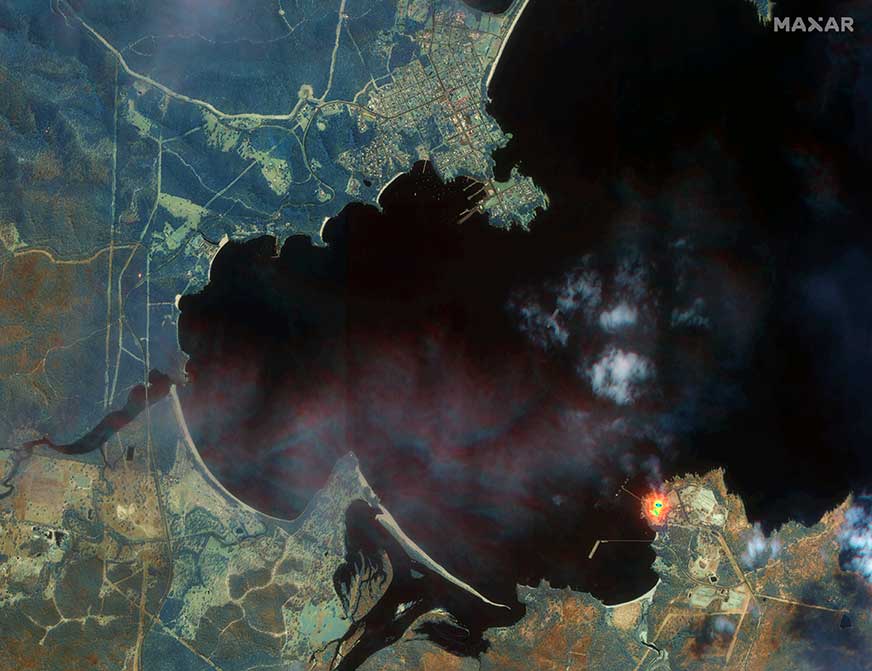
It is no secret that the world has been burning for months. Devastating wildfires have encompassed Greece, Canada, the United States, and other parts of the world. These wildfires have incinerated entire communities, taken lives, and has had disastrous environmental effects. This wildfire outbreak can be attributed to several factors, but mainly the global climate crisis.
Why are these wildfires a monumental problem?
Widespread wildfires displace of thousands of people from their homes, raze entire communities and cities, wipe out farmland and other essential resources, create horrific air pollution — that causes inflammation of lung tissue and increases vulnerability to infections — and many other devastating effects.
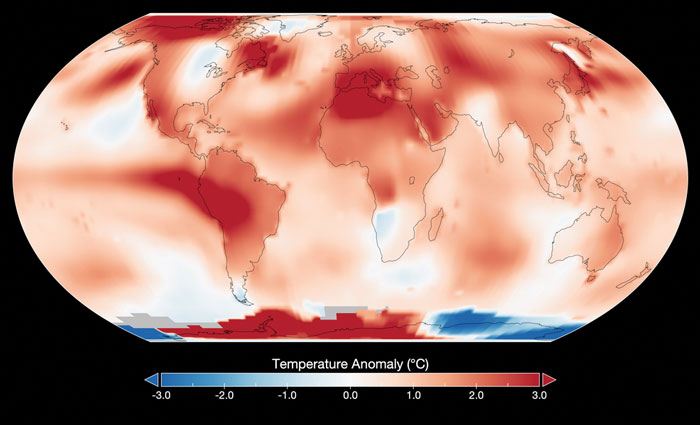
As reported by NASA, July has been the hottest month on record since the 1880’s. This has caused extreme dry conditions that are ideal for wildfire outbreaks, among other natural disasters.
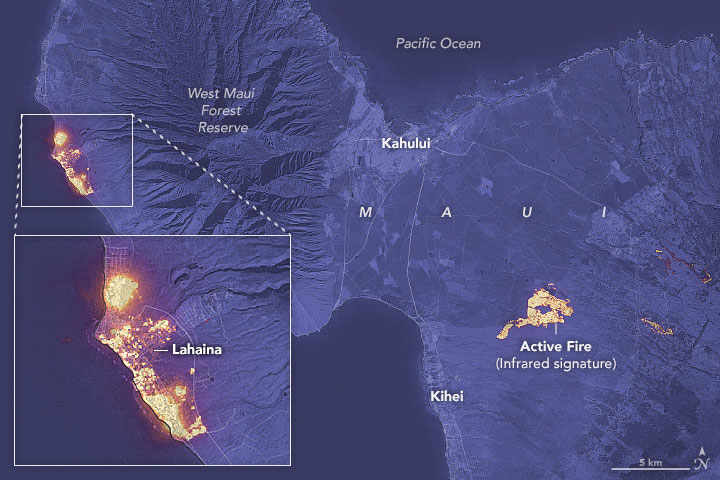
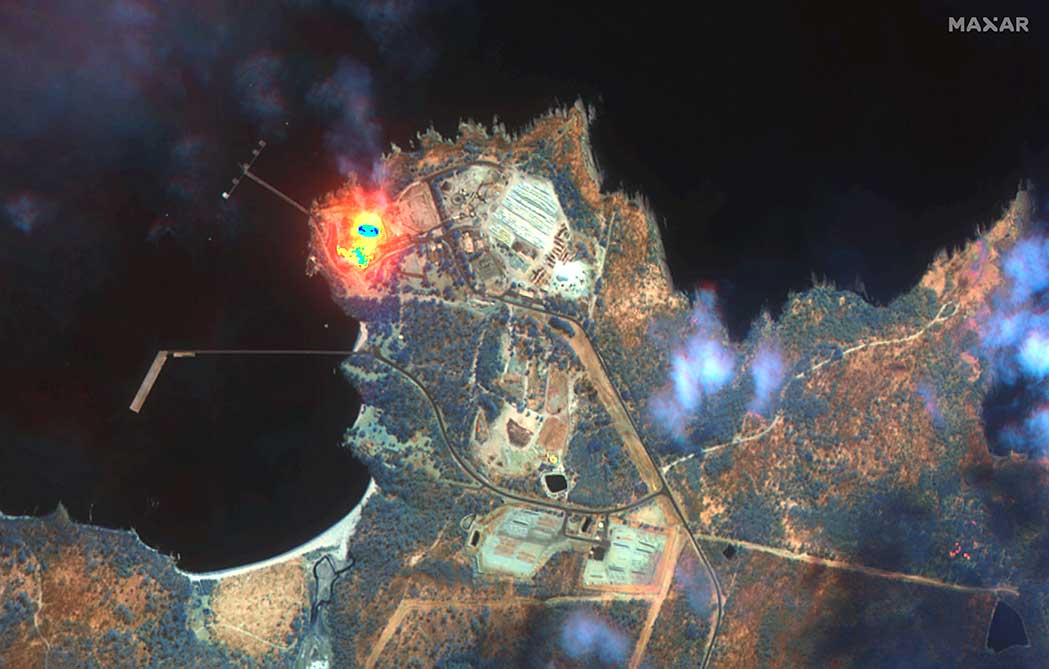
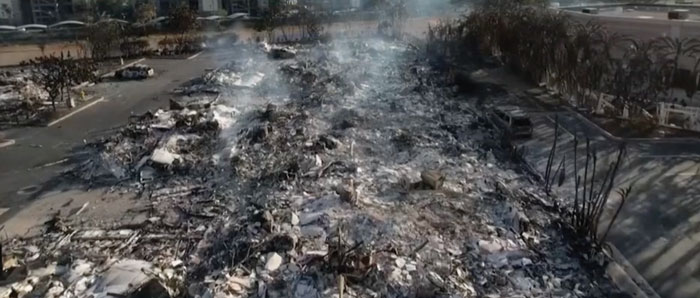
Flames engulfed parts of Hawaii the morning of Wednesday, August 9, which destroyed a centuries-old town and killing at least 106 people as of August 16. The wildfires took natives and tourists on the island by surprise. Residents and tourists were forced to evacuate the area – including some who reportedly jumped into the ocean to escape the flames. The National Weather Service stated the combination of high winds and low humidity is what caused the dangerous fire conditions across the island. The devastating fire left behind burned-out cars on once busy streets and smoking piles of debris where historic buildings once stood.
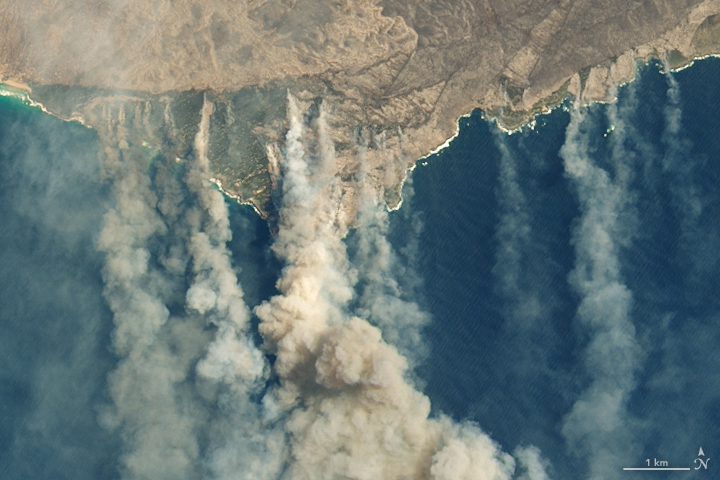
The Greece wildfires swept across the island of Rhodes, Corfu and Evia in July, creating thick clouds of smoke and forcing thousands of people the evacuate. These fires were caused by several human imposed factors such as campfires, arson and sheer negligence. However, the deadly heatwave that scorched Europe this summer — caused by carbon emissions — has not helped prevent the start and spread of these wildfires.
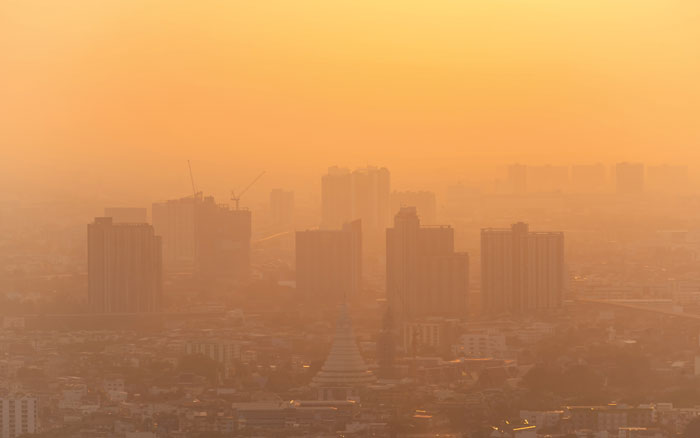
The Air Quality Index (AQI) measures the density of five pollutants: ground-level ozone, particulates, carbon monoxide, nitrogen dioxide, and sulfur dioxide. It was originally established by the Environmental Protection Agency to communicate the cleanliness of the air Americans are breathing every day. The index runs from zero to 500 — the higher the number the more polluted the air is. Effects of air pollution can range from mild symptoms, such as eye and throat irritation, to serious ones such as heart and respiratory issues. Pollution can cause inflammation of the lung tissue and increase the vulnerability to infections.
During wildfires, fine particles in the soot, ash and dust can fill the air. The AQI identifies the concentration of particles smaller in diameter than 2.5 μM. When these particles are inhaled, the tiny specks can increase the risk of heart attacks, cancer, and respiratory infections — especially in children and older adults.
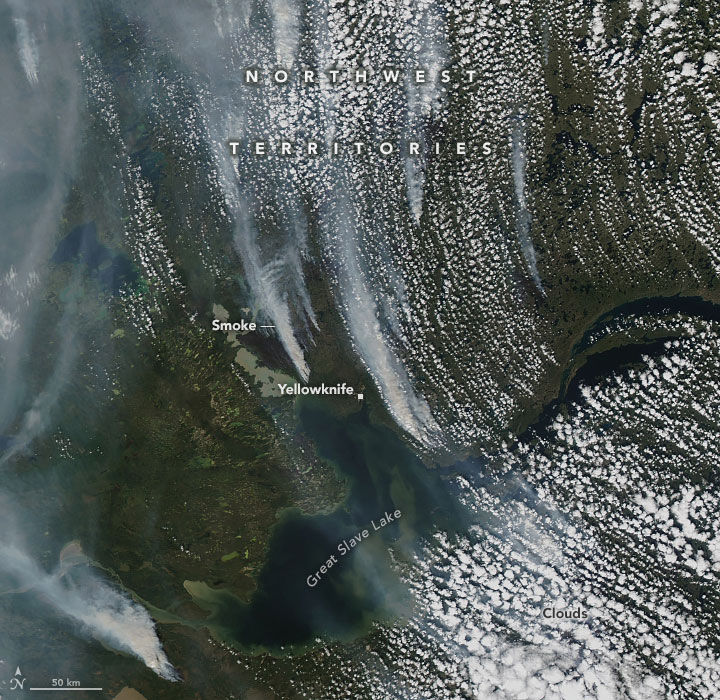
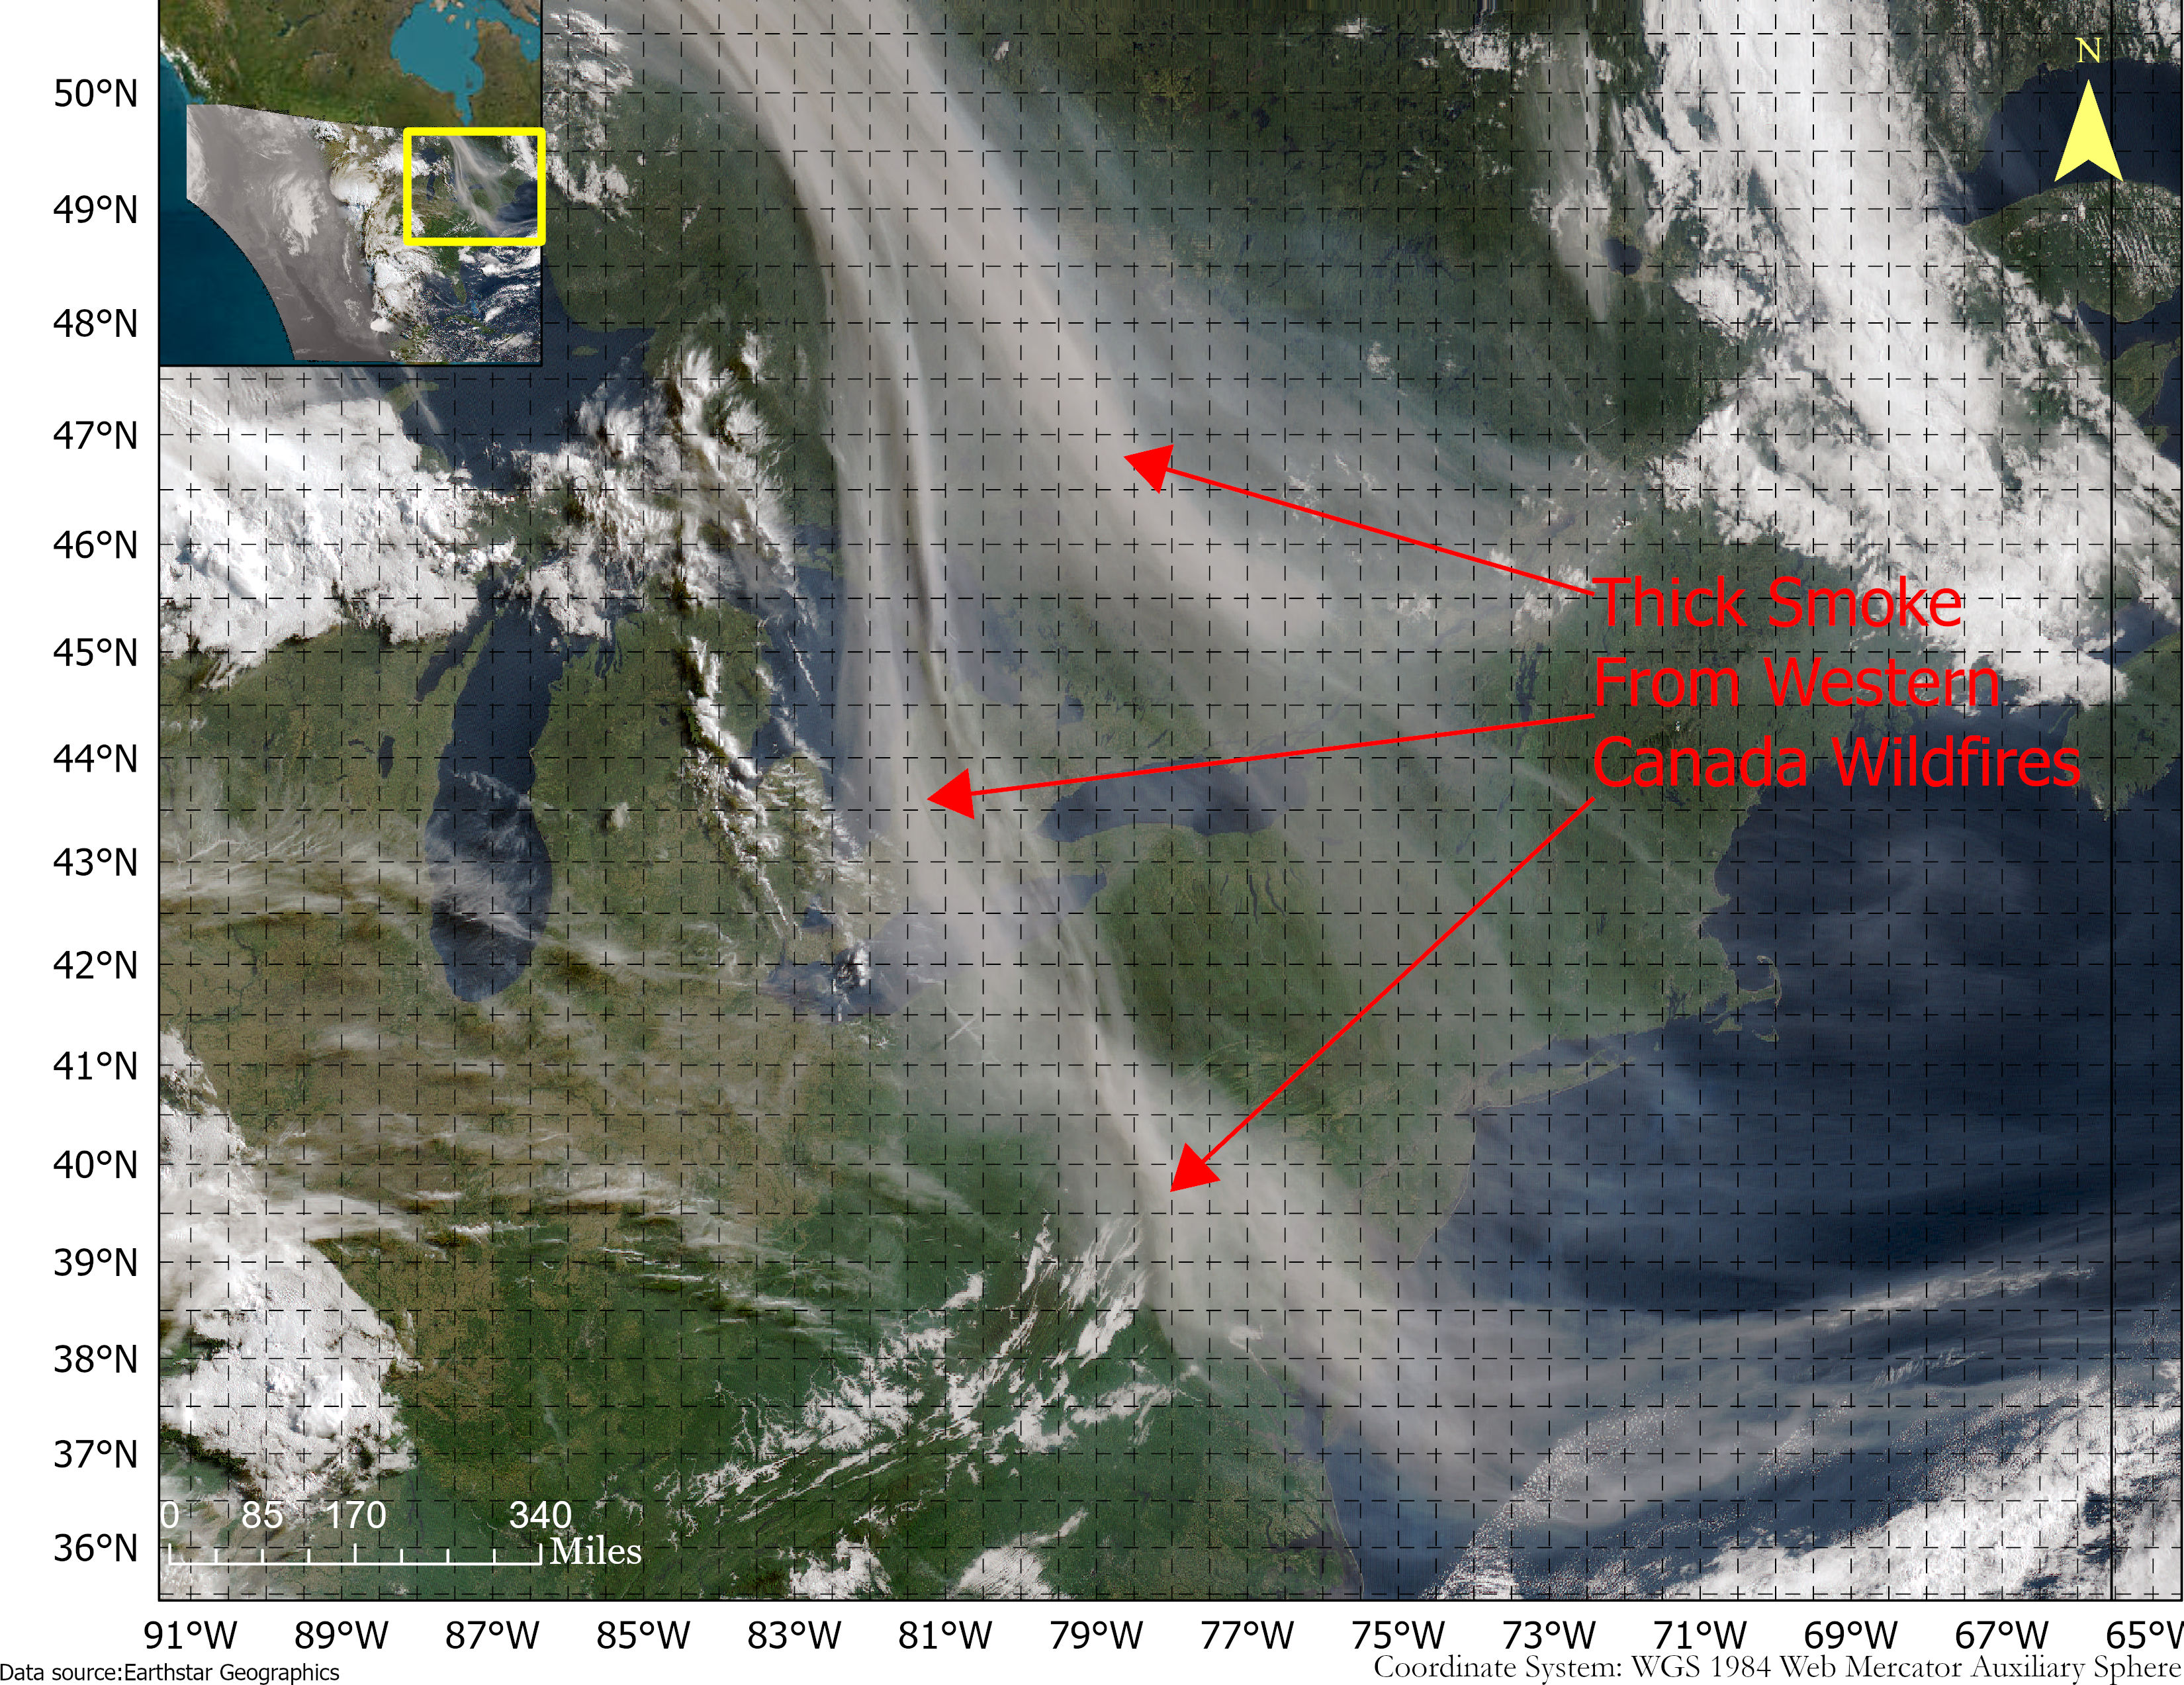
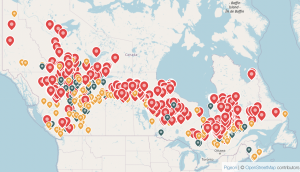
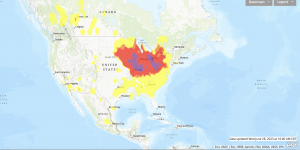
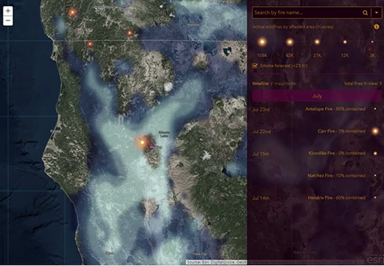
Based on data from the Canadian Interagency Forest Fire Centre, there are 1037 active fires in Canada: 652 are out of control, 161 are being held in place, and 224 are under control as of August 23. Many of these fires were caused by lightning; however, with above-average temperatures this year and dry conditions, wildfires have been breaking out in Canada since May.