The City of Sebring, Florida, has deployed TerraGo Edge for utility asset inspection and management. According to a TerraGo press release, using its software has enabled the city to cut costs, bring surveys in-house and improve response times for repairs.
Like thousands of water utilities across the United States, the City of Sebring Utilities Department is tasked with providing a safe and reliable water supply, while managing all the dispersed assets of the water distribution and wastewater systems. To do this, Sebring needs to constantly locate, map and inspect the assets to maintain service levels and operations.
To avoid the high cost of traditional GPS technology and services, Sebring researched mobile products to see if other organizations had field success using iPads and iPhones to do the work. They found TerraGo Edge could deliver custom forms, CAD diagrams and survey-grade accuracy.
“The deployment of TerraGo Edge saved the City of Sebring the expense of a traditional GIS and GPS solution, as well as the cost of surveying services, which could have run over $300,000,” said Mark Kretz, Water Plant Operations. “On a day-to-day basis, the biggest benefit is that we get the ease of use of an iPad, and didn’t have to buy and utilize proprietary GPS handhelds, which are more complex and vastly more expensive.”
A jammer-hunting UAV employs a radio frequency (RF) detection system and a navigation control scheme. The RF detection component uses a directional antenna and the unmanned aerial vehicle’s (UAV’s) ability to rotate to determine a bearing to the jammer. The navigation control scheme selects a trajectory for making bearing measurements that enable rapid jammer localization, based on three bearing calculation methods: max, cross-correlation, and a modification of max leveraging the shape of the antenna’s main lobe, known as max3.
By Adrien Perkins, Louis Dressel, Sherman Lo and Per Enge
Whether malicious or unintentional, GPS jamming events have already proven to disrupt airports and pose an increased risk to commercial aviation in the future. An important mitigation for this risk is the ability to rapidly locate and interdict the GPS jamming device.
Directional antenna mounted on underside of UAV.
The system must be capable of reliably determining jamming direction and quickly localizing the source in the semi-urban environments typically found in and around airports. This article examines both aspects.
In developing a localization algorithm, the measurements being made by the system can greatly impact performance. Using a directional antenna as the primary sensor, our multirotor platform Jammer Acquisition with GPS Exploration & Reconnaissance (JAGER) can measure the bearing to the jammer, which is the main input into the localization algorithm. Here we examine three different bearing calculation techniques from a gain pattern: max, cross-correlation and max3.
The closed-loop navigation controller uses the gathered information to determine where to go next to most quickly localize the jammer. In this article, the localization objective is modeled as a partially observable Markov decision process (POMDP) to determine the optimal route. The viability of this technique for locating the jammer source is demonstrated through flight testing in a simulated environment.
PROBLEM OVERVIEW
Because our vehicle is an agile, multirotor UAV, it can translate, climb, rotate and make received signal strength indicator (RSSI) measurements at the same time. It is computationally difficult to reason over such a large input space. Therefore, to simplify the problem, we constrain the vehicle to a constant altitude and assume a single, stationary jammer. We also decouple the problem into two actions: rotating — to measure bearing, and moving — to another measurement location.
This article focuses on the first action: How accurately can bearing be estimated if the vehicle samples RSSI values while rotating in place, and how can those measurements affect the decisions of where to rotate next?
POMDP Formulation. The problem of choosing successive rotation locations has been formulated as a POMDP. POMDPs are a principled approach to decision making and closed-loop control in stochastic domains.
At each time step, the problem can be described by a state s ϵ S, where S is the state space, or set of all possible states. To limit the size of the state space, the search area is split into a grid. A state consists of four state variables: the vehicle x-index xv, the vehicle y-index yv , the jammer’s x-index xj , and the jammer’s y-index yj. At each time step, the state is only partially observable — the jammer’s position is unknown.
At each time step, the vehicle can take some action a ϵ A, the set of available actions. In our formulation, the vehicle can travel to any of the neighboring grid cells, rotate in place to make a bearing measurement, or simply hover, resulting in 10 possible actions. After taking action a from state s, the problem will transition to some state s’.
At any time step, the state is unknown to the vehicle. Instead, it makes an observation o ϵ O, where O is the set of all possible observations. In our problem, these observations are the bearing measurements made when the vehicle rotates. To reduce the number of possible observations and computational complexity, the bearing measurements are discretized and include a “null” observation when the vehicle cannot determine a bearing.
The POMDP formulation includes an observation model Z(a, s’, o) = P(o | a, s’) describing the probability of making observation o after taking action a and transitioning to state s’. This probability is a function of the bearing measurement quality. Prior to the work presented here, it was assumed bearing measurements had zero-mean Gaussian noise with a 10-degree standard deviation. It was also assumed that if the vehicle rotated in the same grid cell as the jammer, it would receive the null measurement, because the space directly under the vehicle is outside the main lobe of its directional antenna. An updated observation model, using the characterization performed in this work, can be found in the section entitled “Effect on Algorithm.”
Although the vehicle is unaware of the true state, it maintains a probability distribution over the state space, called a belief, denoted b. After taking an action and making a new observation, Bayes’ law is used to update the belief. This updated belief is used in conjunction with policy π to determine the next action to take. A policy π(b) maps beliefs to actions.
Due to the large belief space, this research uses SARSOP, which allows a policy to be computed offline and uploaded to the vehicle before a mission. The vehicle then relies on this policy to make decisions while in flight.
Generating a policy requires a reward model that encourages the vehicle to perform certain actions. In our formulation, we reward the vehicle when it stops in the grid cell containing the jammer. This encourages the vehicle to first find the jammer, which is our goal. We give penalties for movement and rotations to reflect the time taken to perform them.
EXPERIMENTAL SETUP
Our jammer-hunting UAV, JAGER, is a commercially available DJI S1000. The S1000 is made to carry film-grade cameras, but we’ve modified it to carry our experimental payload. For control and navigation, the vehicle is equipped with a Pixhawk autopilot system running a custom version of the PX4 firmware. The Pixhawk has sensors to determine the vehicle’s attitude, altitude, and position. The localization decisions are made on the flight computer, which is an Odroid-U3 ARM-based computer that communicates with the autopilot throughout the flight. All signal strength measurements are made with a directional yagi antenna connected to the RN-XV WiFly module. A schematic of this configuration and the flow of information can be seen in Figure 1.
Figure 1. Schematic of components on UAV.
Given the small size of this payload, the flight time achieved during testing was 20 minutes on 4 pounds of batteries (two 6-cell 8000-mAh batteries).
Signal Source. Due to restrictions on active interference with GPS signals, a 2.4-GHz Wi-Fi router was used as a proxy jammer for all our flight testing. The Wi-Fi router was placed on the ground at a surveyed location. In these tests, GPS was used for navigation as we are still developing alternate and GPS jamming resistant navigation.
Antenna. A single the L-com HG2409Y yagi antenna was used for this experiment. This 2.4-GHz Wi-Fi antenna has a 60-degree beam width both horizontally and directionally as shown in Figure 2. As depicted in the opening graphic, the antenna was mounted below the vehicle in order to have the clearest view to a ground based signal. Furthermore, the antenna is placed angled down at 30 degrees in order to have the main lobe of the antenna extend out to the horizon. This also leaves a cone underneath the vehicle with a weak signal that was aimed to be leveraged as a null measurement when over the jammer.
Figure 2. Directional antenna gain pattern from datasheet: vertical, left; horizontal, right.
While we are currently using a Wi-Fi-based system to stand in for GPS, we eventually plan to test this system on a true GPS jammer. Despite the different frequencies, the same methodology and approach will be able to be used when localizing a GPS jammer. The biggest change the system will require is the antenna required to make bearing measurements. For Wi-Fi, we have been able to successfully use an off-the-shelf directional antenna, but for GPS either a custom directional antenna or a dual-antenna solution will be needed.
Measurements. Throughout the UAV’s flight, the directional antenna makes RSSI measurements at 2 Hz. To calculate bearing from a given location, the vehicle simply rotates at a rate of 15 degrees/second at that position and combines all of the RSSI measurements using magnetometer data to form the antenna’s gain pattern. This gain pattern can then be used to estimate the bearing of the signal source from that given position. In this paper that bearing calculation is done with three different methods: max, cross-correlation and max3.
The max method simply finds the maximum RSSI value in the measured pattern and uses that heading as the bearing to the jammer.
The cross-correlation method normalizes the measured pattern and compares it with the known truth pattern for the antenna. The truth pattern is shifted by some angle γ. The cross-correlation is computed for every possible shift γ. The shift yielding the highest cross-correlation coefficient is taken to be the bearing to the jammer.
To get our truth pattern, we sampled RSSI every 10 degrees at distances ranging from 10 to 40 meters, normalized the resulting patterns, and took the mean of these normalized patterns.
The max3 method is an improvement on the max method where the bearing is the mean of the bearing of the two crossings of 3 dB below the maximum RSSI value for the pattern, as depicted in Figure 3.
Figure 3. Depiction of Max3 method.
Flight Area. Test flights were performed at the Joint Interagency Field Experimentation (JIFX) event hosted by the Naval Postgraduate School. Most measurement were taken at an altitude of 100 feet AGL with a handful of measurements made near the signal source at an altitude of 50 feet AGL. When the localization algorithm was tested, a 9 by 9 grid (each cell 11 meters on a side) was used as the world, with the signal source located in the top right cell and the vehicle starting in the center cell, 62 meters from the signal source.
RESULTS
During flight tests with the JAGER vehicle, 88 different experimental gain patterns were created, and bearing calculations were made with each of the three previously described methods.
The POMDP-based localization algorithm was successfully executed to locate the signal source. Leveraging the performance results of the cross-correlation and max3 methods, the model for the POMDP was updated and produced a significantly different flight profile. In addition to the POMDP-based localization algorithm, a baseline algorithm was also used to demonstrate the advantages of the POMDP-based algorithm.
Effects of Distance. Throughout the experiment, measurements were made at distances from the signal source ranging from directly overhead to almost 350 meters away. Figure 4 shows all the locations in which measurements were taken during flight tests, with the signal source in the center of the main grouping. Each marker represents one measurement, and its color represents roughly the maximum RSSI value measured at each location. As expected, as the vehicle traveled further from the signal source, the maximum RSSI value measured dropped. Near the signal source, the signal is no longer captured by the main lobe, which result in poor measurements, as can be seen by the grouping of orange and red markers near the source.
Figure 4. Location of all experimental gain pattern measurements colored by signal strength (from -65dBm, green, to -80dBm, red).
MEASUREMENT CLASSIFICATION
Because of effects of distance on the measurements and the configuration of the antenna on the vehicle, all measurements were split into three classifications: near, ideal and far.
Near. Near measurements are measurements made where the signal source is within the cone underneath the vehicle, where the main lobe of the antenna no longer reaches. When the signal source was near the vehicle, we did not obtain null measurements, but rather obtained gain patterns such as the one shown in Figure 5. These gain patterns do not resemble the ideal gain pattern of the antenna due to the noise in the measurements from the signal source not being picked up by the main lobe, making it challenging for any of the bearing calculation methods to successfully determine the bearing.
Figure 5. Gain pattern at 7 meters from signal source (Near).
Far. Far measurements are any measurement further than 200 meters from the signal source. At these distances, the RSSI measurements were at or below the receiver sensitivity. At these distances, the resulting gain patterns no longer had enough measurements to clearly resemble the ideal gain pattern of the antenna. Figure 6 shows a gain pattern from 250 meters away with a true bearing of 267 degrees and demonstrates the partial pattern that is measured. The cross-correlation estimate of 182 degrees suffers from the inability to match the partial pattern with the required truth pattern. On the other hand, the simplicity of the max and max3 methods result in more accurate estimates of 271 and 285 degrees, respectively.
Figure 6. Gain pattern at 250 meters from signal source (Far).
Ideal. This leaves the ideal category, which is any measurement made between near and far. At this distance, the signal source was able to both be within the main lobe of the antenna and within reasonable rage of the WiFly’s sensitivity. In the ideal range, the gain patterns produced resemble the true pattern of the antenna, as shown in Figure 7.
Figure 7. Gain pattern at 26.6 meters from signal source (Ideal).
In the flight tests, the majority of the measurements taken were in the ideal range. Only a few measurements were made in the far range so no detailed analysis is presented for measurements in the far range.
BEARING METHODS PERFORMANCE
An overview of the standard deviation of all the results can be seen in TABLE 1.
Table 1. Standard deviation [deg] of calculated bearing for each method.As expected, each of the methods had approximate zero mean Gaussian error distributions for the overall and ideal cases as depicted in Figure 10 for cross-correlation. Overall, Max3 outperformed the other two methods. The noise in the measurements near the signal source made each of these methods unreliable, with all three having very high standard deviations as shown. At ideal distances, max3 and cross-correlation performs similarly while max is a little worse.
Figure 10. Distribution of errors for cross-correlation technique for different distance classifications.
The proper characterization of the antenna is vital to the performance of the POMDP localization algorithm. Using the results presented with the max3 and cross-correlation methods, the POMDP model can be updated to better reflect the measurements in order to improve the flight profile for localization.
Max. The max method is the simplest method used to calculate the bearing to the signal from a given set of measurements. This method is also the reason for the poor performance in calculating the bearing. This method can too easily pick a wrong estimate if there is a spike in what should be a smooth main lobe as depicted in Figure 11. These spikes cause a large spread in the errors in calculating bearing seen in Figure 8.
Figure 8. Bearing error as a function of distance for max technique.
Cross-Correlation. Cross-correlation is the most complex of the methods used and in the ideal range is one of the best performing methods (on par with the max3 method).
The overall performance of the cross-correlation suffered from the poor performance near and far from the router. Since this method requires a known truth pattern, when the experimental measurements don’t yield enough results to create a full pattern, the cross-correlation can mistakenly identify the partial pattern for a side lobe instead of a main lobe as was seen in Figure 6.
In the ideal range, it greatly outperforms the max method as expected. When looking at the bearing error shown in Figure 9, it can be seen that the errors are much more tightly grouped near zero than those seen in Figure 8 for the max method. The outliers for the far measurement caused by a failure to match the partial patterns to the truth can also be clearly seen in this figure.
Figure 9. Bearing error as a function of distance for cross-correlation technique.
The increase in performance from near to ideal can clearly be seen in Table 1, where the standard deviation of the error is significantly smaller for the ideal case.
Max3. Max3 is the strongest of the three bearing calculation methods tested; overall, it performed the best and max3 has the advantage of simplicity over cross-correlation. It can perform on par with cross-correlation in the ideal range as can be seen by the similarly close error groupings in Figures 12 (max3) and 9 (cross-correlation) and by the similar standard deviations seen in Table 1.
Figure 12. Bearing error as a function of distance for max3 technique.
The benefit over the cross-correlation method of not requiring a known truth pattern allows max3 to perform well when the number of measurements is very small and the gain pattern is mostly incomplete. However, max3 has difficulty making accurate bearing calculations when close to the router, though not as badly as the other two methods.
The advantage max3 has over the simple max is well illustrated in Figure 11. While the gain pattern looks very promising, there is a spike along the otherwise mostly smooth main lobe at 116 degrees. This spike is off from the true 92-degree bearing which results in the max method estimating an incorrect bearing. By taking the mean of the bearing of the two crossing points 3 dB below the max (marked in blue x’s), effects from spikes like the ones depicted are reduced allowing for a much better estimate of 93 degrees.
Figure 11. Gain pattern explaining benefits of Max3 method over max.
Through this characterization, the performance seen from max3 can be used to update the POMDP model to improve the localization algorithm, as described in section “Effect on Algorithm.”
ALGORITHM PERFORMANCE
One of the goals of our flight tests was to determine the feasibility of the POMDP approach and begin to understand the performance of the POMDP method. A simple baseline method was used for comparison. The baseline method used in this test was a variable step greedy algorithm that moved in the direction of the calculated bearing (using the max method) with a variable step size. The step size was based on the similarity between measurements, resulting in an increased step size when moving in the same direction toward the signal source.
Using this baseline method, JAGER was able to move toward the location of the signal source, and with the assistance of a user monitoring the behavior, was able to locate the signal source. The flight path of the vehicle for this test can be seen in Figure 13.
With a user in the loop with this baseline method, a good estimate of the location can be determined by watching the behavior of the vehicle. Looking at Figure 13, it can be seen that the vehicle kept crossing its path near one location, which can be determined to be an estimate of the location of the signal source. It is worth noting that the baseline method does take four steps to get in the region of the signal source, and then another four or five steps for the user to be confident that the vehicle is in the vicinity of the signal source.
Figure 13. Flight path of the variable step size, greedy localization algorithm. White lines are true bearing from measurement locations, red lines are cross-correlation bearings and black lines are max bearings.
POMDP Localization. With a baseline determined, the POMDP approach was executed from the same starting location and used the simple max bearing method for determining bearing from each location. This localization took a mere two steps and three measurements to be able to locate the signal source. Figure 14 shows the state updates as the vehicle made subsequent measurements. After the first measurement is made at the starting location, the vehicle is able to immediately narrow down the location of the signal source to a small region within the grid.
Figure 14. POMDP signal source belief state at each step. Darker the red in the cell, the more likely the signal source is in that location.
Unlike the simple method of moving slowly in the direction of the max bearing, the POMDP method can make large changes in order to get to the next best location to make a measurement.
When running this algorithm, we had an assumption that when the vehicle is in the same cell as the signal source, a null measurement would be made. Unfortunately, near and over the signal source resulted in noisy measurements, and that noise resulted in location of the signal source being off by one cell.
Effect on Algorithm. The experiments in this paper were performed to obtain a better observation model for the localization algorithm. Previously, the model assumed 10-degree noise except when the vehicle was in the same cell as the jammer; there the modeled assumed a null measurement would be obtained. These assumptions were used in the experimental trajectory shown in Figure 15 and affected the selected trajectory. The vehicle always moved toward regions with high probability of containing the jammer (the dark red cells). Because we assumed that rotation would only yield a null measurement when over the jammer, receiving a null observation after rotating would convince the vehicle that the jammer was in its current cell. For this reason, the vehicle moves to regions with high probability of containing the jammer; it hoped to receive this high-information measurement and solve the problem with a single rotation.
Figure 15. Flight path of the POMDP localization flight with an overlay of the final grid state.
Experimental results have shown that measurement noise increases greatly close to the jammer. Our new model assumes 40-degree noise if the jammer is in any of the adjacent grid cells when the vehicle rotates, and 13-degree noise if the jammer is farther away. If the vehicle rotates in the same cell containing the jammer, it no longer receives a null measurement. Instead, it can receive any measurement with uniform probability.
Generating a policy with this new model leads to different trajectories. A simulated rerun of the experimental trajectory from Figure 15 is shown in Figure 16. The vehicle avoids the darker cells, which indicate higher probability of containing the jammer. Instead the vehicle chooses to rotate in cells it believes are farther away from the jammer to avoid possible measurement noise.
Figure 16. Simulation steps of POMDP with updated model.
CONCLUSION
This article presents the development of the localization component of a UAV to locate the source of a GPS jamming signal. For the scenarios tested, modeling the localization as a POMDP is a viable solution that can locate a static signal source in very few steps. It is faster and has greater confidence than a simple, greedy search baseline solution.
Through extensive test flights using a single directional antenna and rotation-based measurements, three different bearing methods have been analyzed. All three methods suffered when near the signal source due to the antenna reception pattern, which resulted in very noisy measurements. Of the three, max3 and cross-correlation fared the best in the ideal distance from the signal source. Max3 was able to outperform cross-correlation when the UAV was far from the signal source due to the limitations of cross-correlation requiring a truth pattern for correlation. However, cross-correlation can also provide a useful correlation coefficient that can be used in the future to merge several bearing calculation methods.
The characterization of antenna bearing performance is a vital component to the localization process. The characterization affects the optimal behavior determined by POMDP. When we changed our initial assumptions about measurement performance near the jammer to one better informed by our tests, the actions determined POMDP resulted in a significantly different profile.
ACKNOWLEDGMENTS
The authors gratefully acknowledge the Naval Postgraduate School for providing an unmatched space to be able to perform test flights of the JAGER system at the Joint Interagency Field Experimentation events. The authors would also like to thank the Stanford Center for Position Navigation and Time (SCPNT) and its members for supporting this work.
MANUFACTURERS
The JAGER UAV airframe is a S1000 octocopter by DJI Innovations; the flight batteries are a 8000 mAh model by Hextronik; the autopilot hardware and GPS antenna is a Pixhawk by 3D Robotics, Inc.; the autopilot software is based on PX4 by Pixhawk.org. The tracking hardware comprises a 2.4 GHz Yagi antenna from L-com; an RN-XV Wi-Fi module by Roving Networks; and an Odroid-U3 computer by Hardkernel Co.
Adrien Perkins is a Ph.D. candidate in the GPS Research Laboratory at Stanford University, where he received his MSc. in aeronautics and astronautics.
Louis Dressel is a Ph.D. candidate in the Aeronautics and Astronautics Department at Stanford, where he works on a joint project with the Stanford Intelligent Systems Lab and the GPS Research Laboratory.
Sherman Lo is a senior research engineer at the Stanford University GPS Laboratory.
Per Enge is a professor of aeronautics and astronautics at Stanford, where he directs the GPS Research Laboratory.
This article is based on a technical paper presented at the 2015 ION-GNSS+ conference in Tampa, Florida.
CODE is a consortium of AIUB and the Swiss Federal Office of Topography (swisstopo, Wabern, Switzerland), the Bundesamt für Kartographie und Geodäsie (BKG, Frankfurt a. M., Germany), and the Institut für Astronomische und Physikalische Geodäsie, Technische Universität München (IAPG/TUM, Germany).
QantasLink, Australia’s largest regional airline, has selected the FreeFlight 1203C SBAS/GNSS sensor for retrofit into its DHC-8-200/300 series of aircraft.
QantasLink paired the 1203C with the Dash 8’s TDR-94D Mode-S transponders.
“We’re pleased to demonstrate once again that there are practical ADS-B solutions for aircraft that have been in service for a while,” said Pete Ring, FreeFlight Systems’ director of Sales and Marketing. “We are proud to supply QantasLink with a straightforward, retrofit solution that extends the life of their DHC-8 fleet.”
As a certified ADS-B position source approved for all ICAO jurisdictions, the integrated 15-channel 1203C SBAS/GNSS sensor is part of a fully rule-compliant ADS-B Out system when paired with a compatible certified Mode S transponder like the TDR-94D. Providing reliable service to fleets worldwide, the 1203C also serves as the approved position source for CPDLC, TAWS/FMS, RNP and other NextGen applications.
Designed for business, regional, airline transport and heavy rotary wing aircraft, the 1203C provides state-of-the-art aviation GPS technology in a proven package. The 1203C allows customers to take advantage of the benefits of NextGen without the need for extensive and costly avionics upgrades.
Founded in 2001 and based in Texas, the company pioneered the first certified aviation WAAS/GPS receiver and the first rule-compliant UAT ADS-B system. FreeFlight Systems designs and manufactures high-performance avionics for flight safety. The solutions deliver substantial safety, cost, environmental and other benefits from the NextGen airspace transformation.
Trimble’s Irrigate-IQ now has “uniform corner,” which allows farmers to apply a consistent amount of water on the area covered by a center-pivot corner arm.
The solution prevents over- or under-watering through a uniform application, which can reduce crop stress, promote better nutrient absorption due to reduced run off and leaching, and ultimately improve crop quality and yield. In addition, it enables farmers to optimize water use. This can be beneficial for farmers located in areas with limited water resources or with water restrictions.
Irrigate-IQ uniform corner uses advanced algorithms that enable consistent water application regardless of the position of the corner arm. Whether the corner arm is starting to extend, fully extended, or folding back, Irrigate-IQ uniform corner minimizes the risk of overlaps or gaps in application.
Because it controls each individual nozzle based on the desired application depth and the position of the corner arm, uniform corner provides the highest level of accuracy to achieve maximum uniformity across the entire area covered by the corner arm. In addition, Irrigate-IQ uniform corner works with multiple brands of corner arm equipment.
“Most farmers invest in a corner arm system in order to extend their irrigable land. However, typical systems do not provide consistent watering,” said Neil Douglas, Irrigate-IQ market manager for Trimble’s Agriculture Division. “This means they are not optimizing their water resources, and potentially damaging their crop and reducing yield by over- or under-watering it. Irrigate-IQ uniform corner allows farmers to extend the capabilities of their current corner arm through consistent water application to achieve the greatest return on their investment.”
Farmers can set the field depth and let the corner arm run, or they can add Irrigate-IQ monitor and control so they can remotely manage their whole pivot. For farmers who choose to add monitor and control, they can use the Connected Farm Irrigate app to remotely keep track of pivot status, or to turn their pivot on or off or change its direction.
Irrigate-IQ uniform corner is expected to be available worldwide in the first quarter of 2016.
Spirent Communications and Oasis Smart SIM have created a strategic partnership to remove connectivity and network provisioning barriers for the rapid development of connected products and devices, such as cameras, smart vehicles, logistics and production goods.
Spirent Communications is a provider of device intelligence solutions, and Oasis Smart SIM is a global Universal Subscriber Identity Module (USIM) connectivity and management provider.
The partnership marks both firms’ entry into the connected Internet of Things (IoT) business, which analyst Gartner forecasts will result in 6.4 billion connected devices worldwide in 2016, reaching 20.8 billion by 2020.
Beefore launching the new product, Spirent and Oasis undertook extensive research into the hurdles that original equipment manufacturers (OEMs) face in making diverse connected products, ranging from white goods in the kitchen to those used in animal management, suitable for sale in world markets. It became clear that old technologies and business models based on use of the traditional SIM were not suitable for IoT device activation and subscription provisioning on a global scale.
The partnership between Spirent and Oasis will introduce a two-click software solution, including USIM functionality, that OEMs can embed into products for seamless cellular service activation in any of the world’s markets, as well as life-cycle management.
The new product will be showcased on the stands of Spirent (Hall 6, Stand 6J37) and Oasis (Hall 2, Stand 2D13/15/19MR) at Mobile World Congress, in Barcelona (22-25 February, 2016).
“Spirent and Oasis have teamed up to help manufacturers build better and smarter products for the connected world,” said Dennis Juul Poulsen, general manager of Spirent’s IoT Connectivity and Subscription Management business. “Be it a connected truck or a pair of smart running shoes, OEMs in whatever vertical market now have a solution that provides customers with seamless instant connectivity and the freedom to choose whatever cellular service provider they wish.”
“Spirent’s unique automatic access point name (APN) setup and remote subscription management solution with Oasis’ embedded smart USIM functionality is a game changer in connected products and devices,” said Olivier Leroux, CEO of Oasis Smart SIM. “OEM vendors now have a leaner way to manufacture, distribute and maintain connected products compared to solutions centered on the traditional SIM.”
Topcon Positioning Group has added the FC-5000 to its line of data controllers for construction and surveying professionals. The 7-inch sunlight-readable display field controller is designed to provide operators a larger, more versatile and faster handheld computer for the modern construction site.
“At 7-inches, the FC-5000 has the largest handheld data controller screen in our product line,” said Ray Kerwin, director of global surveying products. “The display has a capacitive touch interface — with finger, glove, small tip stylus and water capable options — that is optically bonded to increase visibility. With the press of a key, a user can change the orientation of the screen from portrait to landscape to increase visibility when viewing maps or drawings.”
The controller is compatible with all Topcon GNSS receivers and total stations — operating MAGNET Field, Site and Layout software.
“The FC-5000 comes with two built-in cameras — an 8 MP camera with autofocus and LED flash for field photography — and a 2 MP camera on the front for video meetings. With 64GB of flash storage, users can store hundreds of photos in the unit, which can be easily transferred to any computer or USB stick,” Kerwin said.
Additional features include an optional 4G LTE cellular modem, internal GPS navigation, Bluetooth and Wi-Fi, and a battery life of 10-plus hours.
The GPS Directorate at the Space and Missile Systems Center (SMC) continues to look for someone to build 22 GPS III satellites in the near future.
SMC issued a request for proposals on Jan. 8, with rather complicated terms. The first eight GPS III satellites are already under contract, and two have been built, but delivery and launch schedules have dragged. The Air Force incorporated several other payload requirements for the satellites, beyond those of new GPS signals themselves.
This is the Air Force’s third effort to find a builder.
The RFP is for “11+ Phase 1 Production Readiness Feasibility Assessment. “ It covers GPS III space vehicles 11 and beyond. The process, if followed as the Air Force envisions, will award up to three relatively small fixed-price contracts.
According to an Air Force press release, “The scope of this effort includes the current GPS III SV01–08 technical baseline with the addition of redesigned Nuclear Detonation Detection System (NDS), Search and Rescue/GPS (SAR/GPS), and Laser Retroreflector Array (LRA) payloads, Unified S-Band (USB) compliance, Regional Military Protection capability No changes are allowed to the GPS Next Generation Operational Control System (OCX) or Military GPS User Equipment (MGUE) interfaces.”
The first Air Force effort to recompete the contract for future GPS III satellites came in 2014. A 2015 initiative lowered the bar as far as requirements, but also lowered the award very dramatically, from $200 million each for two companies to $6 million each for three companies.
The 2016 announcement appears to replicate the terms of the 2015 campaign. There has been no official explanation as to why the terms changed between 2014 and 2015, and why they did not between 2015 and 2016.
Rick Ambrose, executive vice president of Lockheed Martin Space Systems, tweeted on Jan. 13 that the satellite had successfully completed its thermal vacuum test (TVAC).
Lockheed Martin Space Systems is the prime contractor on the GPS III program to build a total of eight GPS IIIs. The contract includes options for up to four more satellites, and the Air Force has told Congress it expects to execute options for at least two of those satellites.
The first GPS III satellite is expected to launch in 2017.
Coast Guard Issues Jamming Alert
The U.S. Coast Guard issued a safety alert on Jan. 16, warning mariners of the potential detrimental impact to navigation caused by GPS interference or jamming. The warning emphasizes the importance of understanding how vessel equipment could be impacted by the loss of a GPS signal.
The Coast Guard states that this past summer, multiple outbound vessels from a non-U.S. port suddenly lost GPS signal reception. The net effect was various alarms and a loss of GPS input to the ship’s surface search radar, gyro units and ECDIS, resulting in no GPS data for position fixing, radar over ground speed inputs, gyro speed input and loss of collision avoidance capabilities on the radar display.
Fortunately, the vessels were able to safely continue theirvoyage using radar in heads up display, magnetic compass and terrestrial navigation. Approximately six nautical miles later, the vessels’ GPS units resumed operation. Although the vessels had back-up systems to allow a safe transit, the consequences could have been severe, warns the Coast Guard.
IRNSS Launches Fifth Satellite
The fifth satellite in India’s Regional Navigation Satellite System rode into orbit Jan. 20, joining a growing fleet of spacecraft to provide positioning services to users across South Asia.
“With this satellite in place, within our country we will be able to get, 24 x 7, a good positional accuracy,” said A.S. Kiran Kumar, chairman of the Indian Space Research Organisation (ISRO).”
IRNSS 1E will raise its orbit to an altitude of nearly 36,000 kilometers (22,300 miles) over the next few weeks, entering an orbit centered on 111.75 degrees east longitude and oscillating up to 28.1 degrees north and south of the Equator.
Two more IRNSS spacecraft are due for launch bythe end of March to complete the constellation.
The seven satellites — four in inclined geosynchronous orbits like the one intended for IRNSS 1E, and three in equatorial geostationary orbit — will give India an independent navigation system with coverage over Indian territory and regions extending up to 1,500 kilometers (932 miles) from its borders.
India started launching its navigation satellites in 2013. Each spacecraft is designed to operate for 12 years.
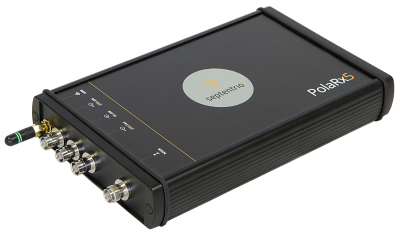
Next generation for precise scientific and geodetic applications
The PolaRx5 offers 544 hardware channels for robust and high-quality GNSS tracking. The receiver supports all major satellite signals including GPS, GLONASS, Galileo and BeiDou, as well as regional satellite systems including QZSS and IRSS. Septentrio’s Advanced Interference Mitigation (AIM+) technology enables it to filter out both intentional and unintentional sources of radio interference, from narrowband signals over high-powered pulsed signals to chirp jammers and Iridium interferers. Septentrio’s APME+ multipath mitigation technology eliminates short delay multipath without introduction of bias and guarantees superior measurement quality. The user can deactivate APME+ to obtain unmodified measurements.
Bentoni is a positioning antenna for all of the global public satellite constellations: GPS, GLONASS, BeiDou and Galileo. It is designed to be used in trackers, portable devices, network components, drones and wearable electronics. It offers high performance and maintains good isolation in situ within a device. Bentoni is a flexible FPC antenna in Antenova’s flexiiANT product range. They are supplied with an I-PEX MHF connector and a 1.13 mm RF cable in a choice of three lengths. They can be folded to save space in operation within a device, with the aim being plug-and-play simplicity. The antennas are self-adhesive mounted so that they can easily be fixed inside an electronic device.
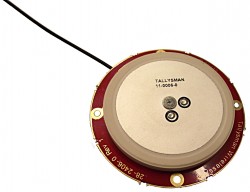
The Tallysman TW2926 antenna is an unhoused OEM version of the TW2920, designed for simultaneous reception of L-band correction signals and all of the upper band GNSS signals, including GPS L1, GLONASS G1, Galileo E1 and BeiDou B1. The TW2926 is 56 millimeters in diameter and has four drilled plated holes for secure mounting within customers’ products. It can be custom tuned to ensure optimal performance within an enclosure. The 1-dB bandwidth of both the TW2920 and TW2926 covers 1525–1559 MHz for the L-band downlink and 1559–1610 MHz for the upper-band GNSS. The LNA provides 28-dB of gain. The antennas employ Tallysman’s Accutenna technology, which provides strong cross-polarization rejection for greatly improved multipath rejection, low axial ratio and tight phase center variation.
The Near Field Communication (NFC) 88NF100 controller with active load modulation (ALM) is desgined to support the smallest antenna sizes critical to mobile, the Internet of Things (IoT), wearable and automotive applications. Adhering to NFC Controller Interface (NCI) Technical Specification version 1.1, the 88NF100 provides an extended operating range and is extremely energy efficient to enable extended battery life for power-critical applications. ALM technology supports the smallest antenna sizes to enable OEMs to implement NFC capabilities into small form-factor designs. The controller has extremely low power operation in polling mode to provide increased battery life for power critical applications and three single-wire protocol (SWP) interfaces to secure element (eSE) devices for secure payments. The two-pin antenna interface supports a maximum distance of two meters between the chip and antenna.
Designing Better Maps: A Guide for GIS Users, second edition, is an updated and comprehensive guide to creating maps that communicate effectively. Cartographer Cynthia A. Brewer covers the basics of good cartography, including layout design, scales, projections, color selection, font choices and symbol placement; she also describes her ColorBrewer application, an online color selection tool. The second edition includes a new chapter on map publishing. One reviewer wrote, “It is also worth a look by experienced cartographers who seek a refresher and a few new tips.” Brewer is a professor and chair of the Department of Geography at Pennsylvania State University and map and atlas design consultant.
Eos Pro Tools is tightly integrated with google map
Eos Pro Tools is a comprehensive RTK NTRIP app for Android that works with its Arrow line of RTK GNSS receivers. An Arrow GNSS receiver combined with the NTRIP app turns an Android smartphone or tablet into a powerful data collector capable of recording 1-centimeter accurate GIS data in real-time. The app, named Eos Tools Pro, has user-configurable audible and visual alarms to alert the user of high PDOP, lost RTK correction, unacceptable correction age and several other important metrics. It supports all current and future constellations (GPS, GLONASS, Galileo and Beidou). Detailed satellite information such as a skyplot that plots each visible satellite, whether it’s being used or not, and signal strength bar graphs from each constellation are also displayed. Finally, a terminal screen displays the NMEA data flowing and allows the user to send commands to the receiver.
Lightweight, ergonomic design for the mobile workforce
The 7-inch Algiz RT7 Android tablet is fully rugged, meeting stringent MIL-STD-810G U.S. military standards for protection against drops, vibrations and extreme temperatures. Its IP65 rating means that it’s waterproof as well as fully sealed against sand and dust. The tablet comes with a built-in accelerometer, gyroscope and e-compass as well as a stand-alone u-blox EA-7M GPS receiver for navigation, along with built-in Qualcomm IZat location services.
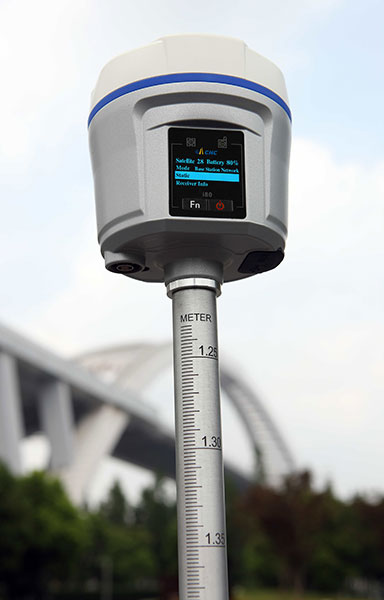
The i80 GNSS receiver computes a true triple-frequency real-time kinematic (RTK) tilted pole solution using all four worldwide and multiple regional constellations, providing a future-proof sub-centimeter RTK solution to surveyors and contractors. Without the need of a data collector or computer, the i80’s LCD graphic user interface allows for common workflow operations, such as static logging, autobase, autorover and UHF channel selection, to be easily performed. The CHC i80 incorporates dual hot-swappable batteries, allowing for days of uninterrupted work. While small and lightweight, it is packed with a full array of sensors and modules: multiple micro-electrical-mechanical (MEMS), internal Tx/Rx UHF, multiband cellular modem, Wi-Fi, Bluetooth, serial and USB.
All-in-one GPS, GNSS and RTK Data Collector Series
The SXPro series is built for mobile survey and GIS users for applications such as water, electric and gas utilities; transportation; mining; agriculture; and forestry. The professional-grade rugged handheld receivers include a battery life of more than 10 hours on a charge as well as a large outdoor-viewable touchscreen. The handhelds are rated IP65 for protection against water and dust, and equipped with a 5-megapixel autofocus camera and Microsoft utilities. The SXPro RTK (real-time kinematic) model offers 220 multi-constellation channels for centimeter accuracy with RTK networks. The SXPro GNSS offers 372 multi-constellation channels for sub-meter accuracy with SBAS corrections.
New point cloud analysis and visualization capabilities
The latest release of ENVI software adds lidar point cloud analysis and visualization capabilities that previously were only available in the ENVI lidar software package. ENVI 5.3 offers users a single software interface to work with hyper-spectral, multi-spectral, panchromatic and lidar data. The out-of-the-box functionality includes 3D point-cloud visualization, derived terrain product generation (such as digital elevation models) and lidar analytics such as viewshed line-of-sight calculation. For users who need point-cloud or terrain products in an area where collecting lidar is not feasible or is too expensive, the ENVI Photogrammetry Module is able to generate synthetic 3D point clouds from stereo optical imagery to take advantage of existing imagery archives. The dimension of time can be critical for a thorough geospatial analysis of an area, and the new ENVI release has added enhancements to the Spatio-Temporal analysis toolset. Spatio-Temporal analysis visualizes change and derives statistics from data over time, enabling users to observe past events to better predict upcoming activities.
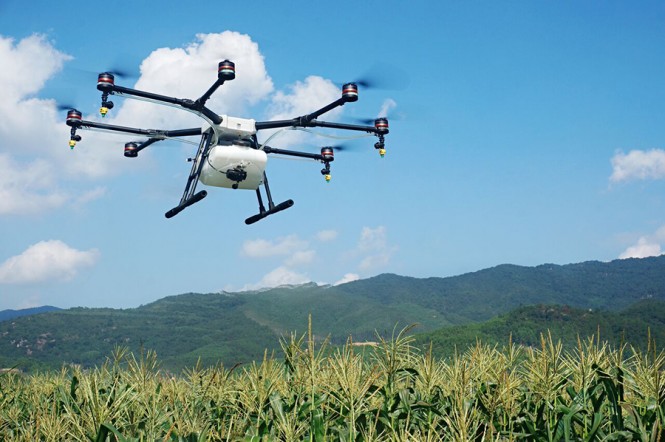
The eight-rotor DJI Agras MG-1 UAV can load more than 10 kilograms of liquid for crop-spraying and can cover between seven and 10 acres per hour — more than 40 times more efficient than manual spraying. It can fly up to eight meters per second and adjusts spraying intensity to flying speed to ensure even coverage. It is dustproof, water-resistant and made of anti-corrosive materials. It features DJI’s flight-control system and microwave radar to ensure centimeter-level accuracy. During flight, the drone scans the terrain below in real time, automatically maintaining its height and distance from plants to ensure application of an optimal amount of liquid. The drone’s intelligent-memory function means after the Agras MG-1 is brought back to base for refill or recharge, it will return to its last memory point to pick up spraying where it left off.
The EXCIPIO is an anti-drone system that uses a drone to shoot out a net to capture another drone.The EXCIPIO Aerial Netting System is comprised of a UAS equipped with a first-person view camera and a net-firing gun. When the EXCIPIO has reached the threat target, it fires a net, then can either release the net with the target ensnared or keep the net tethered. Though the initial system concept was focused on intercepting and neutralizing an airborne UAV, the conceptual applications have expanded to include manned aircraft, ground vehicles, people and animals (whether airborne or on the ground).
The March 23 program at the Crowne Plaza Hotel, San Francisco Airport, focuses on a fast-changing landscape where automakers and Silicon Valley technology companies are crafting and beginning to roll out their strategies for the autonomous car. Keeping on top of the latest technology, early adoption trends, worldwide markets, liability factors and regulation will be critical in a sector previously known for long product design cycles.
Key topics addressed: Advanced driver assistance systems (ADAS) and autonomous vehicle technologies; solving the high cost of rolling out autonomous systems; investment approaches; testing; innovative players; consumer expectations; market-sector differentiation and strategies to exploit them; the regulatory picture.
Paul Drysch, global director, Connected Car for Jasper Wireless, is the conference chair. Panel moderators include Steve Wollenburg, co-founder and vice president, Business Development, Automatiks; Phil Magney, founder & principal, Vision Systems Intelligence; Derek Kerton, founder, The Kerton Group, Telecom Council, Autotech Council; Jan Hellaker, program director, DRIVE SWEDEN; and Adrian Pearmine, national director for smart cities and connected vehicles, DKS Associates.
The conference also features a reception on the evening before, a hosted luncheon, and a post-program exhibit and reception.
CEVA Inc. has introduced the Dragonfly reference platform to accelerate the design of low-data-rate machine-to-machine (M2M) and Internet of Things (IoT) communication applications, including standalone wearables, smart grid, surveillance systems, asset tracking, remote monitoring systems, connected cars and smart utilities.
The Dragonfly multifunction platform is enabled by the recently announced CEVA-XC5 and CEVA-XC8 digital signal processor (DSP) cores and accompanied by the hardware and software components required to rapidly design machine-type communications (MTC) systems.
The platform supports GPS, Wi-Fi and other IoT-related communications standard set to be deployed for M2M communication as well as existing and emerging LTE MTC releases and LPWAN standards such as LoRa, SiGFox and Ingenu. LTE MTC — LTE Advanced for machine-type communications — significantly increases battery life, reduces device complexity, and enhances coverage for low data rate machine-type communications.
At Mobile World Congress 2016, CEVA will demonstrate the Dragonfly reference platform running LTE Cat-0 and GPS concurrently on its silicon-based development platform together with test and measurement equipment from Keysight Technologies and a GNSS simulator from Galileo Satellite Navigation. Mobile World Congress takes place in Barcelona, Spain, Feb. 22-25. CEVA is located in Hall 6, Stand A50.
Dragonfly offers system developers a flexible platform that allows for optimal hardware/software system partitioning, combining a low-power vector communication DSP with a range of hardware co-processors. Such partitioning enables the software flexibility essential for upgradability and long service life of typical M2M devices, while delivering the power efficiency required to support extended battery life of up to 10 years.
As an example, for CEVA licensees developing M2M systems incorporating LTE Cat-1 or Cat-0 today, these systems can be easily upgraded to support LTE Cat-M or other future standards when available. The DSP can also be used to implement proprietary features for specific device use cases, such as seamless indoor and outdoor positioning concurrently with Wi-Fi 802.11n or LTE Cat-0, in a highly efficient manner.
“Our Dragonfly reference platform brings together all of the essential hardware, software and system integration components required by customers developing low-power machine-type communication solutions, in a highly cost and power efficient manner,” said Michael Boukaya, vice president and general manager, Wireless Business Unit at CEVA. “We have leveraged our deep expertise in low-power baseband processing and complemented it with a range of software offerings to deliver a platform that is highly customizable and flexible for developing a broad range of IoT and M2M products, quickly and efficiently.”
The Dragonfly reference platform includes the vector communications DSP and all the required co-processors and interfaces, together with software application layers and libraries, RTOS and drivers for MTC systems design. These hardware and software components are available for LTE MTC, Wi-Fi and GNSS standards. Also included is a 500-MHz silicon-based development system that includes all of these components together with RF front ends and a host interface.
The Asia Oceania Geosciences Society (AOGS) 2016 conference will be held in Beijing on July 31-Aug. 5. Abstract submissions are being accepted until Feb. 19. In particular, organizers are looking for papers for a session on GNSS positioning and atmospheric sounding.
AOGS was established in 2003 to promote geosciences and its application for the benefit of humanity, specifically in Asia and Oceania and with an overarching approach to global issues.
The Asia Oceania region is particularly vulnerable to natural hazards, accounting for almost 80% human lives lost globally. AOGS is deeply involved in addressing hazard-related issues through improving our understanding of the genesis of hazards through scientific, social and technical approaches.
AOGS holds annual conventions providing a unique opportunity of exchanging scientific knowledge and discussion to address important geo-scientific issues among academia, research institution and public.