A system that tracks and monitors valuable high-risk assets for defense and commercial customers has received certification from Iridium Communications, increasing the system’s accuracy and effectiveness. The Iridium constellation of low-Earth satellites provides voice and data services for areas not served by terrestrial communication networks.
The Global Sentinel System, by Cubic Global Tracking Solutions, tracks and monitors assets with two-way, redundant encrypted communications. The system provides up to 2,000 unique geozones for each Global Sentinel device to control precise reporting rules along the supply chain. It can monitor asset conditions including temperature, humidity, light sensing, motion, and container door status.
The latest generation of Cubic’s Global Sentinel System provides continuous global coverage by incorporating the Iridium 9602 short-burst-data transceiver. “As an Iridium partner for the past seven years, we’ve worked closely to integrate the Iridium 9602 transceiver into Cubic’s fifth generation of products,” said Mary Ann Wagner, president of CGTS.
Wagner said Cubic relies on Iridium to provide real-time low latency reporting on customers’ assets in areas where other modes of communication are unavailable. This capability allows for continuous global coverage for reliable secure reporting of asset position, status, and event alerts. “This is essential because of the critical nature of the assets we are tracking and monitoring for our Department of Defense and commercial customers,” Wagner said.
Power-Saving GPS. GPS also plays an important role. With the flexibility derived from geozone attributes for GPS, Cubic can provide an optimum balance between position accuracy and power management.
Cubic’s devices take full advantage of GPS receiver circular error probable (CEP) estimates to set accuracy limits for reporting, explained Randy Shepard, vice president of technology innovations for CGTS. While higher position accuracy may be a challenge for battery-powered units operating for years between servicing, it is often necessary to avoid false alarming for events like route deviation where position accuracy is important.
“One of the unique features of Cubic’s devices is the aggressive manner in which we manage power for all device functions including GPS,” Shepard said. “Using the geozones that are remotely reconfigurable on the device, GPS accuracy and response time can be controlled as a function of geozone.
“As an example, for our current GS-5B receiver used for global tracking and monitoring of shipping containers, the initial default dwell time to capture GPS position is 60 seconds. Our experience is that from a cold start we get a normal lock in less than 45 seconds. The maximum acceptable CEP is 100 meters. If a CEP of less than 100 meters is not received, we do not update position. If a CEP of less than 100 meters is received, we wait up to an additional 60 seconds to improve the CEP. Once a CEP of 10 meters or less is received, the position is captured and the GPS receiver turned off. Again, all four of these parameters are remotely reconfigurable for each of the 2,000 user-defined geozones.”
The other GPS receiver parameter that is configurable as a geozone attribute is whether power is maintained on the receiver to retain satellite ephemeris data. If the position update interval for a geozone is more often than every 15 minutes, data back-up power is usually maintained on the GPS receiver and the satellite ephemeris data is retained. This provides and effective warm start for the GPS and usually results in a much quicker initial position lock, which saves overall power.
To provide real-time asset tracking worldwide, Cubic’s Global Sentinel System relies on a variety of transmission links to communicate the positioning and status of an asset. Based on the location of the asset, the system selects whichever link is the most cost-effective for data transmission. This includes wireless mesh networking, cellular, or the ubiquitous global two-way coverage of the 66-satellite Iridium constellation. The Global Sentinel System relies on the Iridium network’s ability to eliminate blind spots when the asset is out of range of other routing methods.
Today, some of the most exciting innovations in consumer electronics aren’t the ones in your living room or your office — they’re the ones inside your car. — Audi CEO Rupert Stadler
While most automobile magazines do a great job of reviewing the performance of automobiles and trucks, they do not adequately address the vehicles’ GPS or positioning, navigation, and timing (PNT) capabilities, sensors, or electronics suites. Nor do they endeavor to fully grasp how these sensor suites, many enabled by GPS and other PNT devices, add to their safety, peace of mind, and overall situational awareness. My pick of the best automobile currently on the market for driver situational awareness is the 2011 Audi A8.
Lest you think the choice was easy, it was not. For two years I drove more than 26 different candidate automobiles and I found myself repeatedly comparing them to the A8L. The Audi 8L is designated by its maker to premiere and test all electronic features — hardware and software, including situational awareness devices — that may eventually go into production on other Audi models.
I noticed when I began testing automobiles that, on the high end, they were fairly uniform in performance. The majority of them went from 0 to 60 miles per hour (0 to 100 kilometers per hour) in less than five seconds. They all stopped or went from 60 to 0 in approximately 100 feet (30.48 meters), depending on the tires, weather, and road surface. They were all reasonably quiet and to some degree comfortable. The average fuel mileage varied from 15 to 27 miles per U.S. gallon, with the Audi A8L taking honors in this class. However, the models varied tremendously in their electronic sophistication, integration, and situational awareness: some vehicles kept the driver situationally aware, and some failed miserably at this critical task.
I look not only at the electronics and how they are integrated, but also how easily and completely they inform the driver in all sorts of traffic and weather conditions. Do the windshield wipers activate automatically when it rains or you enter a fog bank? Does the navigation system automatically reroute you or at least offer that option when weather, accidents, or delays are encountered? Does the PNT system alert you in time to take evasive action in a potential dangerous situation? Does it present the mapping interface and alerts so that you are aware of your options both aurally and visually? Do you have to manually intervene or merely follow clear and precise directions?
Every major automobile maker and dealer I spoke with said that the majority of serious buyers today look for performance and style as always — but those have become secondary to the options provided, mainly the electronic awareness, safety, and entertainment suites. Of course, makers and dealers also appreciate the fact that these options, while adding safety, convenience and awareness, also add — often significantly — to the bottom line, or the vehicle’s drive-away price. So, yes, situational awareness does come at a price and sometimes a steep one. However, if it gives you peace of mind, lower stress, and saves lives, it is hard to complain. One can certainly make the argument that all these devices should be available on all automobiles. As time goes by they will be, and at a lower price. For now, we pay a premium for them. But what price can you place on a human life? Rest assured, many of these features are potentially life-saving.
Stealth GPS
I want to alert you to a phenomenon some GPS subject matter experts and I discovered while researching for the Department of Defense. It surprised us, but in retrospect we have always suspected the phenomena existed; we have chosen to call it Stealth GPS.
Stealth GPS exists in many military platforms today, and the practice now extends to the automotive industry as well. Basically, 90 percent of the more than 1 billion GPS users in the world use GPS for time or timing purposes and not for just position or navigational purposes. Obviously, in automobiles with very high-tech systems onboard, timing and synchronization are critical. Since GPS chips today are relatively inexpensive, they occasionally show up in unexpected places. No less than five major auto makers told us that every model they produce has a single and more likely multiple GPS chip(s) embedded somewhere in the electronic suites. These automobiles may or may not have a standalone GPS display, and it may not be obvious to the owner or even the mechanics that work on the vehicle, but GPS information, including timing data, is essential to proper vehicle operation.
For example, on the Audi A8L the Quattro sensors measure tire adhesion or slip up to 100 times per second and report that information through the traction-control system’s electronics. This requires precision timing and a tightly integrated timing or synchronization system.
Consider that GPS time is distributed freely around the world, and relatively cheap quartz crystal clocks can act to hold over precise GPS timing for a considerable period when the vehicle’s GPS antenna, also usually a stealth device, cannot see the sky. GPS chips in addition to position and navigation information may provide time of day to include day, month, year, hour, seconds, and divisions of seconds down to 1 x 10-14, along with altitude, attitude, heading, and velocity information, all independent of any other sensors on the car. As you will see, when GPS data are tightly integrated with other sensor data and display systems, the resulting displays and capabilities can be almost staggering in their versatility and ability to make the driver situationally aware.
How many GPS chips, stealth or otherwise, does the Audi 8L carry? Frankly, I am not sure, and it’s just possible that neither is Audi; after all, some of them are likely very stealthy. But regardless of how many there are, they inform and enable a dizzying array of displays, capabilities, and overall situational awareness second to none.
When I drove the A8L, every time I wanted a piece of information that the situation demanded, it always seemed to be readily available, and usually in more than one location. There is a pop-up full-color 8-inch display screen in the center console and a full color 7-inch display screen directly in front of the driver, between the speedometer and tachometer. The 7-inch screen is so well integrated that until information starts to appear, you never know it exists. I did not have to search or push buttons or pull levers — the information was simply there when I needed it.
The Audi’s displays were the most intuitive I have experienced to date. So much so that after experiencing the Audi’s non-intrusive total situational awareness capabilities, they were subsequently conspicuously absent on any other vehicles I drove.
The Audi A8L is available with all of what Car and Driver calls Audi’s latest “electronannies,” including a multimedia interface (MMI) and voice-controlled GPS display, which disappears when not in use or when the automobile is turned off. There is also active and adaptive cruise control with low-speed stop-and-go capability that will actually initiate and fully stop the vehicle if you are about to collide with an object, person, or another vehicle — and you fail to stop the car yourself.
The A8L has
a blind-spot monitoring system;
a camera-enabled lane-assist mode that turns on above 40 miles per hour and warns you with a steering wheel vibration when you are wandering in your lane or about to intrude on another;
a night-vision system that displays yellow silhouettes for anything warm-blooded ahead, including pedestrians and those lovable but pesky Bambis lurking by the side of the road; when such creatures are directly in the car’s path, the alerts turn bright red.
a visual reverse navigator in the center pop-up that clearly displays the exact parking path the car will take depending on how you turn the wheel. The proximity sensors beep with increasing frequency as you near objects and turn to a solid tone when you are within four inches of the object. I parked the Audi A8L several times solely by monitoring the center display.
While these wonders are merely enabled by GPS, the display screens in the vehicle are nothing short of amazing in their capability and versatility. The touch-screen color display can enable almost any feature of the automobile through a mere touch while many features are MMI- and/or voice-activated. You quickly learn, if your hands are occupied keeping you on the road, that you merely need to speak, and the Audi quickly obeys.
Road Trip
Before driving from Colorado Springs to Denver and back, I spent two very informative hours with the dealer staff going through the A8L’s features and capabilities. They do this with every prospective buyer — a good thing because the number of features can be daunting. But once you are actually driving, everything seems intuitive and, most important, non-distracting. I never once had to hunt for switches or buttons, because if you can’t remember, just use the audio system and tell the Audi what you want or need.
On the open road, I headed north to Denver. I set my destination merely by asking aloud for the Denver airport; the system immediately gave me a choice of the three airports in and around Denver, and I selected one. I could have looked up all airports within 100 miles, or put in the address if I knew it, or just browsed local transportation options, or even input the coordinates if I had them.
The center display always gave me the speed limit of the road I was traveling; it allows you to set a warning if you exceed that speed by your choice of number. The car is so quiet, there are no audible clues as to your actual velocity. If there had been any speed cameras on I-25, the Audi would have warned me about them as well.
The car always displayed the next three turns in blocks that clearly gave the mileage to the turn, the direction and degrees of the turn, and the name of the exit and road to turn onto. A mile before each exit, the navigation system displayed all its amenities and points of interest (POIs): gas stations, motels, hotels, restaurants, hospitals, and cash machines. It can display much more or less, depending on how you program, it, but the logos for the amenities show up just like they do on some road signs with the same information (although the road signs never seem to be there when you need them, or they go by too fast to read). Plus, both the center and driver’s panel displays show in bright vivid blue your route and the turns to make, the lane you should be in, and very accurate distances and times to the next turn, your final destination, and any intermediate points.
Wonder of wonders, when I turned off the prescribed route (on purpose), I never heard the dreaded “Recalculating…” The system adjusted and gave me new data to my destination based on my waywardness, and a pleasant suggestion to “proceed along the highlighted route.”
Back on I-25, all of a sudden yellow triangles appeared on both navigation displays, with a visual and audible warning of slow traffic ahead; a few seconds later came an indication that an accident had occurred. The nav system immediately zoomed out to show alternate routes with major thoroughfares that would take me around the slowdown. I took the first turn off the Interstate without making any manual adjustments to the system. It routed me effortlessly around the accident and back to I-25. I never pushed a button or had to ask a question. If I’d wanted to continue on secondary roads, it would have accommodated that automatically.
On the outskirts of Denver, I programmed the system to find the nearest Starbucks, which was less than a half-mile off the Interstate. There I reprogrammed my return route to go through seven POIs. Having accomplished this feat without once looking at a manual, I was off again.
I made the trip back on secondary roads mainly so I could cruise with both sun roofs open and listen to the 19 speakers of the wonderful Bose stereo system (Bang and Olufsen option). I stayed about 5 miles below the speed limit and was passed innumerable times, but I didn’t care because I was having so much fun. This automobile is so comfortable, you find yourself looking for ways to extend your journey: 22-way adjustable leather seats; five-way, five-intensity massage system, automatic seat heating/cooling.
I made it to all seven POIs, including a couple I had heard of but never visited before, because of the frustration of getting lost trying to find them. Before I was ready, I found myself back at the dealership. The excellent staff encouraged me to keep the car longer, but frankly I was afraid if I did, it would wind up in my garage, and that is just not in the budget right now. That reminds me, I need to ask for a raise.
Bluetooth connectivity is available; the Apple iPhone can be fully controlled and/or downloaded onto the A8’s terabyte hard drive and accessed from any of the three color touchpad screens in the car.
You can control the GPS navigation interface to include new destinations, from the full color 10-inch touch screens in the rear passenger compartment, giving new meaning to the phrase “back seat driver.” There is a single DVD-CD drive slot in the center dash console as well as a six-disk changer unit in the optionally refrigerated glove box. That is, if the large cooler that extends into the rear cabin from the trunk space is not enough for you. Understandably, the rear cooler is a bit hard to reach from the front seat while you are barreling along the Autobahn at 130 miles per hour, or down I-25 at 75.
Information Everywhere
Bottom line for the Audi A8L: the information you need is displayed almost everywhere you look, and can be called up with the touch of a button, the scroll of a finger, or the sound of your voice. All internal and external data is provided in an atmosphere that is second to none climatologically and ergonomically. It is the only automobile I have driven lately with four full-color touchscreens that, while keeping you situationally aware no matter where you are seated, can simultaneously control all the systems in the automobile. The two 10-inch rear-seat screens can be used to read e-mail, browse the Internet, or watch the latest movies or television programming. Add to this an incredibly performance-minded vehicle, the highest gas mileage rating in its rank, amenities that want to make you slow down and enjoy the journey, and you have my pick for the best GPS-enabled, situationally aware vehicle in its class.
Thanks to Vince Cimino, general manager at the Phil Long Audi dealership in Colorado Springs, and his staff for unfettered access to the Audi A8L and all their expertise.
Until next time, happy navigating.
Burkhard Hunhke, executive director of Volkswagen Group’s Experimental Research Laboratory: “We are now able to keep up with and even surpass the technology in mobile devices.”
Interview with Audi Research Director Burkhard Huhnke
While testing Audis for this article, I had the opportunity to interview Dr. Burkhard Huhnke, executive director of the VW/Audi Experimental Research Laboratory (ERL) in Palo Alto, California. Palo Alto is also home to Stanford University, and thus to Stanley and Shelley, autonomous vehicles that have driven into the record books. ERL supports all brands within the Volkswagen Group: Audi, Bentley, Bugatti, Lamborghini, Seat, Skoda, and Volkswagen.
The integration of external and onboard capabilities with GPS and a screamingly fast new Nvidia Tegra 2 chip make the Audi navigation system the first in-car navigation system with 3-D display capabilities.
Don Jewell (DJ): How is this integrated GPS different from a mobile device adhered to the windshield?
Burkhard Huhnke (BH): Let’s say the driver is overwhelmed in a very difficult situation, like approaching a traffic jam in bad weather at high speed. The Audi will sense this — we call it pre-sense — alert the driver, begin a series of automatic safety measures, such as tightening the seatbelts and closing windows, and then automatically start to brake the automobile. For us, the systems in the Audi are for more than just displaying information or blinking warning lights. The systems actually take over some of the functions and support the driver, especially in emergency situations. GPS provides a way for us to localize the car in its environment with data such as time of day, weather and traffic conditions, and any other information that both onboard and external sensors, such as the Internet and Google, connected provide.
DJ: What happens when GPS data is not available?
BH: We must provide additional sensors and train our systems to learn to bridge the time with GPS outages or interruptions without the driver being aware that GPS is no longer being received, make it seamless. The intelligence, the metadata from other sensors is onboard in the embedded systems, and they are programmed to provide the necessary data when GPS is not available.
DJ: How does this translate to a better experience for the customer?
BH: We put a lot of effort into the optimization of the human-machine interface (HMI). We have psychologists working on the HMI along with our designers and programmers. Some car manufacturers provide systems that force you to think like an engineer to operate them. We realized this approach won’t work. To create an intuitive navigation system requires much, much more. It requires input from our customer, what is intuitive to them. For this as I said we use simulators, customer inputs, along with psychologists, clinical studies, and a great deal of effort that goes into understanding what makes a truly intuitive interface and a system that people will like and enjoy using.
You do not need a handbook to operate our systems. I actually hate handbooks and I believe that if you cannot figure out how to do something, such as program a destination into a GPS in just a few seconds, without a handbook, then the customer will not like it; so we purposely made the system intuitive and very user friendly. The learning curve is very short and our customers find themselves using the system in no time at all.
We found out one of the key things our customers want is beautiful, high-definition, and fast graphics. So we started working with one of the leading companies (Nvidia) for graphical interfaces. In the end, we created an environment in the Audi A8 that is more like your home living room than a normal automobile.
In the A8 we combined the Internet and the onboard Audi network with things like Google Maps so you can continuously download Google Maps as they are needed: beautiful high-definition color graphics and maps with connectivity. The POI search is absolutely as up-to-date as it can be, often including data updated the same day or possibly just a few minutes before from the Internet. In the A8 for a POI you get the same information as if you had searched on your computer at home.
DJ: How much do you care about accuracy for your GPS/PNT systems in the Audi? Is one meter enough?
BH: We are extremely interested in a very accurate GPS position down to the centimeter level. Not all manufacturers are. Since you live in Colorado you may have heard about the Audi TT that successfully drove autonomously up Pikes Peak. To do this, we used differential GPS signals to take hairpin turns at race-like speeds.
But we realized that it is a risk to only depend on external signals such as GPS. GPS information is critical, but we find ourselves depending more and more on our onboard sensors. This gives us a huge advantage, such as with our onboard camera system. It gives us the ability to develop better adaptive cruise-control functions. All these extra sensor inputs combined with GPS gives you the best precision, but when you don’t have GPS, you have to rely on other sensors to take over.
We launched a navigation system with a processor from Nvidia at the same time it was announced as a capability in a mobile device. In the past, we were always behind the time with technology because we were conservative with what we put in the cars, but with this move we are now able to keep up with and even surpass the technology in mobile devices. We created a very smart motherboard so we can exchange and process data quickly.
DJ: What do you see as your mission?
BH: Producing the safest car in the world, and I think we are there. The United States still has 37,000+ traffic fatalities every year, so we took it as our responsibility to create the safest systems onboard any automobile. Our new navigation system predicts curves and safe speeds for the conditions and sometimes automatically reduces the speed of the automobile. We talk a lot about driverless cars, but actually I think we all enjoy driving, like you do, Don, with your Q7 in the snow in Colorado. But there are also times when we are extremely bored and not paying attention to our driving and just wish we could press an autopilot button and start answering e-mails or something. This could be in a traffic jam or any circumstance where it is no longer fun to drive. So that is something we would like to accomplish.
Recently we created a new program with Stanford University to work on solutions for mobility challenges. We want to be able to obtain more external information, use onboard information, and create the car of the future with the smart people at Stanford and those of us at ERL. We want a navigation system that is smart and can predict traffic, which helps and supports the driver, and therefore makes driving extremely safe. That is now our mission.
Developments in the LightSquared saga came fast and furious in June; highlights are listed below and briefly recapped in the adjacent news story. It will be dated by the time you receive this issue, as it went to press three weeks prior.
For current events, see Top Story and Latest News, and the full versions of stories abridged here. The Navigate, Survey Scene, and GNSS Design & Test e-newsletters, free at env-gpsworld-integration.kinsta.cloud/subscribe, will keep you up to date.
In chronological order, from late May to late June:
LightSquared Las Vegas Test Towers Flawed, FCC Filing Shows
House Bill Ensures FCC Takes No Action that Would Harm Military Use of GPS
Test Data Shows LightSquared Slams Medium, High-Precision GPS Receivers
PNT Advisory Board Finds Interference, Says Move It
LightSquared, FCC Rebuttals Distort Record
NPEF Report on Military Receivers Calls for FCC Recision
LightSquared Asks for, Receives Extension on Final Interference Report
Claims of LightSquared Solution Discounted
Air Transport Association Tells Congress to Protect GPS
Interference with GPS Poses Major Threat to U.S. Economy
LightSquared Applies to International Telecommunications Union for Global Signal
Flawed Test Towers
Results from a key round of field tests conducted near Las Vegas, Nevada, may show overly optimistic results regarding the effects of the LightSquared terrestrial signal on GPS receivers. According to a LightSquared addendum filed with the Federal Communications Commission (FCC) a week after the May 16 Working Group report, the company’s equipment broadcast during the tests at lower-than-planned levels for its eventual deployment across the United States. Further, LightSquared may not currently be prepared or equipped to broadcast according to the terms of its business plan or its conditional waiver.
LightSquared does not appear to have developed the full software suite nor possess the full equipment to implement the plan the company says has been in preparation for many years. Critical testing was conducted under conditions that do not truly replicate what may be the case should the FCC allow the plan to go forward.
House Bills Target the Waiver
On May 27, the U.S. House of Representatives passed a bill stating that the FCC shall not provide final authorization for LightSquared operations until Defense Department concerns about GPS interference have been resolved. The bill then went to the U.S. Senate for its action.
On June 23, the House Appropriations Committee approved action that would stop the FCC from expending any funds related to the LightSquared conditional waiver until all concerns have been resolved about interference with GPS. The amendment passed in a unanimous voice vote by the full committee, underscoring growing congressional concern about harm to GPS.
The House actions and a letter to the FCC signed by 32 U.S. senators may presage a showdown over the issue between Congress and the president, who has promised increased broadband access. A 4G wireless network providing this access could be facilitated by LightSquared sales of service via its tower transmitters to wireless carriers. LightSquared has already signed a $20 billion, 15-year deal with Sprint.
Tests Slam High-Precision Receivers
Data from Las Vegas field tests show that wide-bandwidth, high-precision GPS receivers started feeling the effects of the LightSquared transmission about 1,800 meters from the tower. Medium-bandwidth high-precision GPS receivers started feeling the effects of the LightSquared transmission at about 1,200 meters from the tower. In each case, there was about a 200-meter buffer from when the GPS receivers started to feel the effects of the LightSquared transmission to the GPS receiver being jammed, at 1,600 meters and 1,000 meters respectively.
GPS World has received further details of the tests but has not been authorized to publish them yet.
Deere & Company, a major provider of precision agriculture equipment and services, notified the FCC on May 26 of substantial interference with its GPS receivers by the LightSquared signal. Deere receivers registered impact of and interference by the LightSquared signal as far away as 22 miles from a transmitter. Further, the company has found no practicable technical solution to the problem.
PNT Advisory Board: Move ATC
At its June 9–10 meeting, the National Space-Based Positioning, Navigation and Timing (PNT) Advisory Board found that GPS services cannot be assured if the LightSquared plan is approved, and that the only viable option for continued availability of GPS as well as new wireless broadband is to find another spectrum for LightSquared not adjacent to the GPS frequency.
The formal recommendation reads: “The provision of GPS services cannot be assured if the LightSquared proposal for satellite and terrestrial broadband provision using the MSS L-Band receives final approval.
“The only reasonable and viable option to continue ubiquitous availability of GPS and the provision of a new 4G wireless broadband capability would be for the FCC to assign an alternate frequency spectrum to LightSquared that has little or no probability of affecting the delivery or utilization of GPS/GNSS services.”
During the discussion, one advisory board member, a former goveronor of the state of Wyoming, told presenter Jeff Carlisle of LightSquared, “Your definition of mitigation seems more tied to a legal argument than a common-sense argument.”
Rebuttals Distort Record
Claims by LightSquared’s Carlisle and FCC chair Julius Genachowski, that the GPS industry knew long ago about LightSquared’s plan for powerful terrestrial transmitters, contradict the truth. Examination of FCC filings show that the GPS industry knew about and agreed to a plan by a previous ownership of the company, for a different purpose, with a different business concept, and employing a completely different technological approach, one that would not have harmed GPS transmissions and disabled GPS users the way the current LightSquared plan does.
The terrestrial broadband operations first unveiled in November 2010 cannot be described as ancillary to the purpose for which Lightsquared predecessors Motient, MSV, and SkyTerra received their spectrum and licenses — that is, to provide a service that was primarily a mobile satellite service. The November letter to the FCC described a new business model that turns the original concept on its head. LightSquared for the first time revealed plans to build a “nationwide network of 40,000 terrestrial base stations,” and stated that “the capacity of its fully deployed terrestrial network across all base stations will be tens of thousands of times the capacity of either of [its] satellites.”
The deviations from established policy required to accommodate LightSquared’s new business model are not technicalities. They represent a fundamental change to a complex and interrelated set of rules that were carefully designed to protect GPS users from interference.
The predecessor companies had to protect their own primary satellite operations from interference. The protection that their own satellite operations required was also sufficient — at that time — to protect GPS receivers. The terrestrial network and powerful signal LightSquared now proposes bear no resemblance to the operations the FCC authorized in 2003.
Military Report Calls for FCC Retreat
The National PNT Engineering Forum concluded after testing classified and GPS receivers under LightSquared terrestrial transmission conditions: “Significant concerns remain that operation of an ATC integrated service as originally envisioned by the FCC cannot successfully coexist with GPS.”
The NPEF report calls for rescinding the FCC waiver for LightSquared terrestrial transmissions, conducting more thorough studies on impacts, and revisiting the 2003–2010 authorizations. The group tested a variety of military receivers under classified categorization, also known as “government receivers.”
Final Report Withheld
At the last minute of a June 15 deadline for the final Working Group report on interference, LightSquared asked for a two-week extension. Federal regulators granted the request, and the final report is now due on July 1.
A spokesperson for the Coalition to Save Our GPS revealed that “The Working Group results show devastating interference to GPS and no proven method of mitigation. Delay will not change these results. These results are the same results the FCC had had before it granted the waiver.”
Some Solution. Three days after requesting the delay, LightSquared announced it had solved the problem, by proposing to broadcast only from the lower end of its permitted spectrum band. GPS experts countered that this would still disable the functioning of high-precision receivers.
Air Transport Opposes Waiver
The Air Transport Association and the Aircraft Owners & Pilots Association told Congress that the only acceptable mitigation is for LightSquared’s operations to be moved outside of the L-band and away from GPS. “With so much of the early evidence showing that LightSquared’s proposed network would potentially endanger nearly every flight operating in U.S. airspace, it seems evident that no further development of this system can be allowed.”
Going Global
LightSquared has filed documents relative to the International Telecommunications Union, signaling intent to use its entire band at the full authorized power. The company’s goal appears to be to work internationally, circumventing U.S. regulation, to obtain permits to broadcast a terrestrial signal globally.
Non-aviation users of satellite- and ground-based augmentation systems do not require the conservative level of integrity built into these systems for aviation users. Removing it can produce substantial benefits in terms of smaller error bounds and improved availability.
By Sam Pullen, Todd Walter, and Per Enge
Both space-based and ground-based augmentation systems (SBAS and GBAS, respectively) are designed to enhance standalone GNSS navigation to meet the requirements of civil aviation. SBAS and GBAS corrections and integrity information are also available to the non-aviation user population, such as automobiles, buses, and trains on land as well as ships near shore. This much larger user base can benefit as much from the integrity components of SBAS and GBAS as from the increased accuracy obtained from applying SBAS and GBAS pseudorange corrections. However, there are significant differences between the aviation interpretation of navigation integrity and the interpretation that would be natural to most users.
SBAS and GBAS provide integrity in a multi-step procedure that is laid out in the RTCA Minimum Operational Performance Standards (MOPS) for the FAA versions of both systems: DO-229D for the Wide Area Augmentation System (WAAS) and DO-253C for the Local Area Augmentation System (LAAS). These systems indicate which ranging measurements should be excluded as unsafe to use and provide bounding error standard deviations, or sigmas, for the remaining usable measurements. Each aircraft uses this information to compute vertical and horizontal protection levels that define position-domain error bounds at desired probabilities. This process is straightforward, logical, and is not limited to aviation users. However, the requirements and assumptions underlying it make it very conservative.
SBAS and GBAS are designed to meet integrity requirements defined in terms of what is known as specific risk. Briefly, this means that all safety requirements must be met for the worst combination of knowable or potentially foreseeable circumstances under which an operation may be conducted. Some variable factors important to safety, such as the user’s satellite geometry, are known by definition. Others, such as receiver thermal noise, are random and unpredictable. But several factors that are critical to GNSS performance, such as multipath and ionospheric errors, are neither completely random nor deterministic. Specific risk typically treats all error sources that are not completely random in a worst-case manner. SBAS and GBAS are designed to mitigate specific risk to support civil aviation, and the resulting conservatism makes SBAS and GBAS less attractive to non-aviation users who expect tighter protection levels relative to nominal system accuracy.
Fortunately, non-aviation users need not apply all MOPS procedures required of aviation users if their own safety requirements differ. Most users define integrity in average or ensemble terms, meaning that everything not known in practice is treated as random and is probabilistically mixed (or convolved) together. The protection levels valid for these users would be much lower than for aviation users, even though the stated bounding probability is the same. This contrast is illustrated in Figure 1, which shows example bounds on 2-D vertical errors at a probability of 0.95 (the 95th percentile, or 95 percent) for accuracy and a probability of 1–10-7 for integrity. The term VPE stands for vertical position error, while VPL stands for vertical protection level. Analogous terms (HPE and HPL) and a similar picture exist in two dimensions for horizontal errors.
Only one 95 percent error bound is shown in Figure 1 because this probability can be observed, estimated, and modeled with theory and reasonable amounts of data (hundreds or thousands of independent samples). This is not at all the case at the very small probability of 10-7 that applies to aviation precision approach: it is roughly equivalent to one event in 47.5 years per 150-second precision-approach interval. Both theory and data fall far short of being able to predict such rare-event errors. Extrapolating from available data to 1–10-7 using Gaussian distributions is perilous because the Gaussian distribution almost never applies at such small probabilities. Mixed-Gaussian models, other so-called fat-tailed distributions, and inflation of Gaussian parameters help address this, but the uncertainty regarding the true error distribution results in significantly different error bounds depending on the assumptions that are made. The same is true regarding the effects of faults and anomalies that are more probable than 10-7 but are still rare and poorly understood.
In the end, different means of assessing these uncertainties and various degrees of user risk aversion result in different 1–10-7 protection levels, as shown in Figure 1. It is this difference that we wish to quantify and exploit in this article.
Average versus Specific Risk
The concept of average or ensemble risk is intuitive to those with a background in probability and is one of the key principles of probabilistic risk assessment (PRA). Thus, it helps to examine it first.
Average risk is the probability of unsafe conditions based upon the convolved (averaged) estimated probabilities of all unknown events. More specifically, probability distributions are derived (based on the best available knowledge) for all unknown parameters relevant to user safety, and these are combined (by probabilistic convolution) to create an overall distribution that represents safety risk as a function of the known parameters. This straightforward, natural interpretation of probability and uncertainty has a major advantage in that it cleanly separates the probabilistic calculation of safety risk from users’ aversion to risk. By keeping risk probability and risk aversion (or severity) separate, a final risk consequence measure can be derived that supports apples-to-apples comparisons of alternatives. One useful result of this is known as the value of information (VOI). By comparing the risk outcomes of two scenarios in which the latter case has additional information (for example, from an additional sensor or integrity monitor), the risk-reduction benefit of the added information can be traded off against the cost and complexity that it introduces to the system. Similar comparisons can be made for any definition of risk, but the definition and use of VOI in an average-risk framework makes the most sense in both theory and practice.
Turning to specific risk, no single definition exists within the aviation safety community, to our knowledge. This is partially because of the uniqueness and complexity of the concept and partially because multiple inconsistent interpretations appear to exist. Therefore, we provide our own definition: Specific risk is the probability of unsafe conditions subject to the assumption that all credible unknown events that could be known occur with a probability of one (on a risk-by-risk basis).
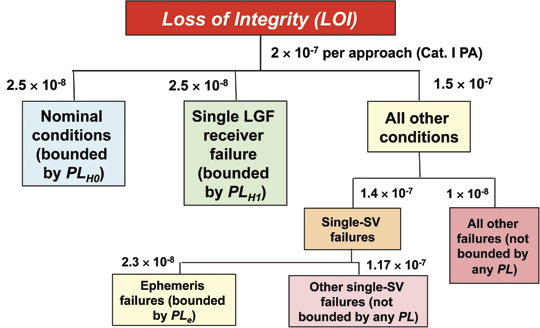
To understand how specific risk differs from average risk, it helps to start with a fault-tree representation of risk in which loss of integrity (LOI) can result from any of the nodes of the tree. Figure 2 shows a simplified example of a fault tree for CAT I GBAS. It shows the allocation of the CAT I total integrity risk requirement of 2 × 10⁻⁷ per approach to the various possible causes of integrity loss. In specific-risk analysis, each type of failure shown in the tree, if deemed to be a credible failure (meaning, in practice, that its assumed prior probability is larger than compared to its allocation in the fault tree), is assessed that the failure is guaranteed to occur in a worst-case fashion. This means that the variables that describe this particular failure scenario take the values that maximize the hazard to users. In an average-risk analysis, these variables would take many values according to their own probability distributions, and these distributions would be convolved together to provide an overall representation of risk under that scenario. Instead, one scenario drives the specific risk assessment for a particular user class, and it is the worst one possible from that user’s standpoint. (Another user class would be evaluated under a different set of parameters corresponding to the separate worst case for that user.) The improbability of the worst-case combination of parameters is not considered as long as the probability of the failure scenario as a whole is deemed high enough to be of concern.
Figure 2. Fault tree for CAT I GBAS integrity.
Since GNSS augmentation systems contain multiple levels of health monitoring, the worst-case scenario is usually the one that maximizes the probability of an undetected hazardous error for a particular user class. Hazardous error is typically defined as any error that exceeds a pre-defined safety zone known as an alert limit (AL) or any error that exceeds the computed protection level (PL), which allows integrity to be defined separately from the intended application. Both definitions are conservative in that all errors exceeding AL or PL are treated as equally hazardous. In other words, an error just above AL is treated as just as dangerous as an error of 10 × AL. They are also misleading when used in specific-risk analyses because the resulting worst-case conditions are those that give errors just above AL or PL, as these are the generally hardest for monitoring algorithms to detect.
The use of specific risk in aviation is an evolution of deterministic guidelines for tolerable risk that date back to an earlier era when flying was more dangerous. It remains dominant in aviation safety assessment because it is partly responsible for the development of safer and more reliable air transportation. However, it has several important weaknesses compared to average risk. The first is that the degree of risk aversion preferred for aviation is buried within the hazard probabilities generated by specific risk — it cannot be separated out. This means that specific-risk results do not translate well to other classes of users, as very few users would happen to have the same risk preferences that have evolved within aviation over several decades. In addition, specific risk makes a distinction between unknown events that could be known and those that are both rare and completely unknowable. A very risk-averse value of information is much different than the risk-neutral one built into PRA, as it severely penalizes systems that do not include all potentially-informative sensors. Since each sensor added to a system provides less benefit than the last, almost all cost-effective systems choose to include less than the maximum possible number of sensors.
The conservatism implicit in specific-risk assessment severely penalizes users. Although PRA would show that the combination of factors (shown in an example induced by extreme ionospheric spatial decorrelation) needed to produce a 40-meter error in a CAT I GBAS system is exceedingly improbable (almost certainly below 10-10 per approach), specific risk forces a significant part of the GBAS risk-mitigation effort to be targeted at this scenario. In this case, since monitoring is not guaranteed to detect the anomaly in time, the only recourse is geometry screening, a cumbersome technique in which the ground system continually evaluates the worst-case error and, if it exceeds a 28-meter tolerable limit at the CAT I decision height, determines which broadcast parameters to inflate such that all satellite geometries causing worst-case errors exceeding 28 meters are made unavailable (because the inflated VPL is larger than the 10-meter CAT I VAL). The result of this procedure is much lower user availability than would be achieved without inflation. SBAS pays a similar penalty, as we will see later. The broadcast grid ionospheric vertical error values that bound worst-case ionospheric errors (and thus the resulting protection levels) are much higher than they would be if the unusual combination of factors needed to create the worst-case error scenario were not the dominant concern.
To the extent that loss of availability represents a safety issue at the airspace level, the worst-case focus that results from specific risk is not optimal even from a safety standpoint. But this is not the only concern. Specific risk requires a great deal of development and testing to identify and mitigate a handful of very peculiar, non-representative conditions. When schedule and resources are limited, other potential threats that are easier to foresee but seem extremely improbable are often neglected. One example is the treatment of multiple hardware failures. If individual failures are assumed to be statistically independent, the probability of multiple simultaneous failures is very small. However, while statistical independence is a common assumption in probability classes because it makes calculations easier, it rarely applies in the real world. Because satellites and ground receivers are similar, if not identical, the presence of a failure in one unit may suggest a common cause or at least a common vulnerability, meaning that the probability of additional failures is much higher than independence would suggest. Thus, assuming independence by default could lead to neglecting entire categories of risk that are more threatening than the worst-case events that dominate specific risk.
Maximum WAAS Errors, Protection
To investigate the conservatism built into SBAS and GBAS specific risk assessment, maximum WAAS horizontal and vertical position errors over time (as measured by the Performance Analysis Network (PAN) maintained by the William J. Hughes FAA Technical Center) have been examined and compared to the protection levels computed when the maximum errors occurred. This study begins with PAN Report #8 (covering January to March 2004 — shortly after WAAS commissioning in mid-2003) and extends through PAN Report #34 (covering July to September 2010). Each PAN report covers three months of observed WAAS performance.
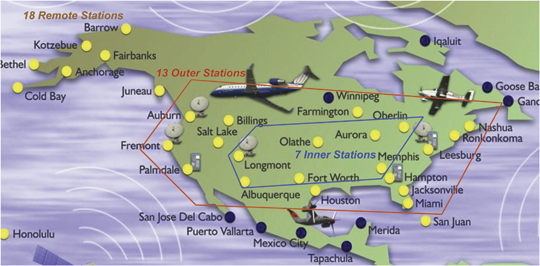
Figure 3 shows the 38 WAAS reference stations (WRSs) used by the PAN to collect position error and protection level information (some of these stations were not active in 2004 and thus were not used in earlier PAN reports). While measurements from these stations are used to generate WAAS corrections and error bounds, they are also used by the PAN as static pseudo-users that compute WAAS-corrected positions and protection levels according to the aircraft user algorithms specified in the WAAS MOPS. The resulting positions are compared to the known, pre-surveyed positions of each station to derive estimates of vertical and horizontal position errors (VPE and HPE) once per second.
Figure 3. WAAS PAN reference station network.
Figure 3 groups these stations into three sets of stations based on their presumed quality of WAAS coverage. These sets are unofficial and were created for the purposes of this study. The seven stations in the inner set are expected to have good WAAS coverage at all times because they are surrounded by other stations. The 13 stations in the outer set are expected to only have acceptable coverage because s
ome of them are at the edges of CONUS. The remote stations provide coverage to the inner and outer regions as well as the best possible coverage of their own regions. Because the remote stations extend beyond the primary coverage region of WAAS in CONUS, errors at these stations are not considered here.
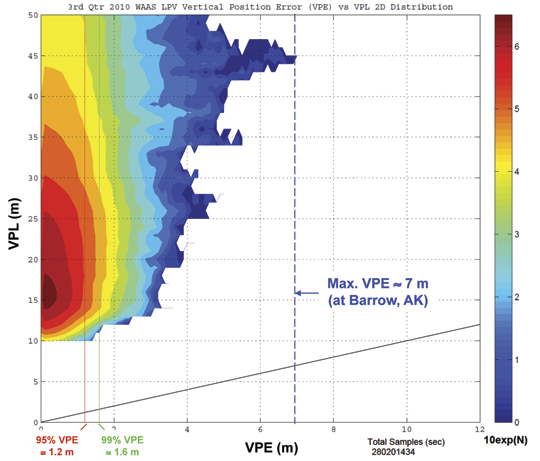
Figure 4 is a 2-D plot of position error versus protection level in the vertical axis (that is, VPE versus VPL) for all epochs and stations during the three months covered by the recent WAAS PAN Report #34 (July 1–September 30, 2010). These results are typical of the entire period since WAAS commissioning in 2003, particularly the last several years. The vertical lines on the plot indicate the 95th-percentile, 99th percentile, and maximum VPEs in this period (1.2, 1.8, and 7 meters, respectively). The maximum VPE occurred at Barrow, AK, which is one of the most remote stations in the WAAS network (see Figure 3). In comparison, the lowest VPLs (intended to be 1–10-7 bounds on VPE) are in the range of 10–15 meters, and values as high as 40 meters are not uncommon. The most demanding approach operation that WAAS supports, LPV-200, allows approaches to a 200-foot minimum decision height and requires that VPL be below a vertical alert limit (VAL) of 35 meters. HPL must also be below a horizontal alert limit (HAL) of 45 meters. When this is not the case, the approach operation is not available; thus these higher VPLs extract a significant cost.
Figure 4. WAAS vertical protection level versus vertical position error (June–September 2010).
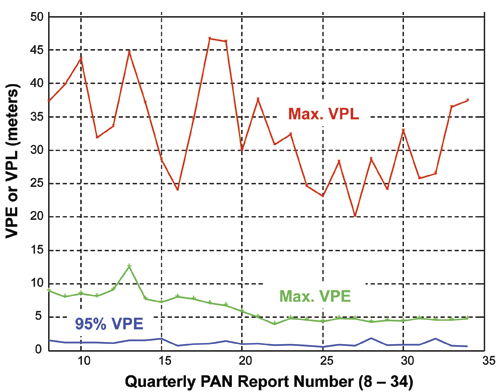
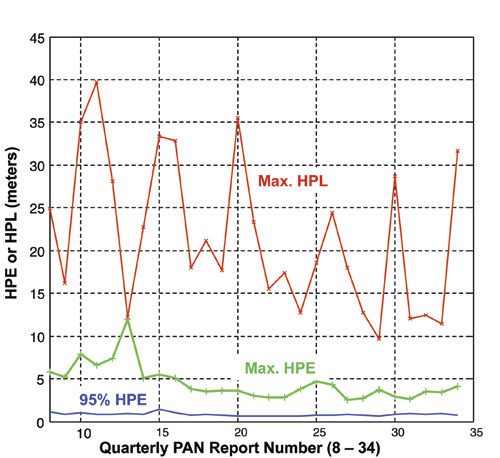
Figure 5 and Figure 6 (for vertical and horizontal errors, respectively) span the entire period of WAAS PAN Reports used in this study. VPL represents the VPL at the station and time of the maximum VPE; it is not the largest VPL recorded at a particular station. The horizontal errors shown in Figure 6 are defined analogously. Note that the station that observes the largest horizontal error in a given PAN report may differ from the one that observes the largest vertical error.
Figures 5 and 6 demonstrate that, while both 95 percent and maximum errors are quite low and are within the expected range of each other, the protection levels associated with the maximum errors greatly exceed them. This pattern is clearer in Figure 5 for vertical errors because maximum VPL tends to be more consistent across PAN reports, but it is true for horizontal errors as well.
Figure 5. WAAS vertical errors and protection levels from 2004–2010.Figure 6. WAAS horizontal errors and protection levels from 2004–2010.
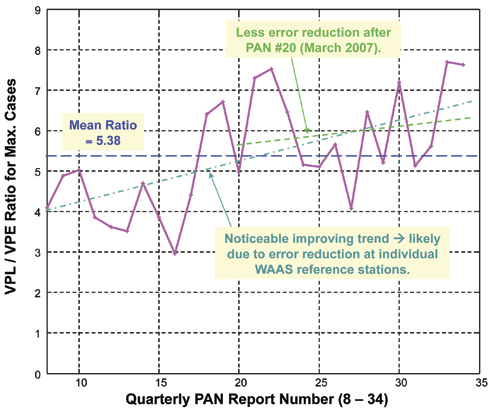
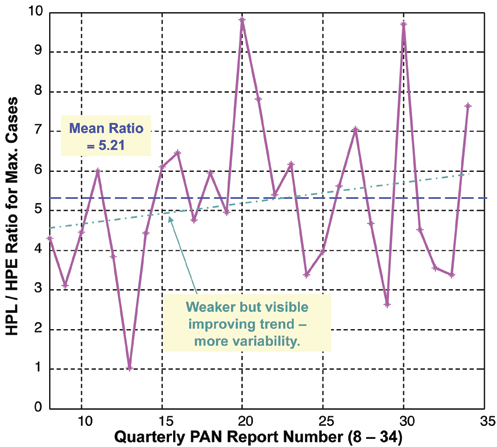
Figures 7 and 8 clarify this relationship by plotting the ratio of VPL to VPE and HPL to HPE for the station and time of the maximum error. The mean of this ratio is very high and is about the same in both cases: 5.38 for vertical and 5.21 for horizontal. Figure 7 shows a steady upward trend in the ratio that is mostly due to WRS improvements that resulted in maximum VPE being reduced over time. This trend is clearly visible in Figure 5 and appears to exceed the weaker trend of lowering VPL due to WAAS algorithm enhancements. The same trend is visible in the horizontal Figures 6 and 8 but is weaker due to the greater variability of maximum HPL over time.
To evaluate the significance of the large PL-to-max-PE ratios in the WAAS PAN database, we need to approximate the number of independent samples from which the maximum errors were derived. As noted before, WAAS protection levels represent error bounds at the 1–10-7 probability level based on specific risk. With one measurement being collected at each operational station every second, a total of about 4.25 billion samples were collected in the PAN reports from January 2004 to September 2010. Note that measurements from remote stations are included in this count, but they are also represented in the conclusions because their PL-to-max-PE ratios are very similar to the ones shown in Figures 7 and 8. Translating this number into the number of statistically independent samples depends on the interval between independent measurements. Because both nominal and rare-event errors affect this interval, it is hard to estimate. Our best guess is a range between roughly 30 and 150 seconds, suggesting that the PAN database contains between 2.8 × 10⁷ and 1.4 × 10⁸ independent samples. Both of these numbers suggest that WAAS protection levels are very conservative from the perspective of average risk.
Figure 7. Ratio of VPL to VPE from 2004–2010.Figure 8. Ratio of HPL to HPE from 2004–2010.
Adjusting for Average-Risk Users
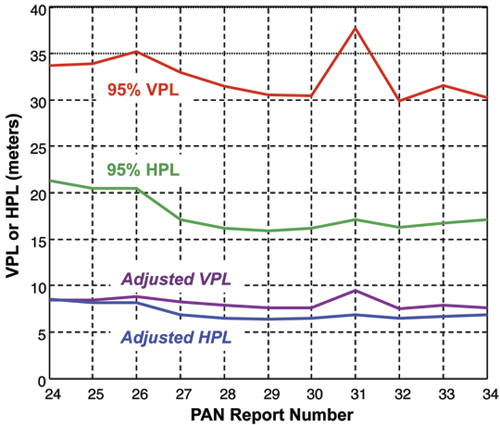
Using the above results, a preliminary estimate of the reduced WAAS protection levels that would apply to average-risk users can be made. Figure 9 shows a comparison between the actual 95 percent WAAS VPL and HPL and the adjusted VPL and HPL potentially achievable with WAAS (for the same 1–10-7 bounding probability) for average-risk users. The actual WAAS VPLs are taken from the more recent WAAS PAN Reports starting from #24 (covering January to March 2008) as the period from 2008 to 2010 includes most of the WAAS algorithm improvements introduced since commissioning in 2003. The actual 95 percent VPLs and HPLs represent the largest reported 95th-percentile values among the stations within CONUS for each quarterly period. The lower adjusted VPLs and HPLs are derived by dividing each VPL by a factor of 4.0 and each HPL by a factor of 2.5. These two reduction factors are derived from Figures 7 and 8, respectively, as conservative estimates of the ratio between protection levels and maximum position errors. Note that the factor of 2.5 for horizontal errors does not include the 12-meter error in Cleveland from PAN Report #13, as this is thought to be spurious (that is, not representative of actual WAAS behavior).
Figure 9. Projected WAAS protection level reductions for average-risk users.
While projections based on these reduction factors are imprecise, they demonstrate the much lower error bounds that non-aviation users with an average-risk safety perspective could achieve. Most non-aviation users operate on land or sea and will be primarily concerned with horizontal error bounds. Figure 9 suggests that the typical 95th percentile WAAS HPLs of 15–20 meters (for the worst location in CONUS) can be reduced to 6–8 meters and still provide a confident 1–10-7 error bound.
It is important to emphasize that these preliminary projections for average-risk users are just that. In order to formally establish new integrity requirements and protection levels for existing systems, the hazardously misleading information (HMI) analyses previously done for these systems need to be redone using the principles of PRA and average risk. While the original development of the WAAS and LAAS HMI analyses was lengthy and resource-intensive, almost all of the detailed work is already complete. As long as the original analyses are available, it is a much smaller task to take these results and create PRAs out of them by extracting the original specific-risk assumptions and applying average-risk principles instead.
LAAS Users. Since the first GBAS ground station design (the Honeywell SLS-4000 LAAS Ground Facility) was certified for CAT I use in 2009 and has not yet been approved for operations at a specific airport, much less data is available to do a preliminary analysis for GBAS similar to the one done for WAAS above. However, the degree of sigma inflation in the parameters broadcast by CAT I LAAS is approximately known, meaning that it can be more-precisely removed from the current LAAS protection levels to estimate what they would be for average-risk users.
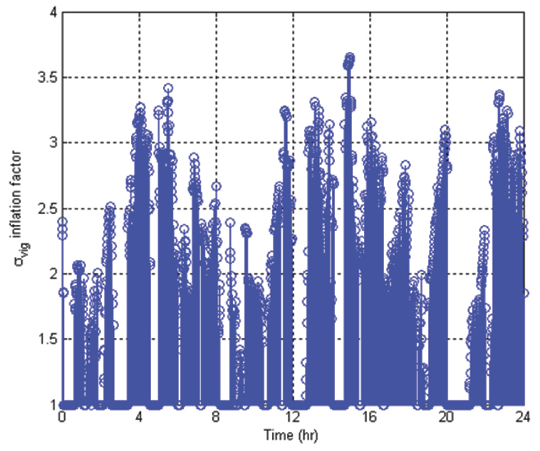
Figure 10 shows the degree of inflation applied to the broadcast σvertical_iono_gradient (or σvig) parameter in order to protect against the worst-case ionospheric anomaly described previously. This result is for the SPS-standard 24-satellite constellation over a 24-hour period at the LAAS installation at Newark Airport, New Jersey (the method used by the Honeywell SLS-4000 is somewhat different). While not all epochs require inflation, a majority cause the nominal σvig value to be increased by a factor of 2 or more, which significantly decreases CAT I availability and currently makes it impossible to take advantage of the Differentially Corrected Positioning Service (DCPS) for non-CAT-I operations.
Figure 10. Typical σvig inflation factors for CAT I LAAS.
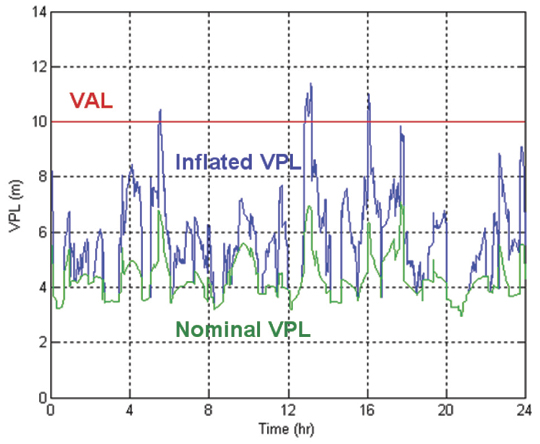
Because of the extreme rarity of the worst-case event that dictates this inflation, it would likely not be needed for average-risk users. Figure 11 shows how much the σvig inflation in Figure 10 increases the LAAS VPL at Newark for the standard 24-satellite constellation. The VPL reduction from removing the inflation is not as dramatic as the potential reductions shown for WAAS in Figure 9, but they are significant relative to the 10-meter VAL for LAAS CAT I approaches. Furthermore, the pre-inflated nominal value of σvig for LAAS is 6.4 millimeters/kilometer, which is much higher than the actual one-sigma nominal gradient value of 1–2 mm/km because, under specific risk, the very worst nominal data must be bounded (also, worst-case tropospheric gradients must also be bounded by σvig). Other broadcast parameters that affect VPL, such as σpr_gnd and the ephemeris P-value that bounds worst-case ephemeris failures, would also be reduced significantly by switching to average risk. Overall, it is likely that LAAS protection levels based on average risk would be reduced from the current specific-risk PLs by about the same range of factors (2–5) observed from WAAS data.
Figure 11. Impact of σvig inflation on LAAS VPL.
User Performance Improvements
This discussion assumes that most non-aviation users who are not encumbered by the history of aviation standards development will prefer to quantify risk using PRA and the average-risk approach. As noted earlier, average risk better matches most users’ intuitive understanding of uncertainty and has the enormous advantage of separating risk quantification from risk aversion. Regardless of how risk-averse or conservative a given operator is, his or her model of risk aversion can be applied most efficiently to a risk-neutral calculation of risk that fairly represents all aspects of uncertainty. Inserting risk aversion into the calculation of risk, as done in the specific-risk approach, is both inefficient and non-optimal from a safety perspective because extensive focus on a few extreme worst-case events drives attention away from other events.
The HPL reductions for average-risk users illustrated here would be significant for many classes of ground and marine transportation users. They would allow operations with tighter physical safety margins to be supported. Users who gain no particular benefit from tighter protection levels would still obtain much higher availability of integrity, as a 25-meter HPL could be supported by much poorer satellite geometries than would otherwise be the case. In other words, users that can tolerate 25-meter horizontal error bounds would be able to operate safely a much higher percentage of the time, because the degree of GNSS constellation deterioration needed to exceed this limit would occur much less often. These benefits do not only apply at the 1–10-7 probability level, as they would scale to the higher probabilities (1–10-4 to 1–10-6) that many non-aviation applications would be most concerned with.
While very few non-aviation users of GNSS today have real-time safety requirements similar to those of civil aviation, the number of such users will likely increase as the coverage of augmented GNSS (and the availability of integrity from standalone receiver-autonomous integrity monitoring, or RAIM) expands. The evolution of standalone civil GPS usage provides a precedent: as basic GPS accuracy improved from tens of meters to several meters, and the cost of user equipment dropped, more and more uses were discovered. A similar, although smaller-scale, trend is likely to occur as the advantages of augmented GNSS become more available and better understood. The primary beneficiaries are likely to be intelligent road-transport systems, train services, and marine transportation in restricted waters.
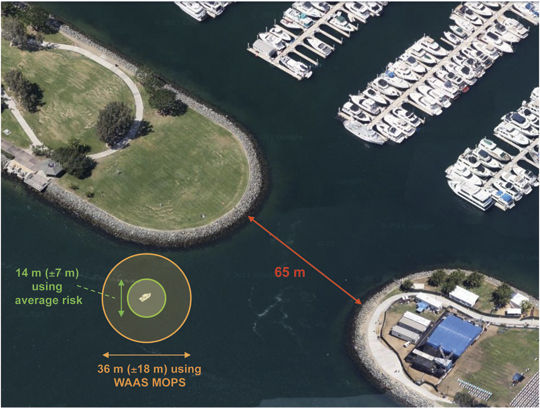
One application where tight real-time integrity bounds would be useful is in harbor and marina entry and exit; see Figure 12, taken from a Google map of a marina in San Diego, California. Based on the earlier analysis, two typical 1−10-7 horizontal protection levels are shown: 18 meters using the unchanged WAAS MOPS approach, and 7 meters based upon modifying the broadcast bounding parameters to represent average risk (these HPLs are bounds on error in either direction, positive or negative; thus the 2-D error bounding circle has a diameter of twice the HPL).
Figure 12. Example of reduced protection levels for harbor/marina access.
When the resulting error bounds are compared, the relative advantage of the smaller bound for this application is immediately apparent. In general, when HPL is significant compared to potential obstacles, its significance varies with the square of HPL rather than HPL itself, as the area being protected matters more than either linear direction. In this example, the ratio of HPLs being compared is 18/7, or 2.57, but the ratio of HPL-squared is much larger: 182/72 = 6.61.
When real-time integrity is not needed, augmented GNSS provides an easy means to guarantee or certify vehicle locations after the fact with great precision and reliability, without the need for post-processing. Vehicle and cargo tracking based on standalone GPS is common today, a certification of the correctness of the tracking data to probabilities suitable for legal or commercial guarantees is lacking. For this, error bounds at 1–10-4 to 1– 10-6 probabilities are likely sufficient, and would allow HPLs of below 5 meters from WAAS and below 3 meters from LAAS. In some scenarios, the difference between a 5-meter and a 15-meter guarantee would be minor, but in others, it could make a substantial difference.
As noted earlier, even for uses where the required HPL (as represented by the safe error limit, or HAL, for a particular application) is satisfied by the existing WAAS and LAAS protection levels, the use of modified average-risk protection levels increases the availability of integrity, which is most often expressed as the probability or percentage of time (over all satellite geometries and othe
r variable system states) that the integrity requirement is met throughout an operation (in simple terms, that HPL ≤ HAL). For user locations within good WAAS or LAAS coverage, the most variable element over time is satellite geometry. Decreasing HPL by a factor of 2.5 or more substantially increases the margin between HPL and HAL and makes it far less likely that the satellite geometry will degrade to the point where HPL exceeds HAL. For example, if the unmodified WAAS HPL equals HAL at an (un-weighted) HDOP of about 1.5, the resulting satellite availability (an upper bound on overall availability) for the SPS-standard 24-satellite GPS constellation would be roughly 98.5 percent. This means that the satellites in view (in this case, all satellites above 5 degrees elevation at a location in CONUS) would provide HDOP ≤ 1.5 about 98.5 percent of the time. However, the modified average-risk HPL (using the factor-of-2.5 reduction) would roughly translate into a limiting HDOP of about 3.75. This allows the required integrity bound to be satisfied by much poorer GPS geometries and gives a satellite availability of greater than 99.9 percent. Thus, when integrity is needed, this much greater availability of integrity is a major advantage.
Summary
SBAS and GBAS broadcasts are freely available to all GNSS users, most of whom will have different definitions of acceptable risk. These users are not optimally served at present and may hesitate to take advantage of SBAS and GBAS as a result.
Using years of collected data for the FAA WAAS system and analysis of the inflation factors built into the CAT I version of the FAA LAAS system, it appears that average-risk users of WAAS and LAAS would be adequately supported by protection levels that are 2 to 5 times lower than those currently derived by aviation users. The fact that two different approaches used to examine WAAS and LAAS suggest similar levels of over-conservatism lends credence to these estimates. While further validation by full-scale probabilistic risk assessments is necessary, we conclude that non-aviation users willing to accept average risk would obtain much better performance and availability from simple modifications to the existing SBAS and GBAS protection level calculations specified for aviation users.
Acknowledgments
We thank the FAA Satellite Navigation Program Office for its support of our research on WAAS and LAAS. However, the opinions expressed here are solely our own. We thank Jim Kelly and Tim Murphy for their explanations of the evolution of today’s SBAS and GBAS integrity requirements. We also thank the FAA Technical Center for its efforts in collecting and publishing WAAS error data over the last decade using its Performance Analysis Network (PAN).
Sam Pullen is a senior research engineer at Stanford University, where he is the director of the Local Area Augmentation System (LAAS) research effort. He has supported the FAA and others in developing GNSS system concepts, requirements, integrity algorithms, and performance models since obtaining his Ph.D. from Stanford in Aeronautics and Astronautics.
Todd Walter is a senior research engineer in the Department of Aeronautics and Astronautics at Stanford University. He received his Ph.D. from Stanford and is currently working on the Wide Area Augmentation System (WAAS), defining future architectures to provide aircraft guidance, and on assuring integrity on GPS III.
Per Enge is a professor of aeronautics and astronautics at Stanford University, where he is the Kleiner Perkins, Mayfield, Sequoia Capital Professor in the School of Engineering. He directs the GPS Research Laboratory and received his Ph.D. from the University of Illinois.
A new navigation system looks to make driving safer by removing the need for drivers to look away from the road at their navigation device. With Wikitude Drive, as a driver moves down the road, the route is “drawn” onto the live video screen of an Android smartphone.
How is this possible? Augmented reality.
Augmented reality (AR) is a term for a live direct or indirect view of a physical real-world environment whose elements are augmented by virtual computer-generated imagery. The idea to blend augmented reality with navigation struck Philipp Breuss-Schneeweis, founder of Mobilizy, in 2008 when he was developing the Wikitude World Browser for the first Android Developer Challenge. Considering the awards Wikiude Drive has received so far, including being named Global Champion in the 2010 Navteq Challenge, it could be considered the next big advance in consumer navigation.
Wikitude Drive, which launched at the end of 2010, works by attaching a mobile phone on top of a dashboard looking at the road. The application then overlays video captured through the camera with driving instructions. This allows users to drive through their phone, watching the road even while they are looking at directions.
“With Wikitude Drive I don’t find myself looking for directions; the device itself guides me along the way,” said Nicola Radacher, product manager at Mobilizy.
According to Breuss-Schneeweis, Wikitude Drive distinguishes itself from other navigation systems in two ways: First, due to the overlaying of the route onto the live video stream of the surroundings, the driver can easily recognize and follow the suggested route. Instead of looking at an abstract map, the driver is looking at the real world. The navigation system leads the driver through unfamiliar territory in a natural, real, and easy way.
Second, Wikitude Drive solves a key problem that all other navigation systems have. These systems require the driver to take his eyes off the road to look at the abstract navigation map. Just by looking at the map screen for one second when driving at 100 km/h (62 mph), the driver is actually “blind” for 28 meters (92 feet).
“Think about how much can happen in those precious meters. Since Wikitude Drive provides you with driving directions on top of the live video stream, you still see what is happening in front of you when looking at the display of your mobile AR navigation system,” Breuss-Schneeweis said.
The AR system uses data from a smartphone’s GPS, compass, and movement sensors, retrieves information from its database, then displays the information over the camera feed. The company says millions of points of interest will also be displayed when a future version is integrated with Wikitude World Browser, the company’s AR browser for smartphone users.
Wikitude Drive still can be used the traditional way. In some driving conditions — for example when driving in the dark — a drawn map is advantageous, and a driver can switch to the 3D map view by tapping the screen. Voice commands are also provided.
Landing airplanes with GPS is not a new concept. People were demonstrating the feasibility back in the early 1990s. But landing transport airplanes in commercial airline service is something that’s only just getting to be a regular occurrence.
Before we go on, maybe we need a short side trip into Local Area Augmentation Systems (LAAS) and Wide Area Augmentation Systems (WAAS): both highly effective — and now both certified — means for getting aircraft “wheels on runways.” (Shucks, maybe we need even a further side trip into what constitutes “certified”…)
“Certified” for airborne things means that the aviation authorities have looked closely at how something was developed, tested, and qualified to meet the requirements set for people who make and sell systems, and the agency has decided that you did the job correctly and the system is good to use. The system could be an airplane, a switch on a panel in the galley, or an avionics system which lands the aircraft, and many other bits and pieces that help get you from the departure gate to luggage claim at your destination.
LAAS (also known as Ground-Based Augmentation System — GBAS) is a ground-based landing system which uses GPS to guide aircraft to a runway — there is a local ground installation with several antennas around the airfield, and a VHF radio uplink to approaching aircraft. It all works if the aircraft is also equipped with a VHF receiving radio and a LAAS-configured airborne GPS receiver. There’s also likely a Flight Management System (FMS) on the aircraft that enables navigation within today’s complex air-traffic-control systems. The LAAS system on the ground works high-integrity magic and provides precision GPS corrections to the aircraft GPS.
WAAS (also known as Satellite-Based Augmentation System — SBAS) also has parts which are ground based, in that there are a number of widely separated ground stations (hundreds of miles apart, across the whole country), each installed with a number of GPS receivers which, together with a ground data analysis system, assess the performance of the GPS constellation. A WAAS correction signal is then sent up to geostationary satellites which re-broadcast the correction signal to aircraft equipped with WAAS-configured GPS receivers flying within the geo signal footprint. The airborne receiver gets higher accuracy combined signals and an integrity message which regulates en-route and approach navigation.
OK, then….
Before GPS, everything landed using the Instrument Landing System (ILS) — an analog system developed as far back as World War II. GPS Localizer Performance with Vertical guidance approaches (GPS LPV) allow instrument approaches down to 200 ft height at ½ mile from the runway, which is what airborne receivers using the WAAS system are now able to achieve. As of March 10, 2011, FAA has published a total of 2,394 LPV procedures at 1,260 airports, which is more than twice the number of published ILS approaches.
It’s always been an objective for the FAA WAAS folks, that they improve the integrity of their system to allow high-precision approaches for all types of aircraft, but especially for commercial transport aircraft. For one reason or another the airframe manufacturers focused on making LAAS work on their airplanes first, so WAAS approaches and landings have been a rare and wonderful thing, and general aviation seems to have benefitted most from WAAS LPV. Until recently that is….
Canadian North, based in Yellowknife, Northern Canada, has a heck of job maintaining scheduled service in the severe weather they experience up there at the top of the world. The airline flies to a whole bunch of Northern outposts and connects remote communities with major population centers including Ottawa, Edmonton, Calgary, Winnipeg, and Halifax. During some of the extreme weather experienced from time to time, Canadian North has in the past canceled a significant portion of its scheduled service. The communities in the north absolutely rely on regular air service for survival, so anything which improves service reliability is also really good for the people living in those remote areas.
So when the team of CMC Electronics and Logic-Air Aviation Services — all in and around Montreal, Canada — came up with a solution using the CMC high-precision airborne GPS WAAS sensor, Canadian North became one happy operator. With a really simple ILS look-alike installation, Canadian North now has capability for GPS LPV guidance on one of its Boeing 737-300 aircraft, and can fly in pretty bad weather that previously held them on the ground. The installation is simple, was made without rework of other aircraft systems, and looks exactly like the ILS system the pilots flew with previously. It’s so much like the previous ILS that there was no requirement for any additional aircrew training to operate the system.
When I talked recently with Leo Eldredge, the FAA’s GNSS program manger, he told me, “We feel this is another great milestone for acceptance of WAAS by air carriers, particularly those operators with older aircraft that want an economical pathway to full RNAV capability with LPV approach procedures. We also see an opportunity with the Canadian North aircraft as a potential to demonstrate the feasibility of LPV autoland approaches.” So FAA sees this as good news, it would seem.
Fortunately, there are now several other manufacturers who also market receivers and systems approved for GPS LPV approaches for general aviation aircraft, commercial transports, and helicopters including Garmin, Universal, Free Flight, Avidyne, Rockwell Collins, and Honeywell, so the switch-over from ILS to GPS approach and landings is now well underway.
Aviation LightSquared. Except… the whole GPS infrastructure on which aviation depends in North America seems to be threatened by a decision to allow a high-powered out-of-band transmission adjacent to the protected ARNS frequencies. As anyone with basic radio frequency experience knows, high-powered transmissions tend to have side-bands which mix down or up to cross into adjacent frequency bands. In Europe, such high-power transmissions from TV towers spilling over into the ILS frequencies resulted in an international decision to pursue the Microwave Landing System, long before GPS was eventually selected as the system which aviation will use to navigate and land aircraft. For those of us who travel by air, let’s hope that common sense prevails and that the LIghtSquared transmissions are eventually allocated to alternate frequencies, where there will be no risk of impingement on such a safety-of-life critical aviation system as GPS.
By Oscar Pozzobon, Chris Wullems, and Marco Detratti
Modern GNSS will provide access control to the signal through spreading-code encryption and/or authentication at the navigation data level. This will require support within the receiver for secure cryptographic keys and the implementation of security functions. This article reviews vulnerabilities of these security functions, and reviews design considerations to mitigate attacks.
The threat of spoofing attack on GNSS has led to the design of signals and receiver technologies addressing this problem at signal, data, and receiver levels. Transportation, governmental, financial, and access-control applications demand trusted position velocity and time. Security functions in the receiver require implementation of cryptographic functions and key storage in the receiver. We can distinguish three uses of cryptographic keys and functions:
signal access control;
navigation data authentication and access control; and
position, velocity, time, and signal authentication state privacy and integrity.
The need to protect the cryptographic functions and keys, software, hardware, and data communication of next-generation secure GNSS receivers against attacks is imperative, to prevent signal spoofing and signal and position access to an hostile party. Here we provide guidelines that can support the design of tamper-resistant GNSS receivers.
Signal access control is achieved through spreading-code encryption. The spreading sequence is encrypted with a stream cipher, and the receiver needs the key in order to locally reproduce the signal and perform operations of acquisition and tracking. If the stream cipher frequency is considerably lower than the original code chipping rate frequency, such as the GPS W-code with respect to the P-code, other codeless and semi-codeless techniques can be used for signal tracking. However, these techniques lie outside the objective of this study that will focus on the need for keys to decode the signal, and the requirements to protect them.
Direct sequence spread-spectrum (DSSS) access-control schemes can be implemented with a binary-stream cipher that acts as pseudorandom spreading sequence, or the spreading sequence can be modulo 2 summed to a stream cipher at the same or different frequency. The encryption module in the transmitter needs the key and initialization vector (IV) to perform the encryption operation. It is assumed that the transmitted signal (neglecting signal amplitute) will be:
(1)
where Oak and Obk are the publicly known spreading codes such as the C/A and P-code of GPS for every K satellite, SCk is the is the stream cipher (W code for GPS) and Dk is the transmitted data. After the AD conversion the signal will be:
(2)
where e(n) is the thermal noise introduced in the sampling process.
After the carrier removal by multiplication with sin (2π fIFn) to obtain the quadrature arm containing the encrypted signal, and after the application of a low-pass filter to cut the 2π (2 fIF) frequency, the remaining signal for every satellite is:
(3)
The encryption module in the receiver needs the key and IV to recreate the local signal and perform code acquisition and tracking. Cryptographic keys in GNSS are assumed to be secured in the ground and space segment, and the ground control center performs operations of key loading to the satellites. However, key loading to the GNSS receiver is a sensitive operation. An adversary might obtain the keys and use them to access the encrypted signal in other receivers.
A malicious key recovery could be used to generate false encrypted signals, leading to a risk of signal spoofing. Key loading to the receiver can be achieved with a public key encryption and public key infrastructure, where the stream cipher key and IV are encrypted with the receiver public key, and only the receiver private key can decrypt the cipher key and IV.
The receiver private key and stream cipher key must be protected by a tamper-resistant module to prevent attacks. Figure 1 shows a high-level block diagram of a GNSS receiver with functions to access encrypted codes. There are two areas to be protected, depending on the security objectives:
Limit access of the signal to a restricted group: prevent signal spoofing. The red blocks shows the critical components to protect these objectives, including the storage of the secret keys, the stream cipher generation, and the final local secret code (LSC) replica (4) which is a noise-less signal from which the stream cipher can be easily obtained by modulo 2 sum of the local not-secret Obk code (5).
(4)
(5)
The red blocks should be protected in order to avoid key recovery or cipher stream analysis by an attacker.
Figure 1. Signal access control sensitive blocks.
Control access to Position, Velocity and Time (PVT). The yellow blocks show the critical components that should also be further protected in order to limit the PVT access. The tracking functions provide information such timing and pseudorange measurement that can be used for positioning, and the communication line should be protected. The navigation processing block performs the position and time solution, and the access to the data shall be protected.
Data Authentication, Access Control. A system might provide access control and authentication to the navigation data only. In such a design, the spreading sequence is publicly known, while the data is encrypted or contains authentication messages. The security objectives can be distinguished as:
◾ Access control to data of the acquisition and tracking functions. If fundamental parameters for the position solutions are encrypted (such as transmission time and satellite position) and therefore unavailable, a GNSS receiver could attempt the PVT solution with standard approaches. Therefore the Navigation Message Encryption (NME) restricts the access of PVT only to the user group that has the cryptographic keys for the navigation message decryption.
◾ Navigation Data Integrity. Navigation data can be authenticated (with cryptographic authentication schemes such as Message Authentication Schemes [MAC] or digital signatures). The objective of Navigation Message Authentication (NMA) is to provide an enhancement to the integrity of the messages towards intentional attacks. Such design can be an option in order to reduce the signal spoofing risk, as an attacker needs to rely on the messages (with a receiver-spoofer architecture for example).
Figure 2 provides an high-level architecture of a GNSS receiver block diagram that supports NMA and/or NME. The red blocks shows the sensitive parts that must be protected. In case of NMA the key that verifies the integrity (for example, a public key certificate) must be stored securely to avoid an attacker substituting the key and spoofing the navigation data with alternative keys (for example, the root CA could be stored in ROM). A trusted clock component is included in the diagram, as it can be an interesting option to consider in order to avoid NMA spoofing attacks.
Figure 2. Schematic of assistance solution.
PVT and Signal Authentication State Integrity and Privacy. Many applications require a PVT integrity to be cryptographically verifiable. Applications that require secure tracking systems (anti-theft, hazmat tracking, road toll, navigation statistics for insurance companies) and information security applications based on GNSS (location-based access control and geo-encryption) require PVT integrity. It is trivial to tamper with the data communication between a GNSS receiver and a final application (for example, interfering with the serial output of the chipset) and generate false PVT, in a data-spoofing attack. In Figure 2 the cryptographic keys used to add integrity to the PVT messages are typically different from the keys used for NMA or NME, and are application-specific. Such an architecture could be also the choice for differential corrections authentication, where the navigation processing block could verify the integrity of the correction data before aiding the position solution algorithm.
Attacks on Security Functions
This section identifies attacks that can compromise the functions of the previous section. Attacks to the signal are not pertinent to this work. We distinguish the attacks in two main categories: physical attacks and side-channel attacks. Among physical attacks, we distinguish:
Microprobing. This refers to techniques that attempt to access the physical components of GNSS receiver such as the baseband processor and RAM/ROM memory chip surface to observe and manipulate sensitive data. A microprobing attack can be targeted to recover the cryptographic keys.
Focused Ion Beam. FIB is a technique for deposition and ablation of materials in semiconductors, where chip material can be removed with micrometer resolution. It consists of a vacuum chamber with a particle gun. FIBs are used by attackers for manually probing the signal of interest. A micrometer hole is created to reach the signal of interest and filled with platinum, terminating with a pad. The signal can then be connected to an external probe.
Software Attacks. These happen through vulnerabilities of the communication interface or security protocols, or through malicious firmware upgrades in the baseband processor.
Eavesdropping Techniques. These monitor sensitive communication lines (such as baseband to HW correlator where the spreading code could be observed).
The most common side-channel attacks are timing, power, and fault analysis, in which an attacker seeks to exploit side-channel information in order to recover a cryptographic key. The most effective mitigation strategy against such attacks is to design and implement the cryptosystems with the assumption that information (time and power) will leak. Different types of side-channel attacks and their respective countermeasures are:
Fault-Generation Techniques. These are used to investigate ciphers and extract keys by generating faults in the system, either by intentionally causing faults or by natural faults that occur. Faults can be most often caused by changing the voltage, tampering with the clock, changing temperatures, and applying radiation of various types.
Timing Analysis. This class of attack allows cryptanalysts to extract keys by analyzing the time taken to execute cryptographic algorithms. Every logical operation in a computer takes time to execute, and the time can differ based on the input; with precise measurements of the time for each operation, an attacker can work backwards to the input.
Simple and Differential Power Analysis. SPA or DPA is a class of attack that allows cryptanalysts to extract secret keys and compromise the security of smart cards and other cryptographic devices by analyzing their power consumption. Differential power analysis attacks use statistical analysis and error-correction statistical methods to obtain information about the keys.
Electromagnetic Radiation Analysis. This is concerned with the monitoring/recording of radiation for the purpose of obtaining information about the operation of associated hardware, which could be used ultimately to determine cryptographic keys. Fluctuations in current generate radio waves, making whatever is producing the currents, in principle, subject to a van Eck (TEMPEST) attack. If the currents concerned are patterned in distinguishable ways, which is typically the case, the radiation can be recorded and analyzed in order to infer information on the operation of such hardware.
Acoustic Analysis is concerned with the observation of the acoustic emissions from a chip in order to obtain information about the code being executed. Information about the operation of cryptosystems and algorithms can be obtained in this way. Flowing currents heat the materials through which they flow. Those materials also continually lose heat to the environment due to other equally fundamental facts of thermodynamic existence, so there is a continually changing thermally induced mechanical stress as a result of these heating and cooling effects. That stress appears to be the most significant contributor to low-level acoustic (that is, noise) emissions from operating CPUs. If the surface of the CPU chip, or in some cases the CPU package, can be observed, infrared images can also provide information about the code being executed on the CPU, known as a thermal imaging attack.
Mitigation Strategies
We derived several design considerations to mitigate attacks from our experience during the development of the Trusted Innovative GNSS rEceiveR (TIGER) project. The TIGER is a tamper-resistant GNSS receiver which provides PVT integrity, signal spoofing and jamming detection, and signal state attestation with an open GNSS signal.
Cryptographic subsystem. This is designed for resistance against timing-based attacks. Timing-based attacks targeted to the cryptographic module can be prevented by careful implementation of the cryptographic functions. A non-exhaustive list of countermeasures that can be considered for mitigation of timing-based attacks includes:
Ensure that the time a cryptographic operation takes is independent of the input data or key bits. These operations should take the same number of clock cycles.
Ensure that the software implementation of critical code does not contain conditional branches (i.e., IF statements). Functions should use operations such as AND, OR, or XOR instead .
Ensure time taken for multiplication and exponentiation is the same, such that an attacker cannot learn how many multiplications and how many exponentiations have been performed. A simple method is to always perform both multiplication and exponentiation.
Addition of delays such that all operations take the same amount of time, although this can have a detrimental effect on performance. The addition of random delays can increase attack difficulty.
Protection from Electronic Level Interception/Monitoring. One approach for mitigation of microprobing attacks is the use of a tamper-detection mesh. A tamper mesh acts as a continuously powered sensor in which all the paths are continuously monitored for interruptions and short-circuit. For single-chip solutions the mesh is integrated as a top-level metallization layer. For multichip solutions the mesh can be developed in order to cover all the sensitive components. In both cases the tamper-detection mesh is connected to a supervisory circuit that performs an action if tamper is detected such as zeroization of the cryptographic keys and the memory content.
The designer of the mesh must be careful in the pattern design in order to avoid entry points or escape routes that can easily provide access for an attacker. Such vulnerability was found for example in the ST16SF48A tamper mesh. One approach considered in the TIGER security mesh design is the combination of a tamper mesh glued with epoxy to a metal shield (Figure 3). The mesh is wired internally to a security supervisor and linked via connectors. Any attempts to lift the metal shields or tamper the mesh will trigger the security supervisor (SUP) that immediately erases the keys and memory. Furthermore the metal shield limits the electromagnetic emissions, reducing the risk of TEMPEST attacks.
Figure 3. TIGER tamper mesh concept.
Designing the PCB in order to run sensitive signals (such as data communication lines) in the inner layers is another security enhancement that has been integrated in TIGER. TIGER has been designed also to support the GORE Secure Encapsulated Module, which is an envelope that completely covers the module and is connected to the internal security supervisor. This tamper mesh is targeted at FIPS 140-2, Level 4, DoD, NSA Type 1 security and CESG Enhanced Grade security.
Security Supervisor Circuit. A security supervisor can be an option to monitor the tamper mesh status and other physical attacks. The concept of a security supervisor is to store the cryptographic keys in a secure memory, and erase them if a security event is triggered. Security supervisors support the security level requirements of FIPS 140-2 and Common criteria with functions as real-time clock, tamper comparator, tamper logic inputs (for case switch, for example), temperature sensor (required for FIPS 140-2 level 4), and nonimprinting key memory.
A security supervisor has been integrated in TIGER (Figure 4) to support these security functions and facilitate the certification process. The cryptographic keys are loaded to the security supervisor in a non-inprinting key memory via a security processing microcontroller, which performs encryption functions and GNSS security processing such as secure timing synchronization, spoofing, and jamming detection. The non-inprinting key memory addresses the security risk created by the tendency of the memory cells to exhibit charge accumulation or depletion in the oxide layers of the devices composing the memory cells.
Figure 4. TIGER hardware security components.
Standard Memory cells suffer from charge accumulation or depletion in the oxide layers when the data is stored over a long period of time, leaving an imprint of the data that was stored. This data can be recovered also after a memory clear operation.
The non-inprinting key memory addresses this security risk as the technology has been designed and developed to eliminate the problem of oxide stress with a continuous complementing of the device’s SRAM powered by the back-up battery. In case of tamper event the entire memory is cleared leaving no traces in specific sectors.
Tamper-resistant coatings (TRC). This is referred as the use of a protective layer of resin or thermal spray ceramic that limits the direct access to PCB traces and components. Although it can make the attacker’s job harder, with the possibility to break the outer layer traces or components at the first attempt, it does not stop subsequent microprobing attacks once the hardware design has been discovered.
Conclusion
Future secure GNSS receivers should be designed with the considerations presented here in order to protect sensitive signals and the position and time data integrity.
Acknowledgment
The TIGER project received funding from the Galileo Supervisory Authority, via the European Community’s framework programme ([FP7/2007-2013][FP7/2007-2011]) under grant agreement n° 228443.
The material in this article was first presented at the ESA/IEEE NAVITEC 2010 conference, in Noordwijk, the Netherlands, as “Security Considerations in the design of tamper resistant GNSS receivers.”
Oscar Pozzobon is the technical director and co-founder of Qascom S.r.l. Italy. He received a diploma in computer science engineering and a degree in information technology engineering from the University of Padova, Italy, and a master’s degree in telecommunication engineering from the University of Queensland, Australia.
Chris Wullems is a co-founder of Qascom S.r.l. Italy. He has been engaged in projects that range from secure tracking for hazardous and safety-critical applications to development of GNSS receiver security technologies.. He received his Ph.D. from Queensland University of Technology in Australia.
Marco Detratti received a M. Sc. in electronic engineering from the University of Perugia, Italy, and a diploma of advanced studies from the University of Cantabria, Spain. At present he is with the European GNSS Agency (GSA) acting as market innovation officer. His research interests include evolution of GNSSs, implementation and prototyping issues of GNSS receivers, and emerging applications of GNSS technologies.
The presence of different types of devices, spanning multiple GNSS receiver types, configurations, hardware, software, and consequent widely varying capabilites, among a user mix of vehicles, cyclists, and pedestrians, poses several engineering challenges for a V2X scheme in which all road users share data with each other and with the road infrastructure.
The use of location awareness for transportation safety, efficiency, and security — a major area of research and development for academics, automotive manufacturers, and organizations such as the U.S. Department of Transportation — has focused attention on enabling communication between vehicles and other road user entities in a concept know as V2X, a term encompassing both vehicle-to-vehicle (V2V) and vehicle-to-infrastructure (V2I) systems, so that they can share location and other status information. As a result, any road user entity may see all others around it. This capability is almost always built on GNSS technology.
Future V2X systems will be able to include all road user entities, ranging from vehicles to cyclists to pedestrians, in this information-sharing system. While it sounds natural for everyone to talk to each other and share data for collective benefit, the presence of different types of devices among this user mix poses several engineering challenges. As an example, a V2X device in a vehicle may have a built-in GNSS receiver with a roof-mounted antenna and another vehicle may have a retrofitted V2X device with a passive antenna and relatively limited accuracy capabilities. As the GNSS technology further develops, some vehicles may have multiple-frequency GNSS capability compared to legacy single-frequency devices. In essence, all compatible V2X devices will have to be carefully designed to ensure their interoperability with the rest of the system.
This article investigates positioning challenges arising from multiple GNSS receiver types, configurations, hardware, and software in a V2X operational environment. This produces a clear need to have minimum performance standards for V2X-capable GNSS receivers. The article further investigates the implications of land-based visibility obstructions on relative positioning, and implications on standalone position accuracy both as a result of limited GNSS satellite visibility and WAAS satellite visibility.
V2X Background
V2X systems rely on two critical enabling technologies: communications and positioning. Organizations and industry collaborations have developed and demonstrated various V2X systems over the last few years. These efforts have produced interoperable prototype V2V and V2I systems and over-the-air (OTA) messaging standards.
Figure 1 illustrates the general concept of combined V2V and V2I, or V2X. In a fully operational system, all vehicles and other road users carry short-range communication and positioning technology. At present, these technologies are expected to be based on dedicated short-range communication (DSRC) and GNSS, respectively. This enables each user to be location-aware and capable of sharing their location with others. Vehicles may use built-in systems, retrofitted devices, or those based on the occupant’s personal mobile device. Infrastructure elements and other road users such as pedestrians also form part of the V2X user community.
V2X Relative Positioning. Relative positioning of all communicating entities with respect to a given user is a required functional capability of a V2X system. To enable this functionality, positioning information from all communicating entities must be exchanged. For automotive V2X applications, Society of Automotive Engineers (SAE) J2735 DSRC Message Set Dictionary serves as the primary standard for message definitions. Current version of the messages consists of a basic safety message (BSM) , an optional variable rate message (VRM), and an option for including proprietary messages.
With BSM and VRM, vehicle position, speed, heading, and GNSS measurements can be communicated to others. GNSS relative positioning techniques such as real-time kinematic (RTK), code-based differential, or individual position differing (that is, distance between the positions reported by individual vehicles) can be used for relative positioning. The latter method, also known as DPOS, is a particular focus of this article.
Given the above, a system developer may develop a V2X relative positioning system that can operate based on techniques that can be broadly classified as position-based techniques, which include DPOS, and measurement-based differential techniques, including RTK and others.
The Simpler Approach. The SAE J2735 BSM accommodates the simpler approach of using the DPOS method, as it enables the sharing of critical state parameters. This approach is very attractive as it requires minimal OTA data volume compared to sending GNSS measurements. Secondly, DPOS relative position estimation process requires only a fraction of the processing resources required compared to measurement-based differential processing. Thirdly, any GNSS receiver in the market today is capable of outputting a position solution and most of the critical GNSS state parameters required for the V2X BSM. In contrast, most low-cost devices do not output measurements required for other methods.
However, there are quite a few challenges associated with DPOS. A vehicle or any other road-user entity, such as a location-enabled handheld device, will share its location information via BSM only. A relative positioning engine in each entity will use this information to provide lane-level and road-level data (relative distance, speed, and orientation) for its V2X applications. The challenges associated with DPOS method arise from multiple stages in this process.
The presence of many road-user types brings in the possibility of thousands of GNSS receiver types, models, hardware, and software in the user group. Thus the system must be interoperable with devices with a wide range of performance characteristics.
Secondly, each entity will transmit BSM only. This OTA information offers no information about the constellation the GNSS device sees or how the solution was derived in terms of filtering or applied constraints.
Thirdly, the position accuracy reported by each entity is a GNSS device-dependent variable, an estimate of the actual error as derived by a user device.
Finally and most importantly, V2X applications expect relative positioning information for each communicating entity classified in one of three possible accuracy categories: Which Road, Which Lane, or Where-in-Lane (see “Is GNSS up to the V2X Challenge?” GPS World, October 2010). The V2X system must be able to reliably identify this accuracy classification for each communicating entity with the limited information provided via the BSM.
Study Goals. To illustrate the impact of these challenges, several GNSS receiver types, configurations, and operational scenarios were investigated.
Between multiple receiver types: In a V2X environment, vehicles and other road user entities may have different GNSS receiver types and makes: dual-frequency, single-frequency, and so on.
Same receivers using different parts of visible constellation: In an urban canyon, it is possible for two adjacent vehicles to see two different parts of the GNSS constellation, due to obstructions.
WAAS-enabled and non-WAAS receivers.
Data Collection
This data is a combination of field-data collections and a series of RF record playbacks. The field vehicle-mounted test setup included two GPS receivers, a GNSS L1 RF data recording device, and a high quality GPS/INS reference system (Figure 2). Type A receiver is a hi
gh-sensitivity enabled, automotive-grade GPS L1 receiver using a patch antenna, WAAS-capable although WAAS usage was disabled in the real-time data collection. Type B receiver is a high-quality L1/L2 receiver using a geodetic-grade antenna, used with WAAS enabled. The GPS/INS system was connected to the geodetic-grade antenna. The RF recording system was also connected to the automotive-grade GPS L1 antenna.
Figure 2. Vehicle test set-up.
The data was collected on a test route in Detroit, Michigan, that included durations of urban and deep urban canyon (40 miles per hour (mph) or less), freeway (55–70 mph), and suburban/local (30 mph) driving.
The RF data were subsequently replayed to GNSS receivers that were not a part of the field set-up. RF data was also replayed to receivers with forced sky-visibility obstructions and various WAAS settings. For limited sky-visibility tests, certain satellites were removed from each receiver’s view by receiver-specific configuration software. The satellite selection and restriction was done to mimic typical sky-view obstructions encountered in normal driving.
Type A receiver was chosen to illustrate the impact of visibility differences. A total of 13 satellites were visible in the entire data set (Figure 3). To create obstructed sky-view scenarios, two Type A receivers were configured to not use certain satellites in their position solutions. These configurations were:
Configuration 1 (C1): PRNs 7, 10, and 13 blocked
Configuration 2 (C2): PRNs 6, 16, 21, and 31 blocked
C1 mimics a vehicle/receiver with no visibility in the Northwestern part of the sky, whereas C2 mimics a receiver without visibility in the East/Northeastern part of the sky. Sky visibility restrictions do not vary with the heading changes of the vehicle. For example, for C1 receiver, Northwestern sky is always obstructed regardless of the vehicle orientation.
Figure 3. Sky view during the test.
Figure 4 shows an example RF data replay setup. The record and replay system was controlled through a PC and the recorded data was also stored in the controller PC. The output RF signal was split into multiple outputs such that multiple receivers can be tested at the same time. For each replay of the RF data, a benchmark receiver was also used to verify that there is no run-to-run difference as a result of the RF replay.
Outputs from each GPS receiver from field and replay runs were logged to PCs using receiver specific binary formats. The recorded output from each receiver included its position, position error estimate, velocity, satellite-specific measurements and indicators such as pseudorange, carrier phase, and signals-to-noise ratio.
Figure 4. RF data replay set-up.
Data Processing and Analysis
The data was first decoded from the receiver-specific formats to a common format, then corrected for antenna offsets. To simplify the process, the reference system position solution was translated to the position of the test antenna using the known between-antenna distance and orientation of the vehicle as measured by the reference system. As a result, all the receivers and the reference system are reporting the location of the test antenna. Then, data fields such as position and velocity for each receiver were time-matched with the reference solutions, and the actual error was calculated.
For a limited dataset, additional measurement-level differential processing was done to show the difference between a DPOS and an RTK or a code-based differential relative position solution.
Figure 5 shows a plot of the 2D position error observed from each receiver during the test as a function of driving environment. Overall, Type B receiver shows better accuracy as expected from a dual frequency high quality receiver. However, it shows spikes of large error increases at times, mostly observed in the freeway scenario with large error excursions. With Type A receivers, relatively larger errors are observed with the limited-constellation receivers.
Figure 5. Position error (2D) of each receiver as a function of driving environment.
Figure 6 shows the number of satellites used by each receiver in the same environments as in Figure 5. Overall, Type A receiver tracks and uses on average 2–3 satellites more compared to the Type B receiver, likely due to its high-sensitivity capability. Type A C1 and C2 receivers also track and use 2–3 satellites fewer compared to the all-in-view Type A receiver.
Figure 6. GPS satellites used by receivers.
Freeway Data. The vehicle heading in this segment was predominantly north or northwest. The sky view can be considered a combination of urban and open sky conditions. As highlighted in Figure 6, all-in-view Type A receiver was able to use up to 11 GPS satellites with an average of around 9 satellites. Type A C1 and C2 receivers used, on average, about 3 satellites fewer than the all-in-view receiver. All three receivers show satellite count drops down to 4 at certain times in this segment.
The satellite count of the Type B receiver shows the limitations of not using the high-sensitive tracking capability. The satellite count shows frequent drops below 4 satellites and on occasion down to no satellites used.
Although the satellite count difference between all-in-view Type A and C1/C2 receivers was forced by means of receiver configuration, short-term sky visibility restrictions that resemble these conditions are in fact possible. Examples include a passenger car driving next to a semi truck or the side wall of the freeway in below-ground road sections.
Figure 7 shows the position outputs of all four receivers on a satellite image of a short segment of the freeway. The true location (reference) is shown in green. Type A, Type B, Type A C1, and Type A C2 are shown in red, black, purple, and blue, respectively. These colors identify the four receiver types in all figures for the rest of this paper. While biases can be seen in the outputs of all four receivers with respect to the reference, the Type A C1 shows the largest offset with the magnitude of more than a lane width.
Figure 7. Freeway positioning accuracy.
Figure 8 illustrates a time series of the positioning error components of all four receivers. It clearly shows error ramp-ups from the Type B receiver at frequent intervals. These coincide with the satellite count drops of Type B shown in Figure 6. No such error ramp-ups are observed for any of the Type A receivers, although relatively large biases of the order of few meters can be seen. As anticipated, larger errors are observed in the height direction.
Figure 8. Freeway positioning accuracy time series.
Local Road, Eastbound. This segment includes data gathered on an eastbound multi-lane local road with 40 mph posted speeds. As shown in Figure 6, a relatively larger number of satellites were continuously tracked in this segment as compared to the freeway. Therefore, this segment is considered to be an open-sky scenario with very limited number of obstructions. As shown in Figure 6, Type B receiver has used about 6 satellites on average, whereas the Type A has used around 3 more satellites most of the time. Type A C1 and C2 have also used around 3 satellites less compared to the all-in-view Type A receiver.
Figure 9 shows the vehicle position as reported by all three receivers and the reference system output for a short road segment in this drive. It clearly illustrates the lateral offsets of both C1 and C2 solutions. The C2 receiver (Blue) generated about a lane width offset towards north whereas the C1 receiver output is biased by around two lane widths to the south. Figure 10 presents a time series look of the positioning biases evident in Figure 9. It clearly shows large (more than 5 meter) biases in North and East position error components for C1 and C2 receivers.
Figure 9. Local (east) positioning accuracy.Figure 10. Local (east) positioning accuracy time series.
Local Road, Northbound. In roadway characteristics, this resembles Local Eastbound. Figure 6 shows the sky view remained almost unchanged for Type A receivers. For Type A C1, the count remained at 6 throughout. C1 and C2 receivers tracked 2–3 satellites fewer compared to all-in-view Type A. Interestingly, Type B experienced two dropouts of 4 or fewer satellites during the run. Figure 11 shows the position output of all receivers on a short road segment. As in the case of Local (East), significant biases can be readily observed in the output of C1 and C2.
Figure 11. Local (North) accuracy.
Figure 11. Local (North) accuracy.
Figure 12 shows the time series view of the positioning error in this segment, confirming that the biases observed in Figure 11 are not short-term biases, but are in fact vehicle heading-dependent biases. The short-term biases seen in the Type B receiver output coincide with the change in the number of satellites used (shown in Figure 6). This illustrates the implications of different estimation methods used in the two receiver types. For instance, Type B receiver allows stepwise changes in its position estimate whereas Type A output tends to gradually converge to different states.
Figure 12. Local (North) positioning accuracy time series.
Urban Canyon. Results of the urban canyon segment of the drive are shown in Figures 13 and 14. A statistical analysis is not presented for this segment, as receiver type and configuration dependent biases and errors are difficult to isolate from the errors that are the result of multipath and measurement noise. In Figure 14, much larger biases in the order of 10 meters or more can be seen for all three Type A receivers. In comparison, Type B receiver tends to output a relatively accurate position solution whenever it has sufficient satellites visible. In the case of less than optimal satellites availability, Type B receivers tend to show rapidly degrading positioning accuracy, which may be reliably detected using its quality indicators.
Figure 13. Urban canyon accuracy.
Figure 14. Urban canyon positioning accuracy time series.
Position Error Distributions
Position error probability distribution functions were generated for the first three road segments using the time series data above. Figures 15-17 show these functions for Freeway, Local (East), and Local (North) segments, respectively. They lead to these general conclusions:
Based on the mean and the spread of the distributions, Type B receiver has consistently provided the most unbiased and accurate positioning performance out of all the receivers considered. Overall, the output appears to be unbiased, as should be the case for a high quality dual frequency receiver with WAAS capability.
Type A all-in-view receiver shows the next best overall accuracy statistics with some biases in certain cases. These biases can be time-of-day-dependent and may differ for different times of the day or if observed over a longer time.
Type A C1 and C2 receivers show very significant vehicle-heading-dependent biases/errors. This is with very limited sky view obstructions (that is, C1 only restricts less than 1/8 of the entire sky view whereas C2 covers around 1/4) and with the same type of the receiver.
Although enabling WAAS should theoretically help minimize the biases observed in these tests, the availability (open line-of-sight) of WAAS satellites for automotive applications in these environments must be taken into consideration for WAAS accuracy benefits to be applicable. For these datasets, WAAS signals availabilities for a Type B receiver were 58 percent of total driving time in urban canyon, 60 percent in the freeway scenario, 95 percent and 99 percent in the local road scenarios.
Figure 15. Freeway position error distribution.Figure 16. Local road (east) position error distribution.Figure 17. Local road (north) position error distribution.
Velocity Domain Performance. For each test segment, velocity estimates from each receiver were logged at the default data rate of 4 Hz. For analysis purposes, North and East velocity readings from each receiver were converted to 2D speed estimates. These were used with reference system speed estimates to generate 2D speed error statistics (Table 1).
Based on Table 1, no significant biases or errors were observed from any particular receiver or configuration. The only exception was the increased errors in the Urban Canyon segment, particular for C1 and C2. This is expected .to be a result of limited satellite availability in a challenging environment with additional forced satellite eliminations.
Virtual Two-Vehicle Analysis. Assume that Type A and Type A C1 receivers were located in two vehicles. Ideally, both receivers should report the same location, as they were both connected to the same antenna on a single vehicle, creating a zero-baseline scenario. However, as shown in the previous section, a meter-level separation was observed between the two solutions.
In this virtual two-vehicle scenario, relative position of one receiver (Type A) with respect to the other (Type A C2) was estimated by three methods, using GNSS data processing software in post-mission. The methods were:
Differenced Positions (DPOS). Latitude and longitude reported by each vehicle were time-matched; distance between the two points was calculated.
Code and Carrier. Single frequency (L1) GPS RTK positioning with float ambiguity estimation.
Code Only. GPS code measurements generated a relative position solution.
The 2D receiver separation results of this processing are shown in Figure 19 as three subplots for freeway (top), local/east (middle), and local/north (bottom) scenarios. The 2D separation results for local scenarios show clear performance benefits for the GNSS measurements-based methods. In both east and north local scenarios, around a 5-meter bias is observed in the DPOS solution whereas this is reduced to around a meter in both code-only and code and carrier methods. The freeway scenario shows relatively smaller difference potentially due to measurement noise, multipath, and frequent interruption of sky view. Table 2 shows mean values of these results.
Figure 18. Position separation for processing methods.Table 2. Mean Accuracy (meters) using processing methods.
Discussion
OTA transfer of certain GNSS measurement data elements appears to be a critical requirement for reliable lane-level positioning capability. However, the method must be capable of supporting a certain level of performance even in challenging environments for GNSS. The solution for such challenging environments is likely to be GNSS integration methods with vehicle-based sensors (that is, GNSS/INS) for the foreseeable future.
Given these facts, a reliable and accurate V2X relative position method will require the OTA transfer of a combination of critical vehicle states which include the vehicle location, a confidence measure, and certain GNSS measurement data elements. With its ability to support all of these needs, the SAE J2735 provides a basic framework for further refinement of relative positioning technologies for automotive applications.
A reliable position confidence measure broadcast over-the-air is also a critical need, particularly if GNSS measurement data is not broadcasted on a regular basis. This also holds true for conditions under which a vehicle may be operating in a GNSS and vehicle sensor integrated mode or with less than optimal number of satellites in view. However, estimating such a parameter that can be trusted with high degree of confidence can be challenging given the presence of various biases that can depend on the environment, vehicle, GNSS receiver, and sensors and methods used. Potential examples are time-of-day, vehicle heading, vehicle speed, GNSS receiver/sensor type, model, and configuration. However, developing a parameter similar to the RTCA Horizontal Uncertainty Level (HUL) for automotive applications is an important consideration.
While there are many other candidate receivers to be considered for a study of this nature, only two receiver types were used in this analysis. Analysis of more receiver types can be beneficial to identify the desired characteristics for a certain applications. A consideration could be achieving a desirable balance between accuracy and the sensitivity of the GNSS receivers, as increased sensitivity often produces higher solution availability at the cost of degrading accuracy.
Another area to investigate in related work is the benefits of using WAAS under the test conditions given in this paper. The general expectation is to see less bias in the position solution with WAAS as the ranging errors are likely to be smaller as a result of WAAS corrections. However, for automotive applications in particular, availability of WAAS signals to land vehicles need to be investigated.
CHAMINDA BASNYAKE is a senior research engineer at General Motors Global Research and Development and GNSS technology expert for GM OnStar. He leads GNSS-based vehicle navigation technology R&D efforts at GM and holds a Ph.D. in geomatics engineering from the University of Calgary.
An Assisted-GNSS Solution Uses the EGNOS Data Access Service
By Kevin Sheridan, Tomas Dyjas, Cyril Botteron, Jérôme Leclère, Fabrizio Dominici, and Gianluca Marucco
For use in billing drivers in road-user charging schemes, onboard units employing GNSS must meet stringent reliability and availability requirements, and at the same time, be based on low-cost equipment systems. The SIGNATURE unit includes an assistance service which provides ephemeris data and corrections from EDAS, optimized for user location.
As roads become more congested, governments and regional authorities seek better ways to manage their existing networks. Road-user charging (RUC) is increasingly promoted to tackle the congestion challenge: charging drivers a fee, perhaps on a monthly billing basis, derived from the distance their vehicles have traveled, time of travel, and whether congested roads were used.
Recording trip information with a GNSS receiver in an onboard unit (OBU) provides a convenient and flexible means to support automated fee collection. For GNSS positioning to be used as the basis for billing drivers, however, it must meet stringent reliability and availability requirements, and at the same time be based on low-cost equipment.
We have developed a prototype to provide both the positioning availability and integrity required for this application. The Simple GNSS Assisted and Trusted Receiver (SIGNATURE) includes an assistance service that provides ephemeris data and corrections from the European Geostationary Navigation Overlay Service (EGNOS) Data Access Service (EDAS), optimized for the user location. Assistance messages are sent to OBUs that can either host an experimental receiver or a commercial-off-the-shelf (COTS) receiver. Data from the receiver is processed with application-specific navigation algorithms on the OBU that aim to improve the integrity of the position solution relative to standard solutions.
Field trials have assessed the contribution that assistance can make to positioning performance, and illustrate options for enhancing standard assistance solutions. Enhancements to assistance encompass modifications to the message content and alternative means of communications, showing the benefits and feasibility of a broadcast service. The impact of including EGNOS corrections through a broadcast assistance service in urban areas is also under investigation.
GNSS Road-User Charging
RUC has the potential to reduce congestion, lower vehicle emissions, and generate revenue streams for infrastructure improvement. It can ensure that revenues are based on actual road usage, creating a financial incentive for changing driving behavior. This might include lower overall use of private cars and, in particular, reducing peak-time travel levels in urban areas by effectively spreading out the morning and evening rush hour. RUC can also encourage commuters to use alternative forms of public transport.
To automate the process of collecting charges, electronic fee-collection (EFC) systems have been developed based largely on dedicated short-range communications (DSRC). In a DSRC solution, a simple tag on the vehicle receives a signal when it passes a roadside beacon and a charge is computed accordingly. Cameras with automatic number-plate recognition (ANPR) technology are also widely used, mainly as an enforcement tool.
Both technologies rely on fixed roadside infrastructure. As charging schemes to date have focused on specific areas (individual cities) or road infrastructure (major motorways, tunnels, and bridges) this type of technology provides an adequate solution.
To meet future policy goals, however, this is not feasible. More extensive charging schemes covering greater areas, more road types, more classes of vehicle, and which will vary charges depending on location and time of day require a far more flexible solution. Flexible schemes require the positioning element to be onboard the vehicle. GNSS-based devices, possibly augmented with other sensors, have been identified as the best option to achieve this.
Using GNSS, the OBU tracks the location of the vehicle, and this is matched against the road network to calculate a charge. A GNSS solution can support many different charging strategies including time distance and place (TDP) based charging for road sections, geographic areas, and cordon schemes. While GNSS offers great potential, several operational and performance limitations have prevented more widespread adoption. Operationally, OBUs are relatively expensive, fraud prevention is potentially complex, and charging schemes must also accommodate infrequent users. GNSS performance is limited in terms of the ability to provide sufficiently accurate positions with high availability and integrity in all operating conditions.
To be fully flexible and to target congested areas, OBUs must work in all environments including urban areas. Urban-canyon problems, with satellite signals blocked and reflected, are well documented. In some cases, not enough signals are available to determine a position, and when there are enough satellites, the ranges will be prone to errors and the geometry is likely to be poor. Signals are more likely to be available in the longitudinal direction of the street, but with few or no satellites on either side of the vehicle. Signal blockage is a particular problem when the GNSS receiver is started up, and it attempts to decode satellite ephemeris data. This requires around 30 seconds of uninterrupted tracking with a relatively strong signal for each satellite, and in an obstructed urban environment it may take many minutes to determine the first receiver position.
Charging schemes typically aim to charge for at least 99 percent of road usage. If a typical journey length is 30 minutes, this means that only 18 seconds with no usable position solution can be tolerated and hence time to first fix (TTFF) must be below 18 seconds, and ideally much lower.
When positions can be determined, they must be sufficiently accurate to identify the correct road segment that the vehicle was on, and they must be reliable. Reliability, or integrity, becomes critical if road users are to be charged on the basis of GNSS-derived positions. Users must have confidence that they are being charged correctly for schemes to be effective and to gain public acceptance.
Whilst GNSS-based solutions are entering the market, for example in Germany and Slovakia for heavy goods vehicles, barriers to wider adoption remain. Many countries are considering GNSS-based road pricing, and they all face similar challenges in ensuring the accuracy, integrity, and availability of a GNSS-based solution for nationwide deployment.
SIGNATURE Solution
The principal objective of the SIGNATURE project is to prototype a GNSS-based solution for flexible road-user charging that can provide the required high integrity and high availability in a cost-effective and scalable manner.
This robust, high-availability, high-integrity solution is delivered firstly through providing reliable assistance (A-GNSS) data from EDAS to optimize receiver acquisition and tracking capabilities and reduce TTFF, and secondly through implementation of embedded GNSS reliability algorithms into an OBU, providing assurance of positioning information (Figure 1, at top).
These features are intended to make a positive contribution in terms of the key RUC performance criteria, as defined by the GNSS Metering Association for Road User Charging:
Accuracy: right cost per trip
Integrity: probability and amount of overcharging
Availability: amount of charged usage.
Assistance Server. An assistance service supplying suitably equipped OBUs is one means to maintain rapid TTFF and meet the requirement for high positioning availability. The most significant contribution assistance can make to TTFF is to provide the
ephemeris data, which takes around 30 seconds to download from a satellite signal. Assistance data can also reduce the frequency search space when a receiver is acquiring signals, as the expected Doppler frequency can be computed from the approximate receiver and satellite positions.
The assistance server in SIGNATURE is based on EDAS, currently available as a beta version. EDAS allows a user to plug into EGNOS to receive the data collected by all the current EGNOS Ranging and Integrity Monitoring Stations (RIMS). This makes it possible to access EGNOS data when there is no clear sight to the EGNOS geostationary satellites, which can often be the case in urban areas, particularly at higher latitudes. As well as supplying EGNOS messages, EDAS also provides GPS observation and navigation (broadcast ephemeris) data, the key component as far as an assistance service is concerned. By recording the ephemeris data received at the extremities of the monitoring network, it is possible to ensure that the current ephemeris for any GPS satellite in view to users over Europe is available and can be supplied in an assistance message. Other data streams provided by EDAS can also be used to enhance the assistance solution.
The main enhancement tested in SIGNATURE was the use of EGNOS corrections within the assistance message. EGNOS today consists of a space segment of three geostationary satellites broadcasting correction and integrity information in the L1 band. Three sets of corrections are broadcast to users:
Fast corrections: used to compensate short-term disturbances in GPS signals, generally attributable to satellite clocks;
Long-term corrections: used to compensate for the longer-term drift in satellite clocks and the errors in the broadcast satellite orbits
Ionospheric corrections: broadcast as a grid of vertical delays (GIVD) from which a user receiver can determine a slant correction to be applied on each range measurement to compensate for the delay experienced by the signal as it passes through the ionosphere.
Fast and long-term corrections are added to the ephemeris data in the assistance message. Rather than relaying the GIVD data to the OBU and letting the receiver reconstruct the ionospheric grid and calculate slant corrections, this is done within the assistance server. A slant correction is provided for each satellite that will be in view at the user location. This approach is valid provided the OBU updates the corrections regularly enough to take account of the changing satellite elevations and ionospheric conditions. It provides a significant saving in terms of processing and memory consumption at the OBU, while still delivering the accuracy benefit of the EGNOS ionospheric data. To correct for the tropospheric delay, a zenith value (ZTD) determined from the RTCA model is also included in the assistance message. Mapping this zenith value to a slant correction to be applied to satellite ranges is a straightforward process easily accommodated on the OBU.
Figure 2 shows how data from EGNOS RIMS is collected at the assistance server at NSL in Nottingham, UK, and then used to generate messages. In this case, the assistance data was provided for trials conducted in Brussels. The figures at the bottom of the plot are the EGNOS correction values provided for all 10 GPS satellite in the positioning solution.
Figure 2. Schematic of assistance solution.
Further enhancements are also possible using the GPS observation data provided through EDAS. Firstly, for areas close to RIMS, a local differential solution can be applied using standard DGPS techniques to provide pseudorange corrections rather than wide-area EGNOS corrections. This has the potential to give greater accuracy for certain areas and is under investigation. By combining EDAS data sources, a GNSS performance monitoring and prediction service has also been created (Figure 3). This provides an assessment of GPS and GPS+EGNOS positioning performance (accuracy, availability of corrections, integrity) at known reference stations as well as monitoring the availability of EDAS data from its central server. Monitoring of this kind can be used as a further tool to identify system-level problems that might significantly degrade user positioning solution, perhaps to a level at which charges could not confidently be applied. It can also aid the enforcement process, as a diagnostic tool to identify if missing or misleading data from an OBU could be due to a system-wide fault or to a more localized source.
Figure 3. GNSS performance monitoring using EDAS.
This approach relies on the approximate user position being known at the assistance server. To maintain the validity of the corrections, it would also require a receiver to update its assistance data at a much high rate than would usually be the case. For a large-scale operation this would be unfeasibly expensive using cellular communications (GSM/GPRS), however it would be possible using a broadcast assistance approach. Using a radio data service (RDS) broadcast for example, ephemeris data and EGNOS corrections could be provided on a continuous basis. RDS is an auxiliary signal to the FM radio broadcast system and is used routinely for supplying travel information to in-car navigation systems. As data is broadcast from known locations and over a definable coverage area, messages can be generated that are applicable for all users receiving data from a given transmitter. A drawback of RDS is that it has a relatively low bandwidth, and it takes approximately 3.5 seconds to broadcast an ephemeris message for a single satellite. A further argument against RDS as a long-term solution is that analog radio signals are progressively being phased out in favour of digital alternatives. With the far greater bandwidth of digital audio bßroadcasting (DAB), ephemeris data for 12 satellites could be broadcast in less than 1 second.
We are evaluating alternative message content and transmission options to determine if real benefits can be gained by providing additional content, other than the ephemerides, in the assistance message.
Onboard Unit. The SIGNATURE OBU (Figure 4) is based on a single-board computer (SBC) offering a high degree of flexibility. Developed by ISMB, it can host alternative receivers and positioning algorithms and manipulate different assistance data with a high degree of configurability. It is a powerful platform for developing and assessing OBU devices and their component parts, particularly as it allows lots of useful diagnostic data to be logged.
Figure 4. SIGNATURE Prototype Onboard Unit (OBU).
The OBU hosts a bespoke receiver which exploits the continuous availability of assistance data available through a high-speed data packet access connection and does not attempt to decode navigation data directly from satellite signals. This allows its design to focus on rapid signal acquisition with high sensitivity and to achieve a rapid TTFF even in areas where conventional receivers struggle. The SIGNATURE prototype has been designed using the well known SAT-SURF & SAT-SURFER platform.
The receiver, developed by the EPFL, implements massive parallelization by making use of the fast Fourier transform, leading to a processing power equivalent to approximately 650,000 equivalent correlators. The minimum sensitivity in acquisition is –145 dBm, obtained using coherent and non-coherent integrations. Thanks to the massive parallelization and the assistance, TTFF at –145 dBm is still below 3 seconds.
Positioning Algorithms. The OBU hosts positioning algorithms designed by NSL to provide high accuracy, availability, an
d integrity through exclusion of outlying measurements and provision of quality metrics (horizontal protection levels or HPLs). Numerous positioning algorithms and outlier detection strategies are being investigated. These include consistency checks applied to raw measurements and computed positions and receiver autonomous integrity monitoring (RAIM). EGNOS corrections are applied to improve accuracy and integrity indicators (user differential range error indices) are used as coarse fault-detection barrier. Consistency checks on measurements include differencing pseudoranges between epochs and checking that this rate is below a defined threshold. A RAIM algorithm is then applied to detect and exclude outliers before measurements enter the main navigation filter. Positions and velocities determined by the filter are then checked again as a further fault barrier. Checks at this stage identify if speeds are within expected ranges for the application and whether height changes are reasonable, for example.
The RAIM algorithm is based on the maximum normed residual method. For the detection procedure, the test statistic is calculated based on weighted sum of the squares of the residuals. This test statistic undergoes a globaltest (chi-square distribution), and is tested against thresholds that are computed based on the probability of false alarm (Pfa) and degrees of freedom (number of measurements minus number of unknowns). The exclusion procedure is based on an outlier detection technique also known as data-snooping, which is based on normed residuals and applied within the range domain. This technique uses measures of internal and external reliability, where the internal reliability gives estimates of how reliable the outlier detection procedure is, while the external reliability gives estimations of the influence of an outlier.
In the final step of the exclusion procedure, the maximum normed residual is tested against a critical value based on the normal inverse cumulative distribution, which in turn depends on the Pfa, and a decision is made on whether or not to exclude measurements. Having performed fault detection and fault exclusion until no further outliers are found, an HPL is calculated. This is the maximum horizontal position error that is guaranteed by the algorithm not to be exceeded, in accordance with the required probabilities of missed detection and false alarm. HPL is a function of visible satellites, expected error characteristics, and user geometry. Measurements which have been screened using the RAIM fault detection and exclusion are then processed in a Kalman filter.
Within the project, many alternative algorithms and configurations are being tested. As well as using RAIM in a snapshot mode to screen measurements entering the Kalman filter, fault detection can also take place within the innovation sequence of the filter itself. Weighting strategies that consider signal-to-noise ratios (SNR) as well as satellite elevations are also being used. This combined weighting is useful in reducing the impact of measurements affected by multipath in urban areas where simple elevation dependent models are often not applicable. The ultimate aim is to produce a robust GNSS positioning solution optimized for RUC in urban areas that balances the requirements of providing high availability with high integrity.
Test Methodology
The SIGNATURE end-to-end solution was tested in a series of field trials in the UK and Italy between April and July 2010. Trials took place in a range of operating conditions from rural areas with open skies to dense urban environments. In all trials, assistance data was provided from the service center in Nottingham, with messages tailored for the designated test area. The OBU recorded real-time position solutions as well as logging all raw measurements. Journey records can be sent back to the service center over a GPRS connection or can be downloaded back at the office. This allowed alternative solutions to be applied to the original datasets in post processing.
The position solutions were assessed through comparisons with high-accuracy GNSS reference solutions provided by additional onboard equipment and through processing with a map matcher (NSL’s Matchbox). Each journey record from a trial was compared against the known reference journey record to determine charging availability, accuracy, and integrity.
Using this approach, it is possible to assess whether improvements in the OBU position output are significant in terms of matching the vehicle location correctly to more road segments and with higher confidence. From direct comparisons between OBU positions and a high-accuracy reference solution alone, it is not possible to determine the significance of any changes in the OBU output in terms of final charging performance. Extensive trials of GNSS OBUs in London, for example, did not observe a relationship between location error (from OBUs) and performance at road segment level (map-matching) as map-matching can compensate for many errors. A strong relationship was observed between data availability and performance, though. Ultimately it is important to consider how successfully vehicle position can be related to charging objects, be they road segments, cordons or virtual toll-gates.
The objectives of the field tests were to:
Demonstrate that all elements of the end-to-end solution work as expected.
Assess the impact of assistance on TTFF.
Evaluate benefits of EGNOS data.
Investigate alternative positioning algorithms to optimize availability and integrity.
Demonstrate the feasibility of broadcast assistance using RDS.
Results
Field trials around Nottingham and Torino tested all elements of the solution. The tests confirmed the successful generation, transmission and use of assistance data, including EGNOS corrections. Position solutions determined onboard were transferred back to the service centre and processed with a map matcher. Figure 5 shows an example from a test in Nottingham city center, correctly identifying all the road segments travelled on.
Figure 5.Journey record view from Nottingham test. (Click to enlarge.)
Assess Impact of Assistance on TTFF. To examine the benefits of assistance, a series of trials were conducted to compare the TTFF of a consumer-grade receiver typically used in road applications against the performance of the SIGNATURE receiver that is assisted in all cases. They assessed TTFF for the COTS receiver in the following modes:
Hot Start: receiver has up-to-date almanac and ephemeris information so only needs to obtain timing/ranging information from each satellite to return its position fix;
Warm Start: receiver has the almanac information stored in its memory, but it does not have any ephemeris information. It also has approximate time and position knowledge. It can use this information to search for satellites but will then need to demodulate the ephemeris data from acquired signals;
Assisted: ephemeris provided over OMA-SUPL standard channel.
Table 1 shows the results from testing the receivers in open sky and urban conditions, specifically chosen to assess an extreme acquisition environment. In these tests when no valid ephemeris is available on a receiver at start-up, it takes an average of 28 seconds to determine a first position fix in open sky conditions. This increase to an average of more than 2 minutes in the worst-case urban environment as the receiver struggles to decode the navigation message on weak, noisy, and intermittent signals. With assistance, the SIGNATURE receiver maintains a rapid TTFF, outperforming the COTS receiver. The slower TTFF in the assisted COTS case may be partly due to the OMA-SUPL standard procedure
which is based on a more complex than the simple data transfer used in the SIGNATURE procedure. The COTS receiver is also decoding navigation subframes to determine signal transmission time. This can take up to 6 seconds depending on the point in the transmission cycle that acquisition begins.
Tests have also been carried out using a signal generator to control the strength of the received signal to assess acquisition and tracking sensitivity. At –145 dBm, the SIGNATURE receiver takes an average of 1.1 seconds to acquire 4 satellites and determine a first fix, and 5.1 seconds to acquire 12 satellites.
Positioning Algorithms. A variety of configurations have been investigated in the positioning algorithms, including applying outlier-detection routines at different stages of the solution and comparing snapshot and filtered approaches. Figure 6 shows a simple example of how the RAIM algorithm has been effective in detecting and excluding outlying measurements contaminated by multipath. By removing these meaurements and re-computing the OBU location, better position estimates are obtained.
Figure 7 shows the accuracy and integrity of the SIGNATURE solution assessed using a high-grade GNSS/INS reference in Nottingham city center. In this case, the horizontal accuracy is 4.4 meters (95 percent), and the computed protection level is shown to bound the actual position error with the required confidence.
Figure 7. Position error and protection level, Nottingham city center.
In rural, semi-urban, and urban (Nottingham) conditions, a positioning solution has been demonstrated that supports all charging accuracy, integrity, and availability requirements.
Further tests were also conducted in the center of London, in a worst-case obstruction environment. In this area the current solution falls just short of the requirements defined for this project. In such cases, better performance could be obtained using a hybrid solution making use of additional sensor inputs, but this will increase equipment costs and potentially installation costs, too. A more practical approach may be to simplify charging schemes in the densest urban environments, using zones and cordons rather than using more detailed approaches that require a continuous high-performance positioning solution to be maintained in all conditions.
Benefits of EGNOS Data. The SIGNATURE solution has the ability to provide EGNOS data to positioning algorithms on the OBU and to vary the rate at which this information is updated and used. Field tests have assessed the potential benefits of this source of data in various environments, starting from the case in which EGNOS messages are continuously available for the positioning solution and then investigating how any beneficial effects lessen as the data is provided less frequently. The greatest benefit from EGNOS was derived by applying corrections prior to performing the RAIM FDE algorithm. This led to more consistent measurements and produced lower HPL values. Figure 8 shows a comparison for a Nottingham test in which a GPS-only solution is compared against an EGNOS solution in which a full set of corrections is provided.
Figure 8. HPL GPS vs GPS + EGNOS.
This reduction in HPL values through the application of EGNOS corrections is clearer when the distribution of HPL values falling into discrete bins is assessed (Figures 9 and 10). Similar levels of relative improvement have been found through using this approach in all test datasets. The significance of these improvements can only be judged against the detailed specifications of a particular charging scheme.
Figure 9. HPL distribution GPS.Figure 10. HPL distribution GPS + EGNOS.
Conclusions
Using an assistance service based on EDAS, it is possible to achieve a TTFF of a few seconds, which supports the high availability requirements of RUC. Field trials showed that providing EGNOS information over the assistance data link had an integrity benefit. Applying corrections prior to a RAIM algorithm leads to more consistent measurements and reduces HPLs. Robust positioning solutions have been developed and implemented on the OBU, and a test methodology has been put in place to assess the impact on charging availability, accuracy, and integrity. Results indicate that GNSS-based road charging offers the performance and flexibility to meet current and future requirements, provided availability and integrity issues are properly taken into account.
Acknowledgments
The SIGNATURE project has received funding from the European Community’s Framework Programme (FP7/2007-2013) under Grant Agreement No. 228237 and is supervised the European GNSS Supervisory Authority (GSA). Full details of the project can be found at www.gnsssignature.org. Any views expressed here are entirely those of the authors and do not necessarily represent the EC.
Manufacturers
The SIGNATURE receiver is based on the Terasic Altera DE3 System with a high-density Stratix III FPGA (EP3S260), and on the Rakon GRM8652 high-performance front end.
Kevin Sheridan is technical manager at Nottingham Scientific Limited (NSL),where he works on development of robust GNSS positioning solutions for urban applications. He has a Ph.D. from University College London.
Tomas Dyjas is a navigation engineer at NSL where he develops and tests positioning algorithms for an experimental OBU for road-user-charging (RUC) and evaluating novel integrity approaches for aviation.
Cyril Botteron manages research and project activities of the GNSS and UWB research subgroups at the Ecole Polytechnique Fédérale of Lausanne (EPFL) in Switzerland. He received a Ph.D. from the University of Calgary.
Jérôme Leclère is a Ph.D. student at EPFL. His research focus is on acquisition and high-sensitivity GNSS receivers.
Fabrizio Dominici is the head of technologies for Galileo/EGNOS applications and embedded systems at Istituto Superiore Mario Boella (ISMB). He received a master’s degree in communications engineering from Politecnico di Torino.
Gianluca Marucco received a master’s degree in electronics engineering from Politecnico di Torino. His research interests include multipath mitigation techniques for future Galileo receivers and real-time performance monitoring services for EGNOS.
The European GNSS Agency (GSA) has published a 2010 GNSS Market Monitoring report, providing key information in support of entrepreneurship in the satellite navigation sector.
GNSS market forecasting is of great interest to private and public GNSS stakeholders, for business and strategic planning and policymaking, said the GSA. According to the new report, the market for GNSS will grow significantly over the next decade, at a compound annual growth rate (CAGR) of 11 percent, reaching €165 billion for the core GNSS market in 2020. Delivery of GNSS devices will exceed one billion per year by 2020.
“This Report confirms that the market potential of GNSS is significant,” said Gian Gherardo Calini, head of the GSA Market Development Department. “The information should be useful to researchers, market players and decision makers who want to grasp the GNSS market opportunities today and tomorrow.”
Report Highlights
Road leads the way: The report shows that the road transport sector is still the leading GNSS segment, accounting for more than 50% of market share. The penetration of receivers in road vehicles, today at 30%, will exceed 80% over the next decade. However, after a period of fast growth, market saturation and competition in the form of ‘smartphones’, often equipped with free navigation capabilities, have resulted in a slowdown in the car-based navigation market.
Price erosion has been high, driven by declining costs and strong competition. Vendors are using innovation as a differentiator resulting in ‘converged’ products with both communication and multimedia functionalities. Some Personal Navigation Device (PND) vendors are also tapping into new distribution channels, including car dealerships and smartphone application stores.
GNSS for road transport: The road transport sector is facing major challenges, such as the demand for increasing safety and for reduced congestion and pollution. These problems are particularly acute in highly populated zones, including big cities and suburban areas. GNSS represents a powerful tool for improving road transport. Not only does it help get drivers where they want to go more quickly and efficiently, but it also promises fairer road-pricing schemes, for example, to automatically charge drivers for the use of road infrastructure.
GNSS in your hands. Mobile location-based services (LBS) are taking off as progress is being made in different areas. More and more mobile phones now have GNSS capabilities, the result of both increasing consumer and developer awareness and an improvement in navigation services and performance.
All major mobile phone operating system vendors now provide application programming interfaces (API) with location functions. In 2009, in the UK, France and Germany, 5 out of the 10 best-selling iPhone applications were related to navigation or location-based applications. Also, 30% of Android developers’ contest winners used location capabilities in their applications.
A promising future for location-based services. The integration of accurate hand-held positioning signal receivers, within mobile telephones, personal digital assistants (PDAs), mp3 players, portable computers, even digital cameras and video devices, brings GNSS services directly to individuals, making possible a fundamental transformation of the way we work and play. The penetration of GNSS in mobile phones is therefore expected to increase very quickly, from some 20% today to above 50% within the next five years.
The GSA says Galileo in the future and EGNOS today open up new and exciting prospects for economic growth, benefiting citizens, businesses and governments throughout the EU and beyond.
Just the beginning. The GSA underlines that the GNSS Market Monitoring process is ongoing and future reports are planned to update information presented in this first report and to cover other sectors. The Agency welcomes stakeholder contributions.
Sensor Modeling and Sensitivity Analysis for a Next-Generation Time-Space Position Information System
By Mark Smearcheck and Michael Veth, Air Force Institute of Technology
Increasing availability and performance of state-of-the-art navigation sensors motivates the need for a highly accurate reference system commonly referred to as a time-space position information (TSPI) device. The Advanced Navigation Center at the Air Force Institute of Technology is working with the Air Force Flight Test Center to develop a next generation time-space position information (TSPI) system to be used for test and evaluation of modern navigation devices.
TSPI systems such as the GPS Aided Inertial Navigation Reference (GAINR) or Advanced Range Data System (ARDS) accompany navigation sensors during flight testing to collect the precise position, velocity, and attitude. Current GAINR TSPI performance levels include 1.0 m of position uncertainty, 0.1 m/s of velocity uncertainty, and 1.75 mrad of attitude uncertainty. Goal performance levels for next-generation TSPI call for an order of magnitude improvement over current systems.
A more accurate test and evaluation device will likely require fusion of multiple sensors of varying modalities such as GPS, inertial, electro-optical and infrared cameras, laser range sensors, barometric altimeters, ground-based theodolites, and ground-based tracking radar. This research aims to identify an integrated sensing package and the sensing techniques required to achieve the next generation TSPI accuracy.
In order to accomplish this task, a sensitivity analysis is performed that predicts the quality of the navigation solution attainable using various external sensor combinations. The sensitivity analysis requires sensor characterization and modeling in addition to development of a software simulated world (the flight test range) that the sensors are able to observe. Issues also investigated in this research include vision-aiding techniques, optical feature deployment, and testing in GPS-denied scenarios.
The GPS Aided Inertial Navigation Reference (GAINR) system consists of a Honeywell 764-G embedded GPS/INS with a custom control and recording unit. The data are post-processed using an optimal smoother and differential GPS measurements.
Sensors and Simulated World
The Air Force Flight Test Center currently obtains TSPI using the GAINR, which includes a navigation grade inertial measurement unit (IMU) and dual-frequency code-based differential GPS (DGPS). Carrier-phase GPS, if available, could be implemented to increase position accuracy.
When integrated into a highly dynamic platform, such as tactical fighter, a kinematic solution may not always be obtainable due to difficulty resolving integer ambiguities and cycle slips experienced in the receiver’s tracking loops. The sensitivity of both code and carrier-phase differential GPS is included in this research due to the uncertain availability of a kinematic solution.
Scenarios of GPS denial are always an area of concern for the warfighter, and thus GPS-independent test-platforms must be examined. Other positioning sensors, useful in GPS-denied testing, include ground-based theodolites and radars. These devices are installed at surveyed locations on the test range and are used to track the test aircraft. Theodolites are pivoting platforms that may contain various sensors and provide range, azimuth angle, and elevation angle measurements. Radars are also used to provide the same type of measurements, along with an additional velocity measurement (Figure 1).
Figure 1. Overview of possible TSPI sensors. The sensors consist of both aircraft-based and ground-based devices.
Onboard optical sensors including high-resolution digital cameras and laser range finders have also been investigated for TSPI use. This research proposes to install surveyed targets on the test range that are easily identifiable through feature extraction and tracking methods such as the scale-invariant feature transform (SIFT).
Cameras are able to observe position and attitude through homogenous pixel location measurements of image features (FIGURE 2).
Figure 2. Simulated test range at Edwards AFB that includes optical targets, ground sensors, and a flight test profile. Optical landmarks are randomly spread within the field of view of the optical sensor over the trajectory.
An objective of this sensitivity analysis is to show the attitude performance achievable through feature tracking of surveyed targets. When image-aiding of an IMU is implemented in a navigation filter, such as the extended Kalman filter (EKF), next generation TSPI level attitude accuracy should be reached.
The other optical sensor investigated, the laser range finder, is used to augment the navigation solution by measuring distance to the surveyed targets detected by the camera.
For the sensitivity analysis a simulated world is generated for the sensors to make observations. The world simulation includes GPS ephemeris, a digital terrain elevation database (DTED), gravity models, natural terrain landmarks/targets, manmade targets, a ground sensor deployment map, simulated flight test profile, and vehicle sensor installation lever-arms.
Sensitivity Analysis
The goal of the sensitivity analysis is to determine the minimal set of sensors that will meet next generation TSPI performance requirements. Sensor models and world characteristics are used to calculate expected position, velocity, and attitude uncertainty given a particular trajectory, sensor package, and feature set. The aircraft’s state vector, , as a function of the measurement, z, and uncertainty matrix, R, is represented as
where H is the observation matrix. The observation matrix is a Jacobian made up of partial derivates of each sensor’s measurements with respect to position, velocity, and attitude. Example H matrix elements include the partial derivates describing the camera measurements with respect to position and attitude. The partial deviate of the pixel coordinate, zi, of an image feature with respect to position, pn, is
where Tcpix is the camera frame to pixel frame transformation matrix made up of calibration parameters, sc is the line of sight vector from the camera to the target expressed in the camera frame, Cnb and Cbc are direction cosine matrices, and the subscript z denotes the z dimension of the indicated navigation frame. The partial derivative of the pixel coordinate of an image feature with respect to attitude, α, is calculated as
The H matrix’s partial derivatives describing observations from other navigation sensors are derived in our previous
work, “Sensor Modeling and Sensitivity Analysis for a Next Generation Time-Space Position Information (TSPI) System,” Proceedings of the ION International Technical Meeting, 2010. The a posteriori uncertainty of the state or sensitivity, P, at time k is calculated as
where P0 is the initial uncertainty.
Results
Results show the three sigma median uncertainty of position and attitude for various sensor combinations over a common flight profile through the test range (Figure 3).
Figure 3. Sensitivity analysis results of position and attitude with various sensor combinations. Scenarios of unobservable attitude are designed by the infinity symbol.
Conclusions
The sensitivity analysis indicates that the most practical sensor package that meets next-generation TSPI performance is the combination of carrier-phase GPS and a high-resolution camera tracking ten SIFT features per image.
In this example, tracking only two SIFT features per image does not provide the necessary level attitude accuracy, although incorporating inertial measurements is expected to reduce the overall number of features required per image.
In the absence of GPS, theodolites when coupled with a camera can function as a reasonable alternative. It should be noted that since the sensitivity analysis relies on a simulated world the feature tracking performance and target surveying accuracy may change during operational testing.
The next phase of this research is to integrate the sensors with an IMU using an extended Kalman filter. Fusion with a navigation-grade INS is expected to improve position, velocity, and attitude accuracy.
If simulated results are promising, the next phase of the effort will focus on collecting flight test data to validate the simulation and further increase the fidelity of the simulation.
Acknowledgment
The authors would like to thank the Air Force Flight Test Center for supporting this research.
MARK SMEARCHECK is a research engineer with the Advanced Navigation Technology Center at the Air Force Institute of Technology (AFIT) at Wright Patterson Air Force Base in Dayton, Ohio. He received his B.S. in electrical engineering in 2006 and his M.S. in electrical engineering in 2008, both from Ohio University. His research topics include micro-air vehicles, indoor navigation, image-aided navigation, pseudolites, and test range instrumentation.
LT. COl. MICHAEL VETH is an assistant professor of electrical engineering at AFIT and deputy director of the Advanced Navigation Technology Center. He received his Ph.D. and M.S. in electrical engineering from AFIT and his B.S. in electrical engineering from Purdue University. He is a graduate of Air Force Test Pilot School.
One-hundred-twenty meters of test track, designed for repeatable dynamic position testing, run along the roof of the new Nottingham Geospatial Building at the University of Nottingham, UK. The figure-eight track provides an optimal controlled environment with test equipment aboard a remote-controlled, multi-sensor 7¼-inch gauge locomotive platform with a top speed of 7 kilometers per hour, a dedicated power supply, and five antenna mounts. Simulation of the track using Spirent GSS8000 hardware (GPS and Galileo) provides additional planning and testing capacity.
The combination of these tools creates the ideal environment for our new project: augmentation of GNSS systems with ground-based Locata positioning technology. This pseudolite-like system, described in the March issue of GPS World, works in a GNSS-like fashion, using code and carrier phase. The major advantage, apart from utilization of the licensee-free 2.4 GHz frequency band, is the precise time synchronization of the network to the nanosecond level.
The proposed integration addresses Locata’s weak vertical coordinates (due to relative coplanarity of transceivers) and GNSS’s requirement for a clear view of the sky and location-specific weak geometric distribution of the satellites. Prior research and analysis suggests considerable improvement in 3D positioning accuracy when combining ground-based positioning devices (pseudolites) with GNSS, but the current project pushes the research forward by attempting to create on-the-fly ambiguity resolution.
Combination of hardware and software simulation has provided an initial assessment of the proposed integration, optimization of equipment location, and test of the mathematical model to be used. Practical tests, using the roof lab on top of the NGB, will further verify the method and allow comparisons between the predicted and real-life results. This will aid the assessment of noise, multipath, and in-bound interference. The test design minimizes the tropospheric effect, while track flexibility and repeatability offer the possibility of implementing and simulating obstructions and areas of GNSS outage. This will provide a full assessment of the mathematical model and the integrated system’s capacity.
This project offers new opportunities in civil engineering, specifically monitoring and machine control. GPS is currently widely used for those applications, with Locata also proven successful. The integrated solution can provide not only enhanced positioning capacity but lower the required number of visible GNSS satellites, and offer improved integrity and quality control, ultimately increasing the safety of life.
The intended utilization is for positioning in dense urban areas and essential structures (airports, seaports, factory sites, bridges) where sky visibility or correct satellite distribution cannot be guaranteed.
The track is available for other projects. Funded by East Midlands Development Agency, hosted by the Institute of Engineering Surveying and Space Geodesy, the Centre for Geospatial Science, and the GNSS Research and Applications Centre of Excellence (GRACE).