A new app from Esri called Explorer for ArcGIS puts mobile mapping and geographic content sharing at your fingertips.
Available right now for use on your Mac or iOS device (a version for Android is coming soon), you can use the app within your organization to find maps, locate assets and other geographic content, and share map presentations with colleagues. The interface is intuitive and requires no geographic information system (GIS) experience.
To become familiar with the app, tune in to the Esri live training seminar Boost Productivity with Explorer for ArcGIS. The presenters will show you how to use the app and share your data with other Explorer for ArcGIS users.
Esri.com/lts August 14, 2014
9:00 a.m., 11:00 a.m., and 3:00 p.m. (PDT)
After viewing this seminar, you will understand how to:
search for, discover, and explore your authoritative geographic data.
view asset information.
search for places and features in maps.
share your maps.
sketch on your maps to highlight important aspects of your data.
tell stories and brief stakeholders using map presentations.
This seminar will be of interest to those who want to share their authoritative content with anyone within their organizations, including executives, managers, and knowledge workers.
Explorer for ArcGIS is included with ArcGIS, so download the app from the Apple App Store, the Apple Mac App Store, or the ArcGIS Marketplace. Then open the app and sign in to your ArcGIS account. You will need a broadband Internet connection and an Esri Global Account to watch the live training seminar. Creating an Esri Global Account is easy and free: visit esri.com/lts, click Login, and register your name and address.
Proteus FZC, a provider of satellite-derived mapping and classification services, has launched a fast-turnaround habitat mapping solution designed specifically for Environmental Impact Assessments (EIAs). Through the service, Proteus delivers high-resolution classification maps of terrestrial areas onshore and the seafloor in shallow-water marine environments.
“Energy and infrastructure development projects are under intense pressure to delineate fragile habitats onshore and in the coastal zone as part of their EIA submissions,” said Proteus CEO David Critchley. “The accuracy of these maps determines budget levels for environmental protection and remediation efforts.”
The Proteus habitat mapping service can be completed in a fraction of the time and is cost effective compared with traditional mapping methods, the company said. The solution is designed for use by engineering and construction firms, environmental consultancies and government agencies involved in the development of energy infrastructure, pipelines, power stations, desalination plants, port facilities and other projects where EIAs are mandated.
Mapping sensitive marine habitats in the coastal zone is a particularly challenging aspect of EIA preparation, explained Critchley. Divers are typically deployed to collect hundreds of ground truth points underwater, which are later used to delineate the boundaries of various habitat or land cover types on the seafloor. This process is time consuming, logistically complicated and does not provide a full picture of the sea-floor environment.
“In addition, many marine environments are simply too dangerous or difficult for ground-truthing crews,” Critchley said. “And that can be true onshore as well.”
For its mapping solution, Proteus obtains high-resolution multispectral imagery from commercial imaging satellites, such as DigitalGlobe’s WorldView-2 platform, which are capable of quickly capturing data anywhere in the world without the limitations of aircraft and ships. Proprietary processing techniques derive accurate land cover and seafloor classifications from the image data for generation of habitat maps.
“For seafloor and terrestrial areas, we deliver habitat maps with horizontal accuracy of five meters,” Critchley said. “The quality and information content of these maps far exceeds those traditionally submitted with Environmental Impact Assessments, and satellite image is included in the deliverables.”
Offshore, the habitat classification process is accurate to a depth of up to 20 meters, depending on water clarity. The minimum mapping unit varies with the client needs and resolution of satellite imagery. Satellite-derived bathymetric data is also offered as a product of the technique.
Since 2011, Proteus has been delivering solutions for mapping and classification projects using multispectral satellite imagery. These mapping projects have been delivered for environmental, oil & gas, engineering and other coastal zone applications in Europe, the USA, the Middle East and Caribbean.
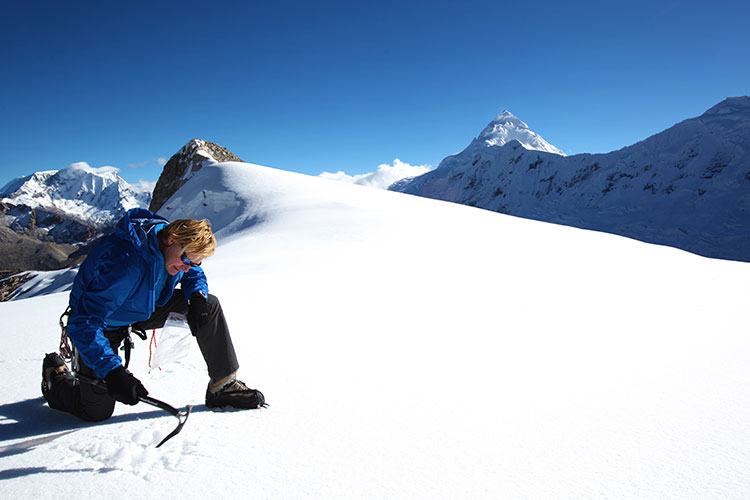
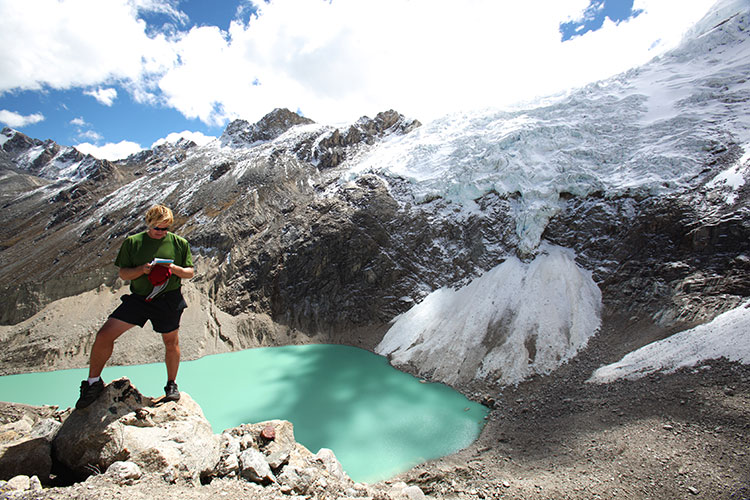
John All takes an ice sample from a glacier in the Ishinca Valley, Peru.
A climate scientist relies on a GPS satellite communicator to get him out of tight spots.
By Tracy Cozzens Photos by Clinton Lewis, Western Kentucky University
Please call Global Rescue.
John broken arm, ribs, internal bleeding.
Fell 70 ft crevasse.
Climbed out.
Himlung camp 2.
Please hurry.
That simple text message, sent May 19 via the DeLorme inReach communicator, alerted search-and-rescue monitors that the leader of a Himalayan research team was in dire straits.
Dr. John All, director of the American Climber Science Program (ACSP), was leading a team collecting snow samples in the highest mountain range in the world to study the impacts of climate change when he tumbled into a crevasse. “After crawling back for hours to my tent, I sent texts via my sat messenger for help,” All told the local Kathmandu newspaper.
Friends and family of the expedition followed the rescue efforts every step of the way as text messages were sent via the InReach to the ACSP’s Facebook page.
The climate scientist was rescued via a helicopter and admitted to Norvic International Hospital in Kathmandu with five broken ribs, a dislocated shoulder, and internal bleeding. After a day in the ICU, he was discharged for a week of rest before returning for further care in the United States.
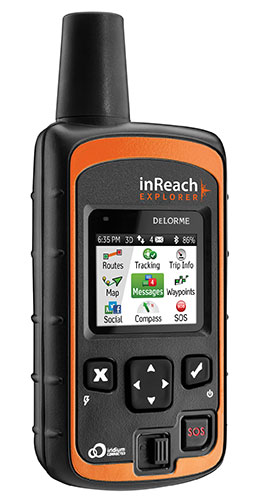
The DeLorme inReach Explorer.
In an emergency such as All experienced, the interactive SOS capability of the inReach automatically triggers remote tracking and allows users to communicate via text with responders at GEOS, DeLorme’s partner for international 24/7 search-and-rescue monitoring.
Going Out Again. All and his ACSP team departed for Huascaran National Park in Peru on June 23, just a month after his harrowing rescue in the Himalayas, for a two-month research expedition. All and several of his team members will be carrying the inReach devices.
Just like in the Himalayas, the inReach will give the team the ability to send and receive 160-character text messages from the remotest locations, provide location updates with GPS tracking, and keep them within reach of rescue with its SOS capabilities.
Besides providing peace of mind, the latest version of the inReach — the Explorer — allows the team to plan a route, mark waypoints, and create detailed track logs of their expedition.
“Knowing we would consistently be out of cell-phone range, we researched all satellite communication options to keep us connected,” All said. “A satellite phone was more than we really needed, and as a volunteer-driven non-profit program, it wasn’t very cost effective. We needed to be able to communicate back and forth in the event of an emergency, but we also wanted to keep everyone updated on the day-to-day status of the mission.”
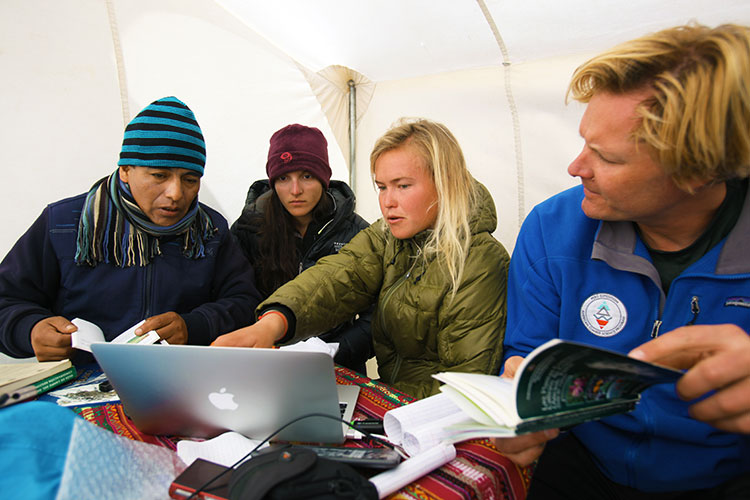
Checking on the team’s status is as easy as visiting their Facebook page. Team members regularly post messages from anywhere in the world they might travel.
In Peru, the team of 20 students and scientists will examine changing climate conditions and the impact of human land use in the mountainous Cordillera Blanca region of the Andes, where Huascaran National Park is located. The park, a magnet for American climbers, has more than 33 peaks higher than 6,000 meters and hundreds of 5,000+ meter peaks. ACSP has been sampling snow in the region for the past three years in an effort to quantify the glacial contamination levels.
“Our work in Peru will be much more comprehensive than our high-elevation work in the Himalayas and will cover whole gamut of environmental parameters, from vegetation to water quality. The region is very remote and we will be collecting some samples from the walls of a crevasse to assess the seasonality of pollutants and their impact over time, so having an inReach with us is critical — both to communicate with each other and our team back home,” All said. Plus, he added, the students on his team will be able to communicate with their parents, providing their parents with peace of mind as their children travel to remote regions.
“Now that we’ve seen how well inReach works, we are looking forward to having more of them on this next trip — especially the newest Explorer model, which will allow us to mark waypoints during data collection,” All said.
In addition to the messaging, tracking and SOS capabilities, users of the company’s latest product inReach Explorer can view, create or navigate routes and waypoints. A map view displays routes, waypoints, tracks, and messages geo-located onscreen for backtracking or self-rescue. The built-in digital compass, barometric altimeter, and accelerometer sensors ensure accuracy and provide heading and bearing information, elevation readings, speed, and other useful trip statistics.
inReach communicates over the Iridium satellite network, providing global two-way satellite connections, high network reliability and low-latency data links (less than 60-second delivery of messages end-to-end) anywhere on Earth, with no gaps, fringe or weak signal areas. inReach has the ability to maintain a satellite signal lock even in difficult GPS environments, such as in a steep canyon or under a heavy forest canopy, DeLorme said.
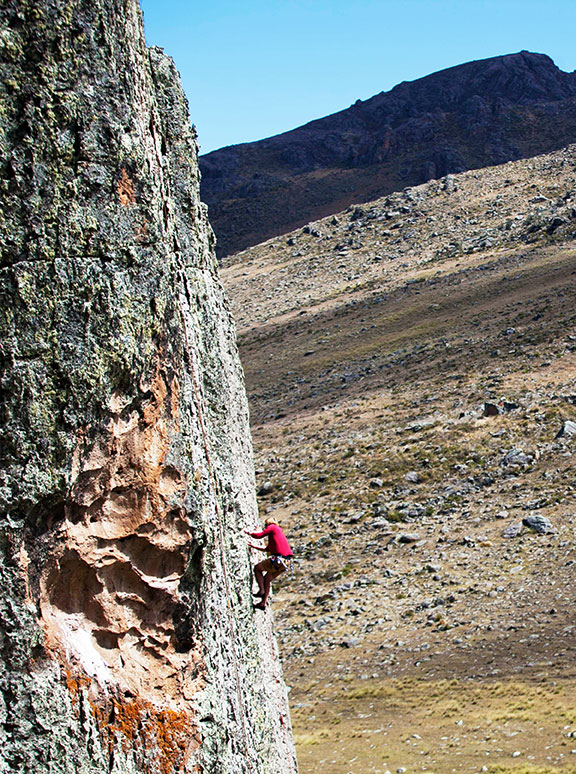
The ACSP has visited Peru for climate research for three years, including in 2013 the Quillcayhuanca Valley (left) and the Ishinca Valley, places so remote that staying in touch can be a challenge. (Photos: Clinton Lewis/WKU)
The U.S. Patent and Trademark Office has issued 10 U.S. patents to TeleCommunication Systems, Inc. during the second quarter of 2014. TCS also received two foreign patents during the quarter.
The 10 U.S. patents describe innovations in messaging, location-based services, GIS/mapping and wireless. They include the following three:
TCS reported in the first quarter that it was issued a Prepaid Short Messaging Services patent. In the second quarter, TCS received notice that another prepaid patent was issued to the company that will serve as one of the cornerstone patents in a monetization program that TCS is planning to launch later this year. The prepaid market has grown into a multibillion-dollar per year industry, with 86 million prepaid users comprising 27 percent of all U.S. wireless users, according to a J.P. Morgan 2013 market report. The recently issued Prepaid Short Messaging patent (U.S. 8,738,496) is a continuation of earlier TCS prepaid patents, bringing TCS’ prepaid messaging portfolio to eight, with one additional pending. Most prepaid phone systems allow users a prescribed amount of prepaid messaging and wireless call time. The ‘496 patent describes techniques for determining if a recipient’s account is sufficiently funded to receive a message. If it is not, the system prevents the delivery of messages until the recipient’s account is sufficiently funded, when follow-on messages will be delivered.
A geofence defines a virtual spatial boundary for creating triggers when a mobile device either enters or exits that boundary. Geofences are commonly used in child location services to alert parents when a child’s mobile device leaves the boundary of a school or park, or by enterprises to track the location of a mobile workforce or equipment. Establishing a geofence can be complicated, requiring that the user manually draw the boundary on an electronic map. The recently issued TCS patent covering a Method and System for Identifying and Defining Geofences (U.S. 8,731,813) describes techniques to simply and easily create geofences based on real-world objects or places. Using the map/navigation application on a mobile device, the user simply selects the desired location, using its pre-defined boundary to create the geofence.
Thousands of portable computing platforms have emerged that have the capability of directly connecting to the Internet either through a wireless wide area network (such as cellular network or campus Wi-Fi network) via a front-end built into the device (smartphone, etc.), or, via Bluetooth or other short-range wireless communication, to a wireless proxy device such as a modem or a smartphone. With various low-cost, short-range wireless devices installed in vehicles for navigation or entertainment purposes, it has become increasingly important to provide an easy and efficient method for a motor vehicle manufacturer, parent or other authority to monitor and control access to certain sites when those devices are connected to the Internet. The recently issued Remotely Provisioned Wireless Proxy patent (U.S. 8,712,408) describes techniques to create white lists (allowed URLs) and black lists (disallowed URLs) within a wireless/mobile device acting as a proxy so that access to certain sites can be controlled effectively.
The remaining seven U.S. patents issued in the period are: Integrated, Detachable Ear Bud Device for a Wireless Phone (U.S. 8,688,174); N-Dimensional Affinity Confluencer (U.S. 8,688,087); Login Security with Short Message (U.S. 8,712,453); Intelligent Reverse Geocoding (U.S. 8,731,585); Secure Location Session Manager (U.S. 8,687,511); System and Method for Location Assurance of a Mobile Device (U.S. 8,718,673); and Wireless Network Tour Guide (U.S. 8,744,491).
Spatial Wave, Inc., has announced that its latest releases, Mapplet, Field Mapplet, and MapLibrary are now compatible with Esri’s latest version of ArcGIS 10.2. New customers and existing customers on maintenance will receive the new release.
Mapplet is an advanced GIS viewer for viewing utility operational data that has unique capabilities to link to external data sources. Mapplet uses the latest ArcGIS technology for setup and configuration purposes and takes advantage of Arcgis.com base maps to enrich the experience of the users that are using map services from ArcGIS.com platform.
Field Mapplet is an advanced mapping and GIS-enabled framework designed to optimize utility workflows with an easy-to-use and implement solution. Field Mapplet takes advantage of ArcGIS Version 10.2 and includes a map-centric user interface. These new enhancements help bring together field and office workers, which in turn streamlines the daily workflow processes between crews, supervisors, and management.
MapLibrary is being further enhanced with support for displaying map services from ArcGIS Server 10.2 or ArcGIS.com platform depending on the choice of users.
Through the use of many powerful components, Mapplet, Field Mapplet and MapLibrary are designed for both utilities and local government agencies interested in developing GIS portals and maintaining geographic assets without additional programming.
The Army Corps’ GIS Cadre working at the Corps’ Recovery Field Office in Joplin, Missouri, after a multiple-vortex tornado struck Joplin on May 22, 2011. (Credit: U.S. Army Corps of Engineers)
When rescue and recovery crews make their way through communities devastated by hurricanes, tornados and wildfires, they need maps to help them to get around safely. One of the most relied on sources of these maps has been the U.S. Army Corps of Engineers, Geographic Information System (GIS) Cadre.
The cadre has successfully created maps to assist many federally declared disasters since 2002, including Hurricane Katrina and most recently Super Storm Sandy.
The Corps already had Planning Response Teams for disaster rescue and recovery, including teams to perform temporary housing, power, water and ice missions, and decided a GIS cadre would also be useful. The GIS cadre is made up of Corps employees from throughout the nation who are GIS subject-matter experts.
Wildfire Damage Maps. (Credit: U.S. Army Corps of Engineers)
When a federally declared disaster occurs, the team gets ready to deploy and can be on the ground in just hours, setting up their own equipment even before other agencies are on the scene. At the disaster location, they provide their GIS expertise in support for USACE Emergency Support Teams and for the Federal Emergency Management Agency (FEMA) and other state, federal and volunteer agencies.
Stephen McDevitt was one of the national action officers responsible for deploying and managing GIS teams during nationally declared disasters. “The GIS takes data from various sources, including aerial photographs and electronic data, and combines these layers of information in various ways to create maps. These maps can be used to perform many different missions and solve complex problems.”
“FEMA has called us for every major disaster since the team started in 2002,” McDevitt said. These missions have included ice storms, hurricanes, typhoons, tornados, floods, wild fire disasters and could also include manmade terrorist events if needed.
For these missions, a wide variety of maps have been created to help agencies to make important decisions to support relief and recovery efforts after a disaster strikes. Following are a few of these maps:
Rescue & Recovery: The cadre creates maps using geospatial information on where hurricane victims are located so that search and rescue workers can locate and recover stranded individuals.
Building Temporary Homes & Critical Facilities: Temporary housing and critical public facilities can’t be constructed on flood-prone land. The cadre creates maps that show agencies where there are flood zones. In addition, they create maps that show where there is safe land to place housing and facilities away from the devastation and near water, sewer and electric lines and services, such as schools and hospitals.
Debris Removal: The cadre creates maps that show field workers the location of debris, as well as clear land to use as staging areas for debris removal equipment. Maps can also show field workers the optimal routes for removing and transporting debris. This is needed when street signs have been blown away and many structures destroyed.
Pumping Water: The cadre creates maps that show agencies how long it will take for flood waters to subside, using different rates of pumping. The cadre can also take data on the locations and functionality of pump stations to create maps that help agencies figure out how long it will take to pump water out of a region.
Identifying Impacted Communities: The cadre can create maps that show the locations of damaged homes and businesses. These maps show agencies like FEMA where displaced citizens requiring assistance may be located and where recovery centers should be stationed. The cadre can also create demographic maps so that agencies know where economically challenged individuals may live who do not have transportation to reach the nearest recovery center. In these cases, a mobile center can be sent to these areas.
Preventing Future Safety & Environmental Problems: The cadre creates maps that can help communities prevent future dangers. For example, in the aftermath of the Southern California wildfires in 2008, the cadre created soil burn severity maps. These maps show where the fires burned the valley the most and where there is soil erosion. These large pieces of hardened soil can cause mud slides during the rainy season, creating dangerous landslides. These maps also show agencies where people should be evacuated.
Stephen McDevitt, former action officer for the U.S. Army Corps of Engineers GIS Cadre and former coordinator for the Enterprise GIS for the Army Corps’ New York District. (Credit: Dan Desmet, Public Affairs, USACE, New York District)
The Army Corps’ GIS Cadre is unique from other national GIS teams because these individuals are not only GIS specialists, but are also from other disciplines with the Army Corps. These professions include geographers, cartographers, physical scientists, civil engineers, park rangers, environmental scientists and others.
“Because of this, they bring a lot to the table,” McDevitt said. “We have engineers and hydrologists who use GIS to support district projects. These additional skills are very valuable when it comes to disaster situations. For example, if flood zones need to be identified before temporary housing can be set up; those with both GIS and water resources skills are especially useful for working with this data.”
He added, “If there wasn’t a GIS Cadre, FEMA would be constantly contacting the Army Corps for information needed during a disaster, pulling Army Corps personnel away from other important projects. By having this specialized GIS team, the team can focus their time and energy to the mission on hand. This is more efficient and makes better use of taxpayer money.”
McDevitt, a former action officer for the cadre and former coordinator for the Enterprise GIS for the Corps’ New York District, has been active with the cadre since it was created 11 years ago. Now as he nears his retirement he says he hopes the cadre, that is unique from other GIS teams, will continue well into the future. “I am proud to have had the opportunity to serve with the GIS Cadre since its creation. After 30 years of service with the federal government, I can honestly say it has been one of the most rewarding experiences,” said McDevitt.
McDevitt said that the cadre’s future is bright and he hopes it will continue strong for another decade or more. He says what will contribute to its success are team members who have GIS skills. These skills can come from having experience working with remote sensing, computer-aided design (CAD) and other geospatial data and systems technology.
There is also an increased need for individuals with advanced computer skills because many of the new mapping applications are web-based. This includes knowledge of HTML 5, Java and Silver Light as well as good database skills, such as working with Oracle, because the team works with large data sets.
“The Army Corps’ GIS Cadre stands ready to serve the nation, whenever and wherever there is a need for dedicated GIS subject-matter experts,” McDevitt said.
McDevitt (Far right) when he was an action officer with members of his GIS Cadre team. (Credit: U.S. Army Corps of Engineers)
Getmapping has posted strong growth for the 2013 financial year. The recently released financial results showed Getmapping post record turnover and profits on the back of strong growth in both the United Kingdom and African markets.
Getmapping is a public limited company, and terms itself the UK’s leading supplier of aerial photography, mapping products and data hosting solutions.
Group turnover was up 34% overall from £3.5m in 2012 to £4.7m in 2013, with the contribution from African operations up 86% on the previous year. Getmapping’s strong performance has also been reflected in its share price which has tripled in the last three years as interest in the company from investors grows, the company said.
Getmapping has been working hard to extend both the range of products and services that it can offer as well as its global reach. In 2013, for example, Getmapping established a new LiDAR division in Centurion, South Africa, which has enabled it to extend its range of services and provide them across a wider geographical area.
While the UK remains a challenging market, Getmapping continues to work hard to retain its strong position. As an example, Getmapping, together with Bluesky, was recently awarded a multi-million pound contract for the supply of geographic data to Central Government organizations. The contract, awarded by the Department for Environment, Food and Rural Affairs (DEFRA), covers high resolution aerial photography, detailed 3D height models and colour infrared imagery for the whole of England, Wales and Scotland. Under the new Aerial Photography for Great Britain (APGB) contract, Getmapping and Bluesky can also provide training, consultancy and workshops to contract members.
“Getmapping delivered strong growth in 2013 across all of our core business streams. The company has invested heavily in new sensor and processing technology and the investment is already delivering strong results which we expect to carry through 2014 and beyond,” said Dave Horner, managing director of Getmapping. “The recent DEFRA contract and winning the aerial photography contract for the Scottish government in 2013 has reinforced our position as the leading supplier of aerial photography services in the UK. The financial results are an endorsement of our strategy, but we won’t be resting on our laurels and aim to continue to improve our performance in 2014 and beyond.”
Trimble has announced that Mesa County in Colorado has received a Certificate of Authorization (COA) that will allow the Public Works Department to operate its Trimble UX5 Aerial Imaging Solution throughout the county. A COA is an authorization from the Federal Aviation Administration (FAA) allowing the operation of an unmanned aircraft in a designated area and not for commercial use.
The authorization is currently required to legally operate a public unmanned aircraft in the U.S. The COA was granted to the Mesa County Sheriff’s Office, who manages the county’s unmanned aircraft system (UAS) operations and has been flying systems since 2008.
Mesa County’s Public Works chose the Trimble UX5 for a variety of applications including determining volumes and compaction of its county landfill, surveying and monitoring capital improvement projects such as roads and bridges, as well as assist the Mesa County Sheriff’s Office or other county departments, as needed. “With the Trimble UX5, Mesa County is one of the first to benefit from a cutting-edge solution that can change how surveyor’s collect data,” said Frank Kochevar, GPS/Survey Supervisor for Mesa County Public Works. The Trimble UX5 was used by Mesa County Public Works to gather aerial images of the landslide that occurred in Western Colorado in May of this year.
“Trimble’s goal is to allow geospatial professionals to quickly and efficiently capture and convert existing field conditions into actionable information for their customers. We are pleased that Mesa County will now be able to apply the Trimble UX5 Aerial Imaging Solution to meet their public works department needs,” said Phil Sawarynski, business area director for Trimble’s Geospatial Imaging solutions.
Mesa County has received multiple COAs since 2008 from the FAA for public safety purposes. This is the first COA issued to the Mesa County Sheriff’s Office that will be used specifically for aerial mapping on surveying and engineering projects, in partnership with the Public Works Department. According to Ben Miller, UAS Program Director for the Mesa County Sherriff’s Office and coordinator for all their COA’s, “In collaboration with Trimble, Mesa County, Colorado continues to demonstrate that small unmanned aircraft are not just a tool to save lives, but a community asset that can help save its citizens tens of thousands of tax payer dollars.”
The Trimble UX5 is an unmanned fixed-wing aircraft targeted at the surveying, oil & gas, mining, environmental and agriculture industries. The system autonomously captures a series of high-resolution images during flight, which is typically up to 50 minutes covering as much as 2.3 square kilometers (approximately 1 square mile) when flying 120 meters (approximately 400 feet) above the ground. Using Trimble Business Center Office software, images are used to easily generate 2D and 3D deliverables such as orthomosaic images, three-dimensional point clouds and contour maps. The Trimble UX5 enables the collection of large amounts of data, often faster than traditional surveying technologies.
If you’d like to experience an industry first, I think, I’ll be participating in a live webinar being held during the Esri conference at the San Diego Convention Center on Thursday, July 17, at 10:00 a.m. U.S. Pacific time. I’ll have some planned guests, and perhaps drop-in guests, discussing the complexities of integrating mobile devices with disparate operating systems (Android, iOS, Windows, Windows Mobile, Windows Phone) into your GIS workflow. If you’re at the conference and would like to see us in action, stop by the podcast booth near Room 27 of the convention center. If you’d like to tune in live via the Internet, please sign up by clicking here.
This week is the mecca of GIS, at least in the U.S.; the Esri International User Conference (UC) in San Diego, California, and I’m swimming in GIS up to my ears.
There’s always a myriad of Esri-centric meetings and events during the weekend prior to the UC, and this year was no exception. During the weekend prior, I attended the AEC Summit, formerly named the Survey Summit. The AEC Summit bills itself as the “Forum for High-Accuracy” GIS.
The dominant technology discussed at the AEC Summit was UAS (aka UAVs, Drones). There was lots of discussion about the forthcoming Federal Aviation Administration rules (due September 30, 2015) and “potential” UAS applications. However, one presentation gave the audience a practical look at the value of a UAS. Burns & McDonnell, in association with the University of Connecticut, reported their company worked nine months to gain approval (Certificate of Authorization) from the Federal Aviation Administration (FAA) to conduct a transmission line inspection using a rotary-wing aircraft.
Steven Santovasi, GISP at Burns & McDonnell, gave a summary presentation of their experience with UAS technology. He started with this slide that frames the UAS device market, divided into three device segments: fixed-wing, rotary craft, and a hybrid version with the hover features of a rotary UAS but the speed and stability performance of a fixed-wing UAS.
Types of UAS used for Mapping
Santovasi reported that using the rotary UAS allowed his company to perform an inspection that he thought couldn’t be performed by a manned aircraft. He said that the UAS was able to get within five feet of the structure and take detailed, high-resolution photos. In fact, he said his team was able to identify a failing bolt that may have caused a significant power outage. He reported that a representative of the transmission line owner said that the discovery of the failing bolt “paid for the project.” The transmission line is strung on a 250-foot-tall tower.
Following is a photo of the bolt (and accompanying structure) taken by the rotary craft UAS. There’s actually a much higher-resolution an close-up photo of the bolt I’ll try to obtain and update in this article.
Failing Bolt Identified by High-Resolution Photo Captured from a UAS at Close Range
There was some discussion in the audience that the FAA may not make the September 30, 2015, deadline, or that it will issue a partial set of rules. Last month, a Washington Post article reported the same. If that happens, it’s going to be really interesting. It seems like with each day that goes by, the heat gets turned up a little more for the FAA to act. More frequently, perhaps fueled by the FAA vs. Pirker case where the FAA was slapped by a NTSB judge for not having enforceable rules to punish “violators,” there are media reports that individuals and companies are using UASs for commercial purposes regardless of the FAA’s position. For example,
However, the FAA is not giving up in its attempt to assert its rules despite the ruling by the NTSB judge. On June 23, the FAA issued a press release offering “guidance to Model Aircraft Operators” in an attempt to squelch commercial UAS operators from believing they can fly under modeler rules.
User Conference Plenary
Every year, I look forward to Esri President Jack Dangermond’s keynote at the plenary. I love that Esri is still a privately held corporation, having only to answer to themselves. They don’t have to worry about Wall Street quarterly reports as publicly-traded companies do, so they can choose to change strategy or take on projects that may not appeal to public shareholders. Given that, you really never know what Mr. Dangermond might decide to do, or say, so it’s always interesting to listen to his thoughts on Monday morning.
Of course, there were tons of ideas shared, some new products introduced, and some impressive fourth-graders speaking to a crowd the size that 99.5% of us will never have the opportunity to address. But, after listening to the plenary, watching Twitter, reading blogs and news releases, etc., I can boil it down to one word where this technology is headed…real-time (or is that two words hyphenated? :-) ). I want current information, and I want information as events occur. That is the definition of real-time. I was struck by the City of Rancho Cucamonga’s presentation, which won Esri’s President’s Award. The city has deployed a GIS that allows it to “see” events as they happen, whether it be a traffic accident, fire or other public emergency. Of course, you can easily extrapolate that to include public works nuisances like potholes, traffic signal outages, and street closures, then further extrapolate to society where you have something like Waze, a mobile phone app that allows millions of drivers to share real-time information about traffic conditions.
City of Rancho Cucamonga Executive Dashboard for Monitoring Municipal Gov’t Activity
In geographic regions where there is solid wireless connectivity, there’s no reason we can’t or shouldn’t have access to real-time information on a broad scale, in a very accessible manner. And of course, geographic location is a super-important part of that real-time information. Accurate, real-time information allows us to make accurate, real-time decisions.
The real-time theme bubbles and oozes from GIS, and GIS is begging to be a real-time technology. This is largely driven by mobile devices and sensors. It’s not like the real-time “transaction,” as Mr. Dangermond has coined in past Esri UC conferences, is a new concept. That concept hasn’t changed. What has changed is the proliferation of mobile devices and sensors that enable us to carry the power of GIS in our pockets. They are the technology enablers of real-time GIS, and the trend is crystal clear. It is what people want, and they will get it because GIS, mobile devices and sensor technologies are converging, and to a price point that is very affordable. This year, Mr. Dangermond mentioned the Internet of Things during the general plenary. This is exactly what I’m referring to. Devices and sensors will each have an IP address, or some method of making themselves known on a network. Some people call this Big Data. Regardless, we’re seeing this transformation beginning.
I saw a great example of the transition from labor-intensive transactions to real-time transactions at a Esri UC presentation this week. It’s a utility company that was using a data check-in/check-out workflow to collect high-precision GPS data for its infrastructure (e.g., valves, meters, etc.). The company was spending a significant amount of time dealing with the data check-in/check-out procedure and data post-processing. Some downsides of the data check-in/check-out workflow listed were:
many opportunities for human or technical error
clunky and arduous QA/QC process
slow and expensive workflow that is difficult to scale
software maintenance cost and overhead
In the past six months, the company transitioned to a real-time data collection process that posts high-precision GPS transactions in real-time within SDE in ArcMap. Some of the benefits listed were:
GPS points update in real-time within SDE
laterals and fittings draw and populate automatically
support for a wider variety of software data collection tools like ArcGIS Mobile, ArcPad (either SDE or ArcGIS Online) or Collector
simple design for tablet use (either online or offline)
software cost reduction (unlimited seats of ArcGIS Mobile w/Server, Collector free through ArcGIS Online)
Perhaps the words that best describe the company’s transition to a real-time GIS transaction workflow were contained in the summary page of the presentation.
Time: Our Most Precious Resource
‘ Nuf said.
Plenary Opening Keynote by Mr. Dangermond
If you want to take a look Mr. Dangermond’s opening keynote, including the presentation by the City of Rancho Cucamonga, following is a 22-minute video that’s worth a look.
Esri has released Explorer for ArcGIS on the Mac, a native OS X application to discover, view, and share maps. The ready-to-use app joins Esri’s family of mapping apps, including Collector for ArcGIS, Dashboard for ArcGIS, and Explorer for ArcGIS on iOS. It can be downloaded from the Mac App Store and Esri ArcGIS Marketplace.
Explorer for ArcGIS running on OSX
According to the announcement, with Explorer for ArcGIS, users can access maps, search for and visualize data, and brief stakeholders. In the new Mac version, users also have the ability to open and view multiple maps at once, dock and undock pop-up windows, and go full screen — taking advantage of Apple’s Retina technology on MacBook and Thunderbolt displays.
Esri reports that Explorer for ArcGIS is one of many ready-to-use apps to access maps authored by users or others within their organizations, and share them from Macs or iOS devices. The app is designed for anyone who needs to explore data in a geographic context and use maps to make more informed decisions. With an elegant and intuitive interface, it requires no GIS experience to operate.
Anyone using a Mac desktop or iOS device can download and try the sample maps included in the app. ArcGIS Online subscribers, trial users, and those with a Portal for ArcGIS account can simply download the app, sign in, and begin exploring their maps and data. An Android version of the Explorer for ArcGIS app will be available in a later release.
Two weeks ago, GEOHuntsville held a mini conference for emergency responders hosted by Chris Johnson of A Visual Edge, Inc., Joe Francica of Directions Magazine, and AEgis Technologies. The conference covered work being done under “The Blueprint for Safety” (BfS), a pilot effort of GEO Huntsville to support local public safety agencies with geospatial technology in the event of area emergencies.
The goal of the pilot is to integrate existing and emerging geospatial technologies to improve multi-jurisdictional rapid response. One part of the system being used is a new on-demand, online, self-service toolset created by the National Geospatial-Intelligence Agency’s (NGA) Integrated Working Group – Readiness, Response, and Recovery (IWG-R3). The pilot will also employ crowdsourcing, gamification, and RFID management while assembling all information in an Event Page to enhance information gathering and sharing during critical events.
RPScan
One emerging technology that I found especially interesting at the conference was from Robotic Paradigm Systems, LLC of Huntsville, Alabama. It is in the business of creating rapid facility layouts using a laser scanning system. I get excited when I see technology that addresses a need using an elegant approach that is simple, effective, and low cost while also having a “light footprint.” RPScan seems to be such a technology.
As you know, many laser scanning systems do a superb job building interior and exterior 3D models. Some systems produce such high-resolution 3D models that they look almost photorealistic, showing every minute detail. Those systems, by necessity, are also somewhat cumbersome and intrusive for the customer. The resultant models are also large and can be difficult to manage.
Robotic Paradigm Systems took a more pragmaticm user-oriented approach. The team there realized that many users, especially emergency responders, don’t need extremely detailed 3D models that are only available for a few facilities. What they need are “good enough” 2D models of as many facilities as possible, as soon as possible.
RPScan Operation
That has been the driving force behind RPScan. RPScan is a very light, wearable backpack with an elevated sensor that “sees” above most furniture and even people in a room. Many current 3D scanning systems require stationary equipment firmly mounted on a stand in the center of a room. By comparison, RPScan captures data as the operator simply walks through the rooms in a building. The continuous data capture is displayed on a wrist-mounted display, so verification of complete data capture is available to the operator real time. RPScan quickly maps indoor spaces, providing data that is then used to create accurate dimensional floor plans.
Here the operator walks briskly through a church capturing 2D floor plan data.The wrist-mounted screen shows the captured data as collected, thus providing continuous quality control.
RPScan is a lightweight and mobile system that can rapidly create accurate dimensional layouts of large complex facilities. It captures spatial data of occupied buildings at an approximate rate of 75,000 square feet per hour, with roughly two hours more needed to convert the raw data to CAD floor plans depending on conditions and desired CAD details. The hardware ergonomic design is also very comfortable and unobtrusive. Watch this RPScan video of a capture session to see it in operation.
Traditional 3D scanning systems typically use stationary hardware suites that are set up in a room. Frequently the operator has to work during off hours or ask occupants to leave the room during scanning. This stationary method of scanning is relatively easy since all measurements are captured from a fixed point and reference angle. By comparison, a mobile system, like RPScan, is more complicated because the location, position and attitude, are continuously changing during the capture process. To operate under these conditions, the system has to capture data while also accurately tracking and compensating for the equipment/operator movement. This is a proprietary feature of RPScan and the key to its efficient data-capture capability.
Since RPScan is capturing a horizontal “slice” of data, adjusting the height of the scanner provides several advantages. Fixing the scanner height above the heads of occupants, data capture can be done without the need to evacuate rooms. Building occupants can go about their business with minimal interruption. This is especially important in facilities like hospitals that cannot easily stop operations or move occupants. The operator can quickly and unobtrusively move from room to room with only minimal disruption. Conversely, lowering the scanner height permits the capture of cubical walls or fixed furnishings such as benches and pews. Furniture can remain in rooms because it’s not necessary to view all walls in their entirety. During post-processing, continuous walls are obvious in the laser images so conversion to architecture CAD models is fairly easy.
Real-Time Display
A unique feature of RPScan is that the 2D layout is continuously displayed on a touchscreen attached to the operator’s arm. As the operator walks through the interior space, continuous data capture is displayed as the layout image is being assembled. This real-time rendered display is more than just a convenience. It is the key to complete data capture and quality control. During the scanning process, it’s important to see areas that haven’t been scanned or areas that may need to be scanned more thoroughly. Since scanning efforts typically involve onsite data collection followed by off-site post processing, seeing results immediately builds confidence that the visit to the facility has been thoroughly and properly detailed. This minimizes the possibility of a return trip to recapture an area that may have been missed or poorly scanned.
Another valuable feature of RPScan is that it can simultaneously record linked audio and video during the entire capture process. This linking of audio, video, and location is a powerful capability and could be used to enhance first responder pre-plans by permitting virtual walkthroughs.
Uses of 2D Data
The high cost of 3D scanning systems and software can become a barrier for use in many applications. Some users cannot justify the complexity and cost of high-end 3D data capture and modeling when a 2D model would suffice. Some examples where 2D data has proved effective include:
There have been significant advancements in GPS, IMUs, RFIDs, and other micro-technologies embedded in mobile devices, but much of this new capability also needs a “base map” to register the tracked locations. Thanks to overhead and ground-level imagery assembled by national agencies, Google, and Microsoft, we have very rich data sets of our exterior world. However, to fully exploit indoor tracking technology, we will need equally robust building interior maps. Until we have BIM models of all buildings, I believe that 2D mapping will fill that void faster than other options. Robotic Paradigm Systems, with its RPScan system, seems well positioned to lead the indoor mapping effort.
P.S. I’m always looking for new technology to share with my readers, but my view is limited. If you know of new technology that others might find interesting, please drop a note in the comments section so I can investigate and possibly provide some visibility for the technology.