By Chaminda Basnayake, Tom Williams, Paul Alves, and Gérard Lachapelle
Communication-enabled vehicle safety has the potential to change transportation’s future, particularly vehicle-to-vehicle (V2V) and vehicle-to-infrastructure (V2I), collectively represented as V2X. An automakers’ consortium conducted extensive field trials to determine GNSS service availability and accuracy for the V2X challenge.
V2X can include applications based on communications between any two or more entities on the road. Of all the potential V2X applications, V2V applications probably lead the way in terms of maturity of prototype development and test efforts. General Motors (GM) demonstrated the first working prototype V2V system in 2005. Information on further industry collaborative efforts in V2V system developments can be found at the U.S. Department of Transportation’s (DOT’s) IntelliDrive website. While a multitude of applications could be developed based on V2I capability, most of the related system prototype development efforts have taken place under the DOT’s Cooperative Intersection Collision Avoidance (CICAS) program.

Accuracy Requirements
In terms of positioning accuracy requirements, Vehicle Safety Communications-Applications (VSC-A) prototype system capabilities as well as all V2X applications can be classified as:
Which Road. In this case, accuracy is only required to the extent of identifying the road traveled. For instance, if a vehicle is in a service road parallel to a freeway, knowing that it is on the service road and not on the freeway is sufficient. The need of a typical vehicle navigation device is another good example of this requirement category. The typical accuracy requirement for this case is better than 5 meters. However, this could be a relative accuracy requirement for certain applications. For instance, in a V2V scenario, one vehicle may only need to know if the other is on the same road or not, while in the absolute sense both vehicles could be in error by more than 5 meters. For V2I applications, however, this becomes an absolute accuracy requirement, as the infrastructure is always mapped and identified with respect to a global coordinate frame.
Which Lane. This accuracy level enables applications to identify other entities with lane level resolution. The typical requirement is 1.5 meters or better, which approximately corresponds to half of a lane width. A blind-spot advisor is a good example that requires this accuracy.
Where-in-Lane. This accuracy level enables the relative positioning of entities to better than 1 meter. Further refinements of blind-spot advisor-like applications are examples.
Availability Requirements
GNSS as a line-of-sight technology has obvious limitations in certain environments, and these limitations are well understood by the GNSS community. The focus of this study was to understand the limitations associated with a GNSS-only V2X solution such that requirements for augmentation technologies can be defined. Therefore, no availability requirements were set for the system; estimating availability of a GNSS-only solution was the goal.
Why So Complicated? At first glance, what needs to be done is straightforward; all V2X-capable entities need to be aware of each other’s positions. Hence, if all entities transmit their own location with respect to the same coordinate system, the problem is solved. Unfortunately, it’s not that simple.
Designing the system so that hundreds of entities, potentially using all sorts of GNSS software and hardware, can work together presents a significant challenge. This includes keeping backward compatibility way out into the future.
Even within the same receiver make and type, inclusion of a particular satellite in the solution of one vehicle can significantly affect the solution difference between vehicles. Inclusion of SBAS also contributes as a differentiator. In a V2X scenario, out of two adjacent vehicles, one vehicle may use SBAS while the other may not, due to hardware configuration or visibility. If none of the above situations occurred and everything else were ideal, transmitting just the current horizontal position of a V2X entity over-the-air (OTA) would be sufficient to do everything needed.
V2X thus requires a positioning system architecture that minimizes the impact of these complications and many other potential compatibility issues. Major system design considerations include:
Performance Requirements. The system must provide relative positioning accuracy that fits Which Road, Which Lane, or Where-in-Lane category and should identify the solution quality. For instance, a vehicle on a freeway with relatively open sky view may function in the Which Lane mode and may transition to Which Road mode as it enters an urban area with sky visibility limitations.
Deployment Constraints. The system must be affordable for automotive applications. This may also include considerations such as antenna placement, processing resource requirements, and power requirements.
Bandwidth Constraints. The volume of data transmission constitutes a major consideration for OTA communications. While some methods manage communication range and frequency as a way of optimally using the communication channels, keeping the OTA data volume to a minimum by design was a goal.
Study Goals
This study investigated the performance of two relative positioning methods: DPOS, a method of using the difference in position reported by two entities to calculate the 3D separation between the points; and real-time kinematic (RTK). While there are many other possible relative positioning methods, these two were selected as they collectively represent the most desirable availability and accuracy performance. In DPOS, vehicle coordinates are transmitted between vehicles in order for position differences between vehicles to be derived at each vehicle. In RTK, raw code and carrier-phase data is transmitted between vehicles, and the inter-vehicle position differences are calculated using RTK software in either fixed or float carrier-phase ambiguity mode at each vehicle. The RTK method is more intensive both from a data transmission and computational aspect, but retains only common satellites in the solution, eliminating the problem described earlier. Its use of carrier-phase measurements also makes it more accurate.
The study included two GPS receiver types. The first, a single-frequency L1 automotive-grade receiver, is identified as Type B receiver in this study. The second, identified as Type A, was of a higher quality with proprietary multipath mitigation technologies. Both receivers were capable of using WAAS support. Receiver B also allowed the user to reject selected satellites from its solution. These two devices were selected as they were capable of supporting both processing methods, and represent on the one hand an existing automotive-grade receiver, and on the other hand one that is expected to be a good representation of a product with technologies available for automotive deployment a few years from now.
Specific study goals were:
- Accuracy performance of DPOS and RTK methods when all vehicles use same GPS receiver type.
- Same when a receiver type or a receiver configuration mix is used.
- Dependency of the accuracy performance on the driving environment.
- Solution availability with same receiver and mix receiver combinations.
- Implications of non-continuous V2I coverage.
Prototype System
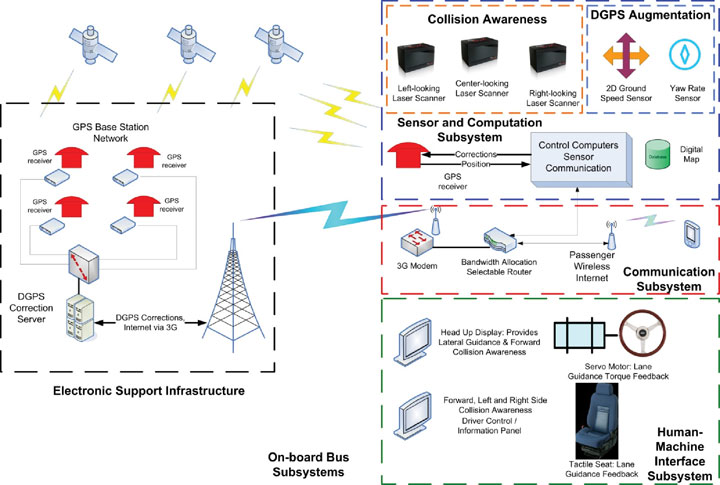
The system prototype (Figure 1) used for the study was a replica of the prototype relative positioning system implemented in the VSC-A project. It consists of a dedicated short-range communicatin (DSRC) interface with a DSRC radio, a GPS receiver/relative positioning module, and a sensor data handler.
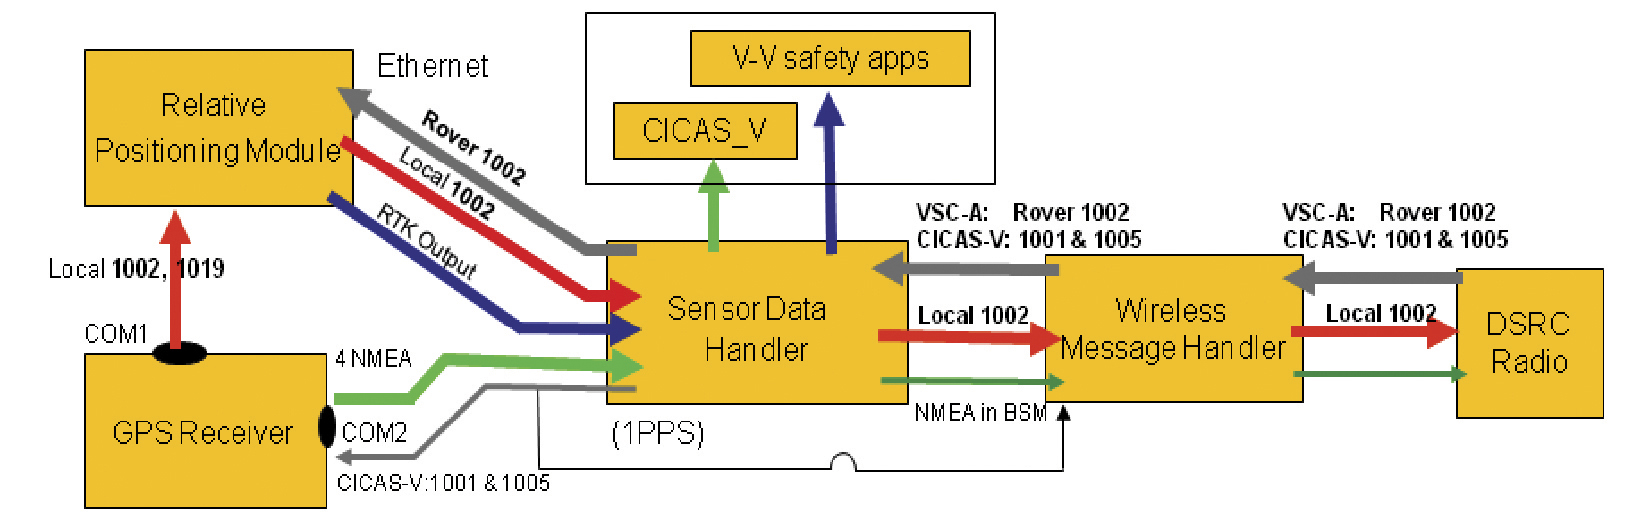
In operation, a vehicle generates its own location information and GPS raw data in RTCM format and shares this data with other vehicles. OTA messaging was done using the SAE J2735 messages set with GPS raw data in RTCM format attached as optional data. As shown in Figure 1, RTCM v3 1002 messages were used to exchange VSC-A data. The system was also capable of using RTCM v3 messages 1001 & 1005 for V2I operation. The DPOS relative positioning logic was implemented in the sensor data handler, while the RTK implementation was done in a separate relative positioning module. This module takes in local and remote 1002 messages and outputs RTK data to the sensor data handler. Applications could access both RTK and DPOS relative positioning information from the sensor data handler.
Vehicle Setup. Two vehicles were used for the V2X data collection. Four different GPS L1-only test receiver types were installed on each vehicle:
- AW: high-quality receiver using WAAS corrections.
- BW: high-sensitivity automotive-grade receiver with WAAS ranging and corrections enabled.
- BNW: high-sensitivity automotive-grade receiver with WAAS ranging and corrections disabled.
- B24W: high-sensitivity automotive-grade receiver using a maximum of the four primary satellites in each of the six planes (minimum guaranteed constellation) and with WAAS ranging and corrections enabled.
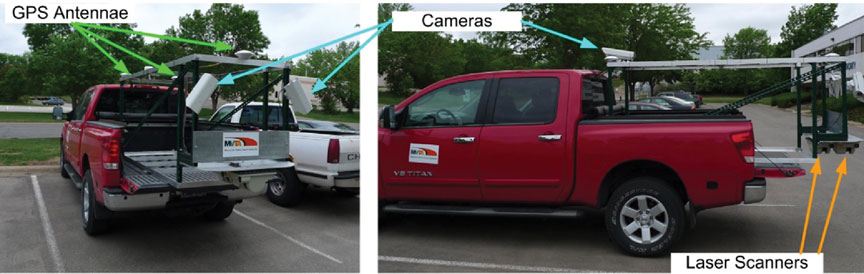
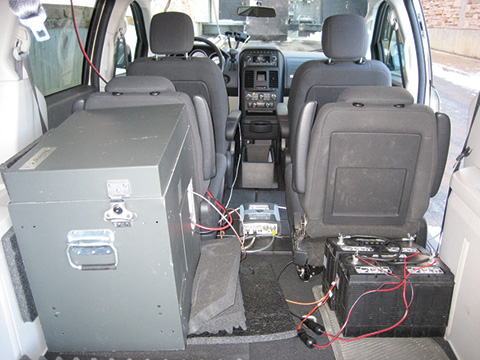
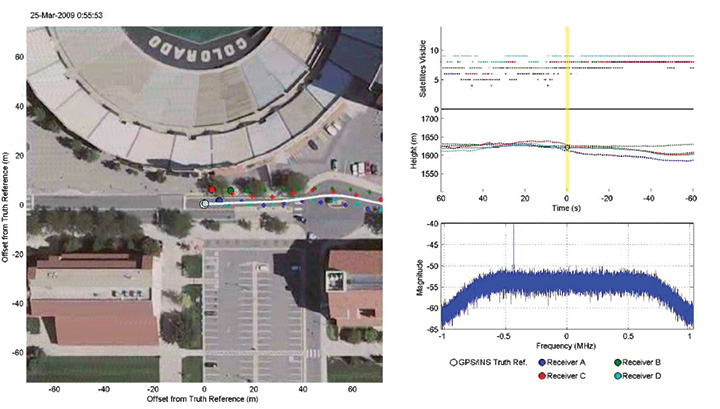
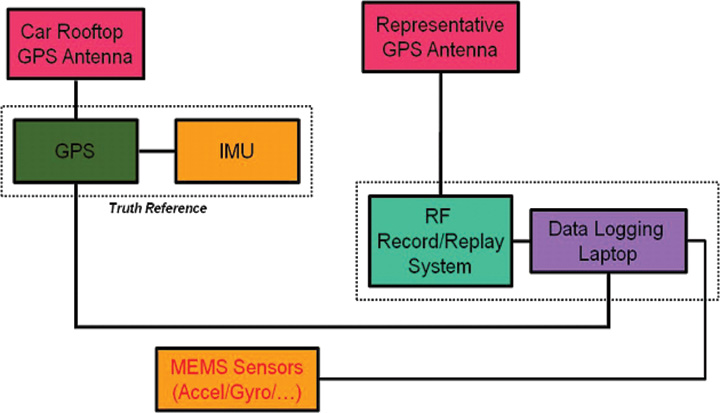
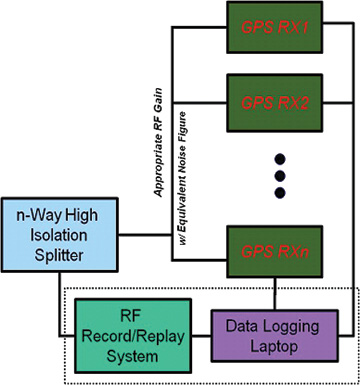
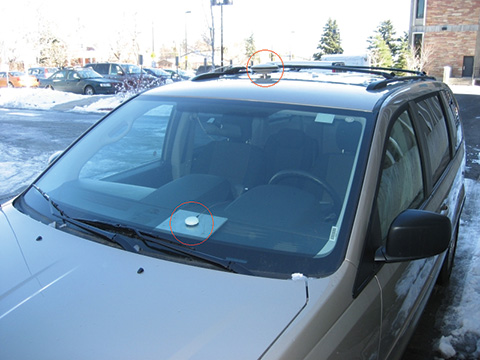
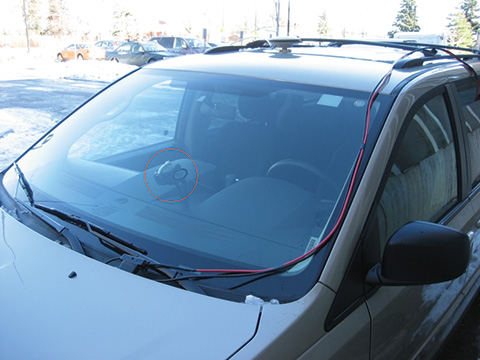
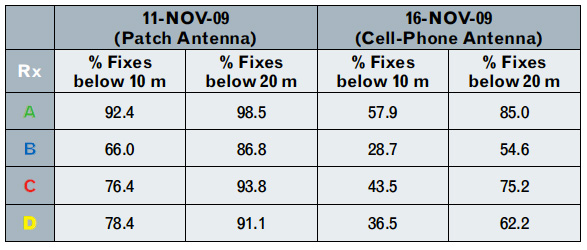
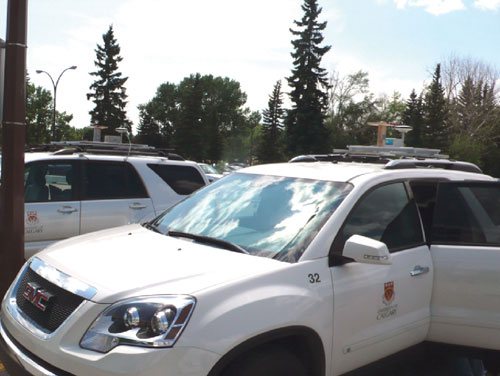
As shown in Figure 2, the AW and B type receivers were connected to different GNSS antennas. These antennas were mounted on roof-racks attached to the vehicles (see Photo). The patch antenna for the Type B receivers was mounted on an aluminum-topped wooden pedestal to bring it to approximately the same height as that used by the AW receivers, to provide a ground plane and to prevent shading from other equipment on the roof-racks. The spacing between the antennas was accounted for in all analysis.
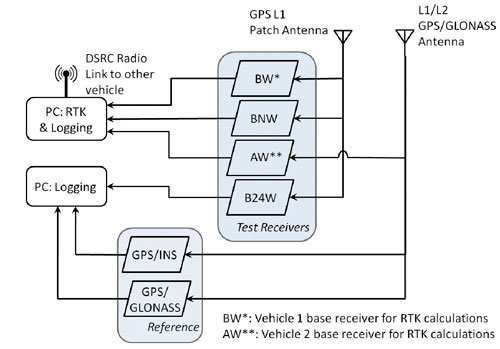
Figure 2 also shows that only three of the four test receivers, AW, BW, and BNW, were connected to the computer that ran the RTK software. This computer calculated the inter-vehicle vector (IVV) using information exchanged over the DSRC radio link in real time. The vehicles each had a designated base relative to which the IVV was calculated; for Vehicle 1 it was BW and for Vehicle 2 it was AW. Thus the computer on each vehicle calculated three instances of the IVV, for example, the computer on Vehicle 1 calculated BW1–BW2, BW1–BNW2, and BW1–AW2 (where Ri denotes the receiver of type R on vehicle i).
Transmission and reception of data between the two vehicles required for the IVV RTK calculations were achieved using wave radio modules with two magnetically mounted 802.11p antennas on each vehicle for redundancy. During testing, Vehicle 1 generally followed Vehicle 2. To minimize potential interference of roof-mounted instruments on between-vehicle communications, the antennas on Vehicle 1 were located close to the front of the roof, while those on Vehicle 2 were located close to the rear of the roof. In each case, 15 centimeters of roof space were left to provide ground planes for the antennas.
We used the single-point navigation solutions logged from each test receiver to calculate the IVV for each receiver combination using the DPOS method in post-processing. No real-time data transfer between the vehicles was used for this method.
Reference values of the IVV were calculated in post-processing using both geodetic grade GPS/GLONASS L1/L2 receivers and GPS/INS integrated systems in differential mode. Both were connected to the antenna used by the AW receiver. Differential GPS calculations were enabled by using stationary receivers with antennas at precisely known WGS84 locations on top of a building at the University of Calgary.
Test Scenarios
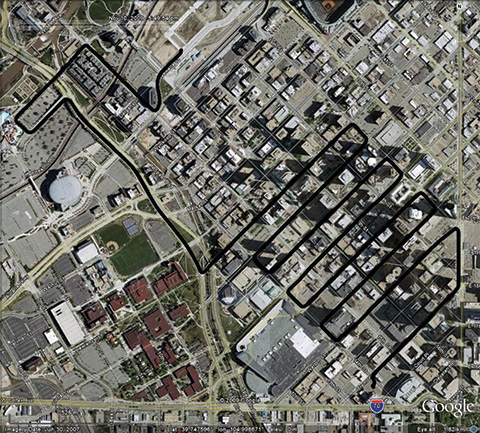
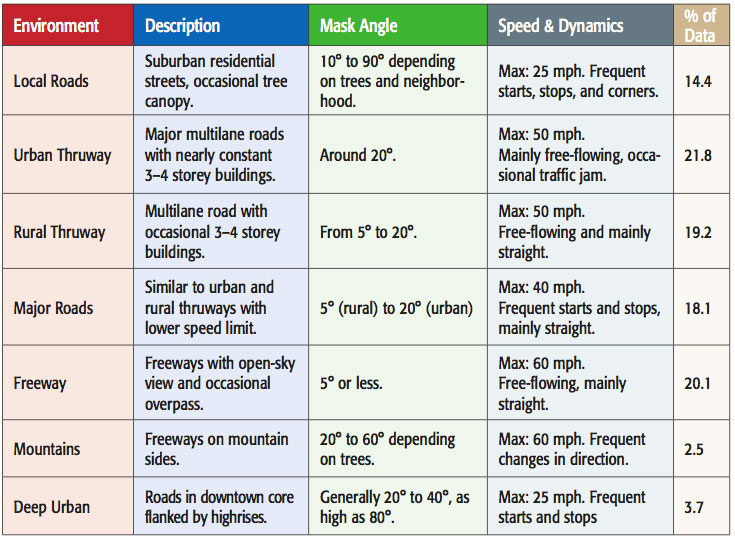
V2V data was collected in and around the city of Calgary in August 2009. In the majority of the tests, Vehicle 1 followed Vehicle 2 with a separation of less than 300 meters, the stated effective range of the DSRC link. For most tests the inter-vehicle separation was between 30 and 150 meters. Some driving environments forced modifications of the default behavior; for example, on highways, vehicles moved in between the two test vehicles, necessitating lane changes. Approximately 52 hours of data was collected over 12 days. After rejecting data due to various faults such as reference-system malfunction, more than 45 hours of data remained.
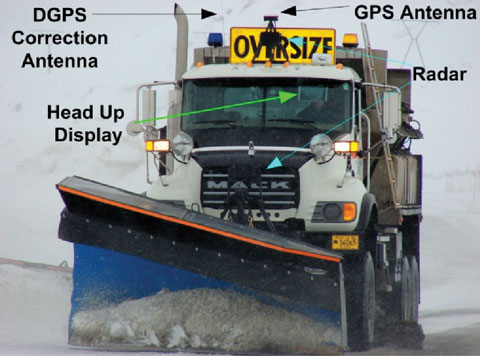
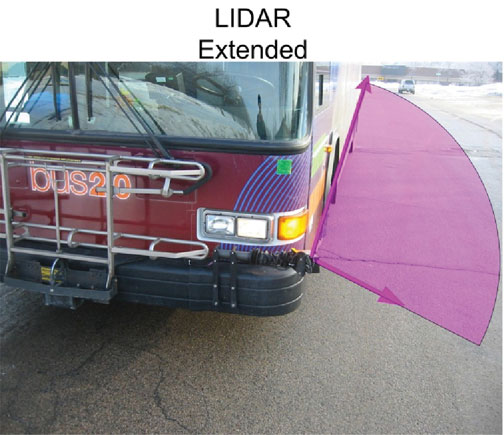
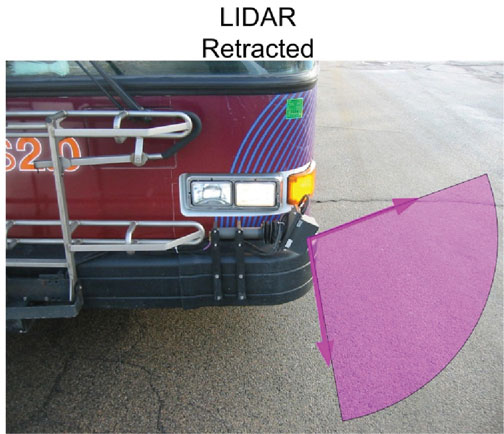
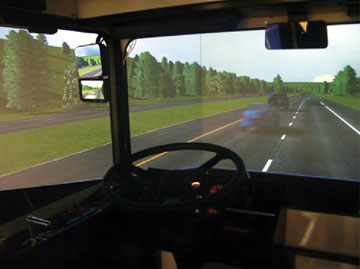
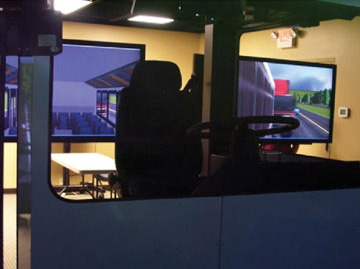
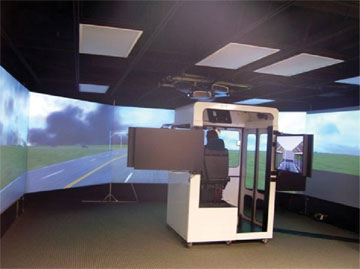
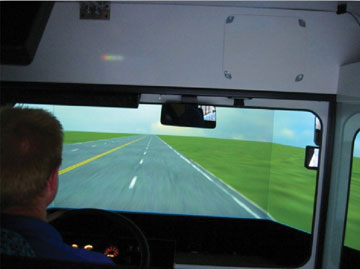
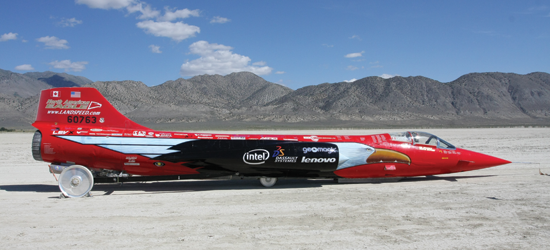
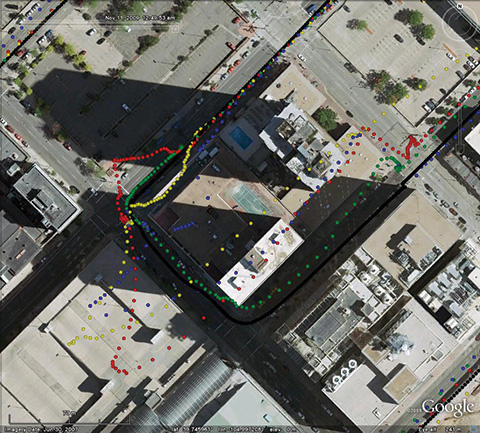
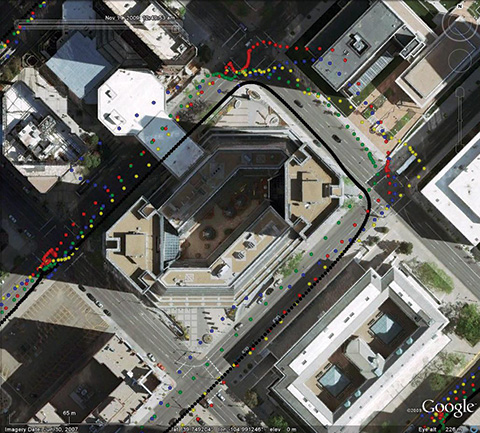
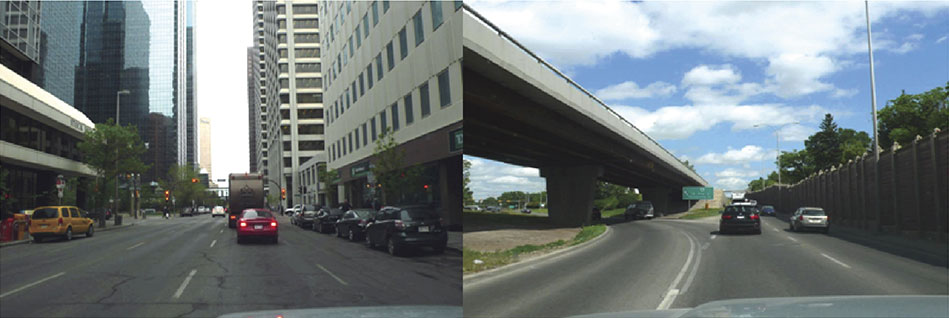
Data was collected in the seven test environments listed in Table 1. These environments were selected in accordance with Federal Highway Administration descriptions. Each environment provided different challenges for GNSS-based positioning. Obviously the deep urban environment was challenging because the reduced number of visible satellites and the large amount of multipath meant that navigation solutions were both rare and of poor quality. As another example, the mountain environment was interesting because often almost half the sky was occluded by trees on the mountain side, leading to an asymmetrical visible GPS satellite constellation with the associated solution degradation. The photos at the beginning of this article show selected driving environments encountered during testing.
V2V Solution Accuracy. Positioning accuracy of the individual receiver was first investigated to estimate the V2V relative positioning accuracy when using the DPOS method. This was done for the entire dataset.
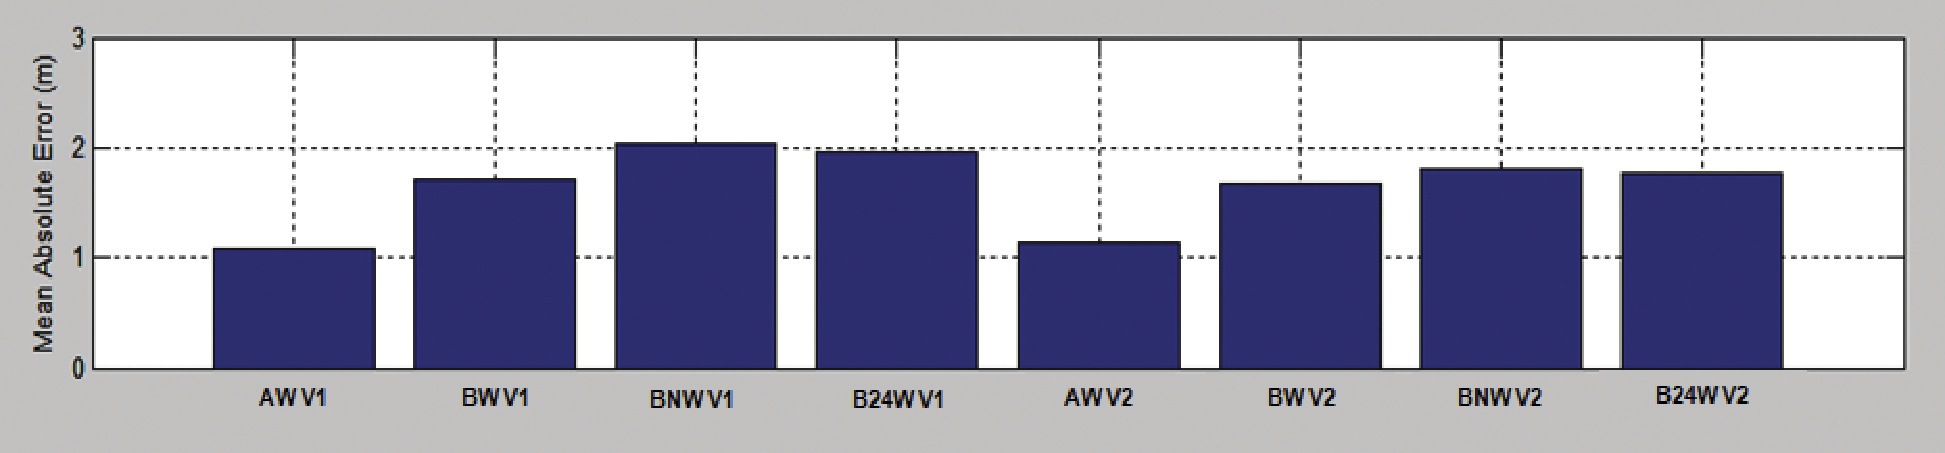
Figure 3A shows a representative freeway dataset to illustrate overall trends: the absolute 2D mean position errors observed from all eight GPS receivers used in both vehicles. The first set of four receivers shown were the AW, BW, BNW, B24W receivers in the first vehicle (V1), and the second set of receivers were the same type in the second vehicle (V2). As a general trend, Type A receivers provided better absolute accuracy meeting the Which Lane accuracy, whereas the Type B receivers provided Which Road accuracy. Also, the use of WAAS with receiver Type B has yielded some absolute accuracy improvement. Limiting the constellation to 24 (B24W) did not significantly degrade accuracy in this case.
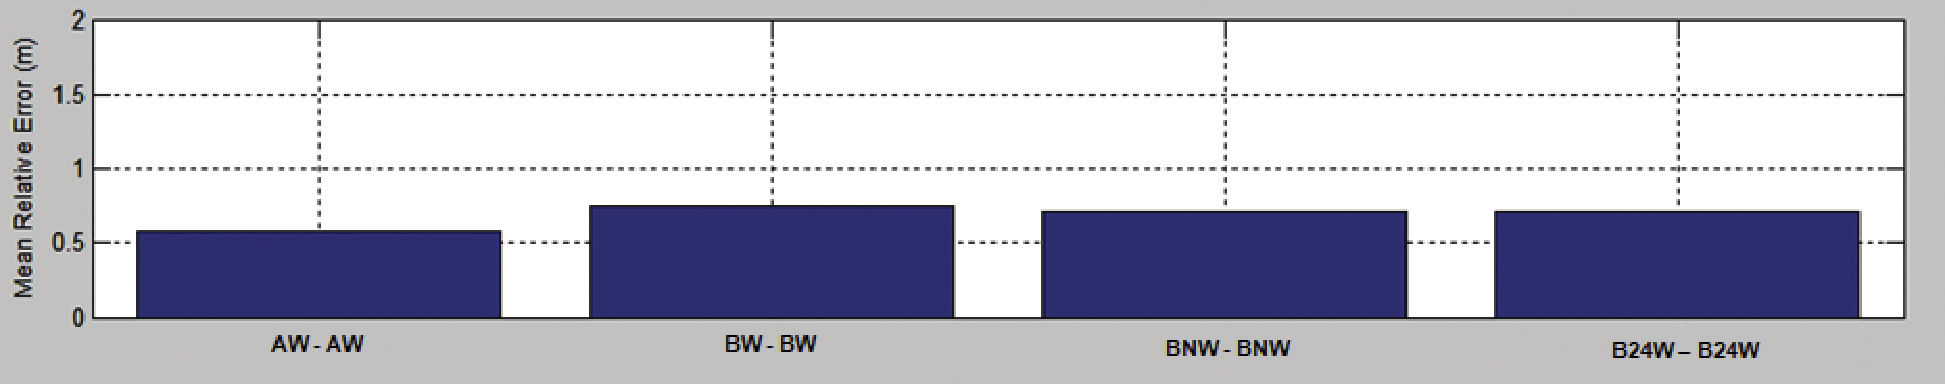
As a second step, V2V relative accuracy when the same receiver type was used was estimated, and the mean errors are shown in Figure 3B. Based on the mean error for each pair, all four receiver pairs were able to provide Where-in-Lane relative position accuracy. The geodetic grade Type A receiver pair (AW–AW) yields the best relative accuracy at around 0.5 meters relative 2D error. In comparison with the mean absolute errors, the V2V relative accuracy is greatly improved as a result of cancellation of correlated errors, indicating a high degree of correlation of absolute errors in receivers under these test conditions.
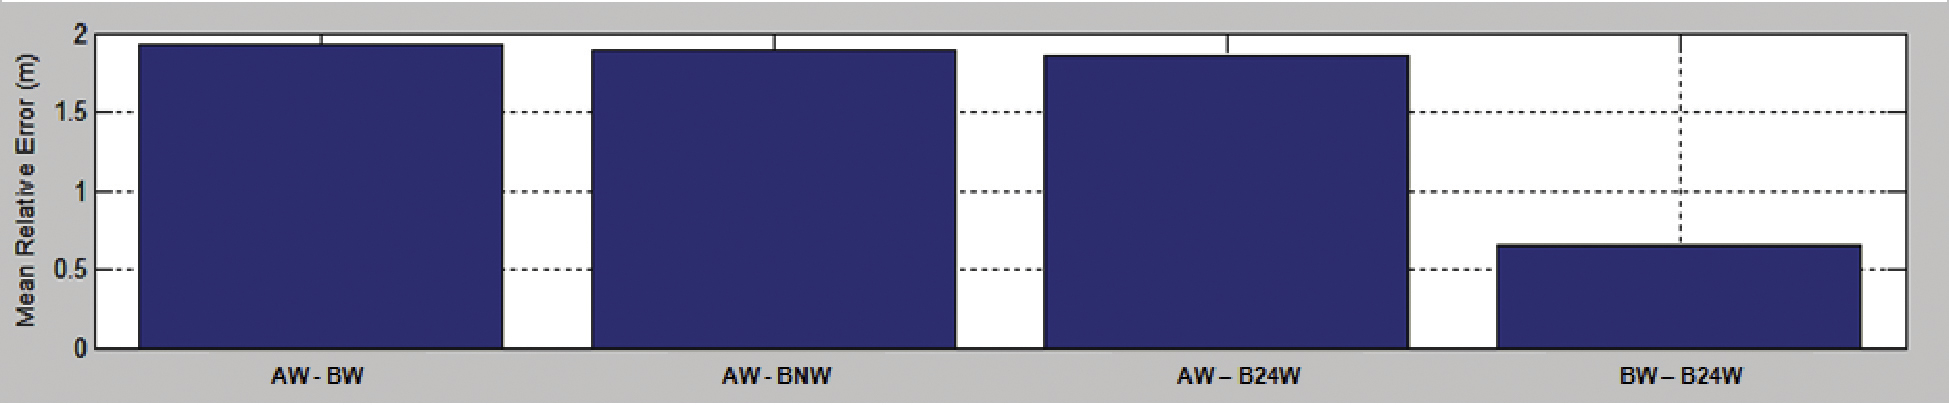
The relative accuracy with mixed receiver types or configurations was also estimated. With r
espect to receiver type mixes, the Type A receiver from vehicle 1 was used with the three Type B receivers in vehicle 2, yielding three combinations as AW–BW, AW–BNW, and AW–B24W. Mean error statistics for these three combinations and the combination of BW from vehicle 1 and B24W from the second vehicle are shown in Figure 3C. In comparison to the same type receiver pairing, this shows much larger mean errors. For instance, for all AW receiver mixes, the mean relative error is around 2 meters. Therefore, it is fair to conclude that error characteristics and modeling in the navigation solutions in receiver A and B are type-dependent, and they may not be compatible when a receiver mix is used. The BW–B24W combination does not show a significant increased mean error, indicating that the constellation difference in this test was not significant enough to result in an increased relative positioning error.
V2V Solution Availability
Availability statistics were generated for all accuracy categories (Which Road, Which Lane). At a more abstract level, solution availability statistics were also calculated for the DPOS and RTK methods. RTK solutions were defined as available whenever the software yielded a solution for that particular epoch. Data gaps in the RTK method could be caused by either communication failure due to, for example, a large truck entering the line of sight between vehicles, or one vehicle disappearing around a corner, or because insufficient observations from common satellites were available at the two vehicles. DPOS solutions, calculated in post-processing, were defined to be available whenever both receivers had observations from four or more satellites and were therefore able to calculate the necessary independent position solutions. While the two definitions of availability are not quite congruous, because only that for the RTK includes the possibility of communication failure, comparison of logs of data transmitted between the vehicles showed that out of approximately 45 hours of data, only 0.22 percent of missing RTK solutions could be attributed to failure of the DSRC link.
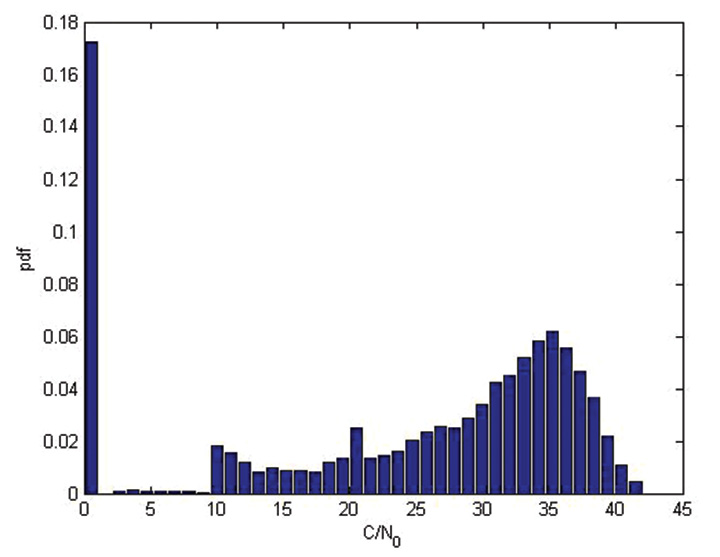
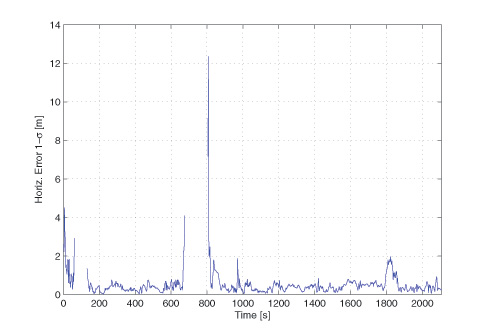
Figure 4 plots the distribution of GPS service outages observed by AW and BW receivers in individual vehicles in all of the test environments including deep urban. Here, as described for the DPOS method, an outage for a single receiver is identified on an epoch basis whenever the receiver has observations from less than four satellites. The total driving time included in this dataset is 45 hours and 4 minutes for each receiver. Figure 4 [deep urban] shows the same statistics for deep urban environment driving only, and this contains 1 hour and 40 minutes of driving for each receiver. The latter was selected specifically as this environment contained the most challenging conditions.
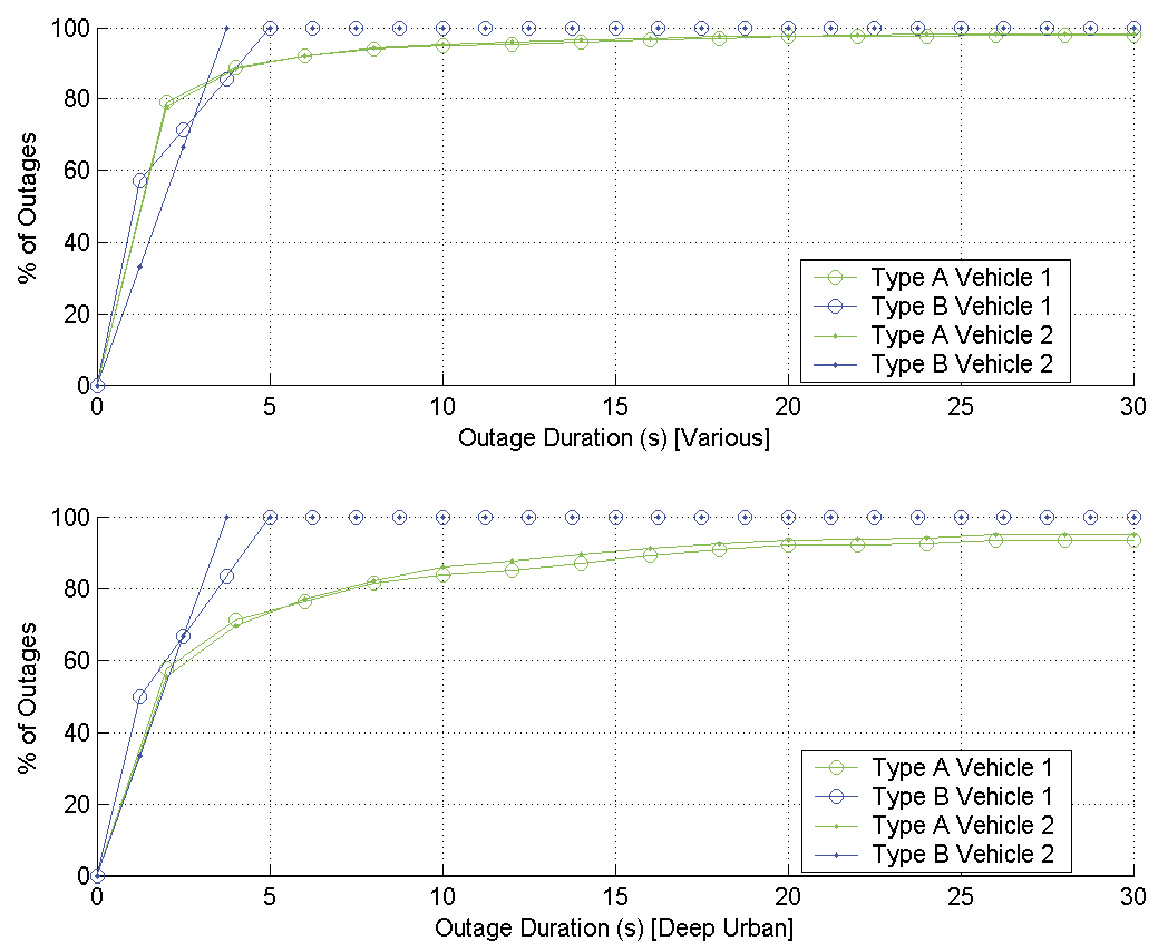
An important conclusion based on this data is that more than 98 percent of the individual vehicle-level service outages in the entire study lasted less than 30 seconds using any one of the receiver types. For the deep urban environment, 93 percent of the outages lasted less than 30 seconds. However, when using the high-sensitivity enabled Type B receivers, 100 percent of the outages lasted less than 5 seconds. No significant outage difference is seen between the observations from the same receiver type in the two vehicles.
GPS service availability for V2V applications was calculated using two approaches for the two relative positioning methods. For the DPOS method, individual vehicle service availabilities were time-synchronized in post-mission, and V2V DPOS solution availability was estimated. Figure 5 compares V2V solution outages using both receiver types and both relative positioning methods.
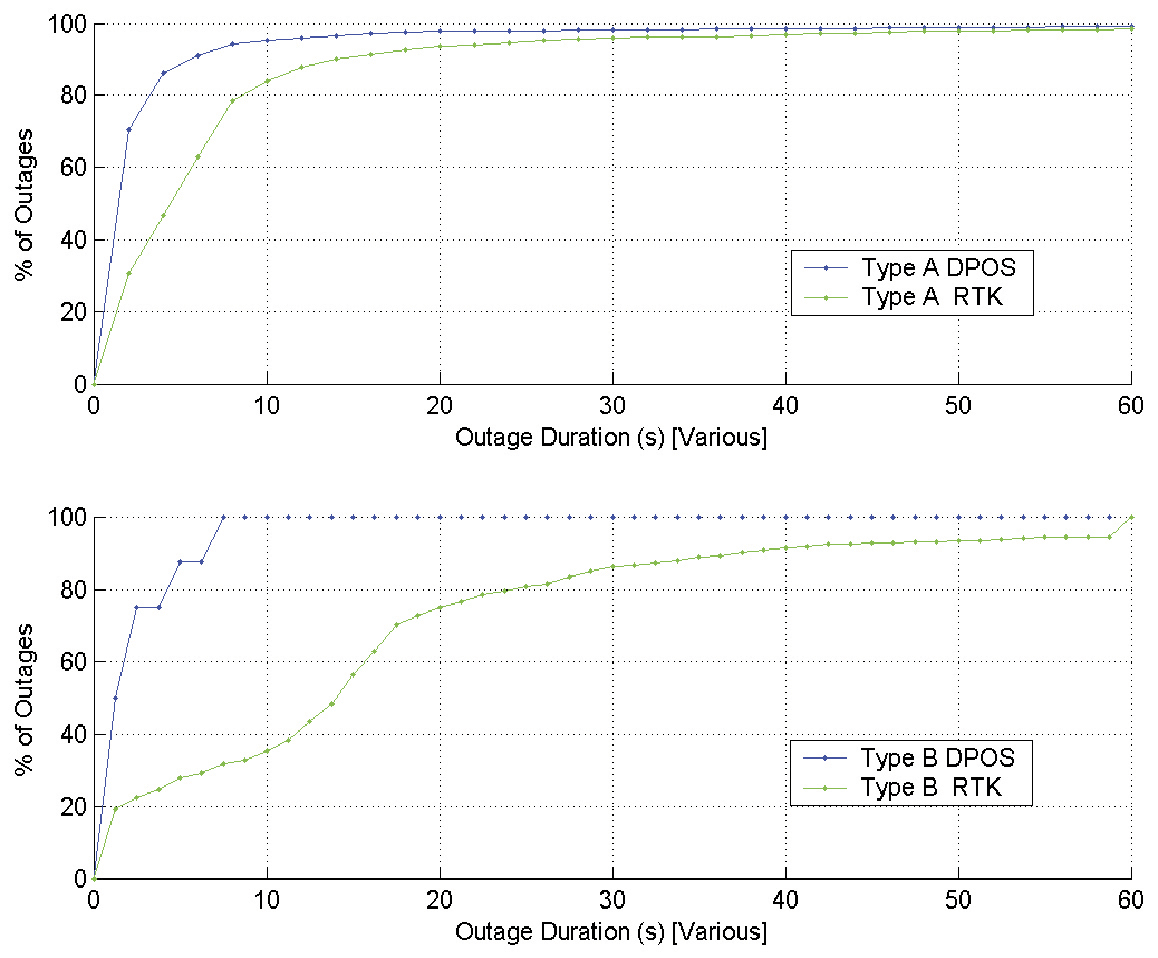
The DPOS method yields better solution availability statistics than RTK. With both receiver types, more than 95 percent of DPOS solution outages are less than 10 seconds. With the RTK method, relatively longer outages were observed, especially for Type B receivers. With Type A receivers, the difference is only significant for outages shorter than 30 seconds. For Type B receivers, larger percentages of longer RTK outages were observed; this can be potentially attributed to poor carrier-phase tracking loop performance of these receivers and the impact on RTK.
Using GNSS Data
We anticipated performance issues arising from receiver type and configuration incompatibilities going into the prototype development effort. We identified use of raw GPS measurements instead of the DPOS method as one method to overcome this limitation, as the differencing techniques with measurement data guarantees correlated error cancellation. This was one reason to include the RTK capability in the prototype system. Therefore, confirming the fact that use of raw measurements eliminates the receiver type and configuration-related incompatibilities was a major goal of the study.
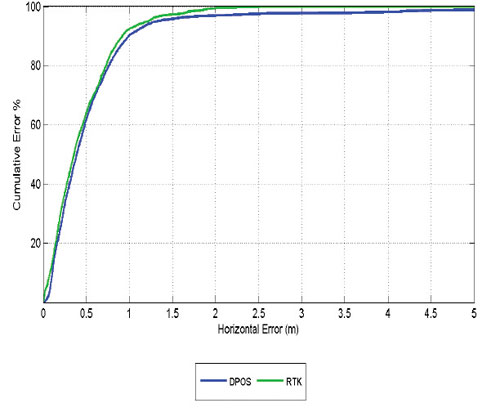
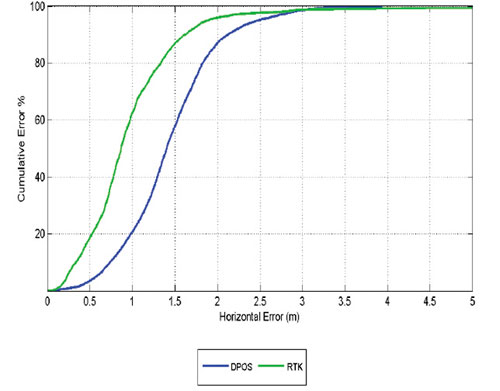
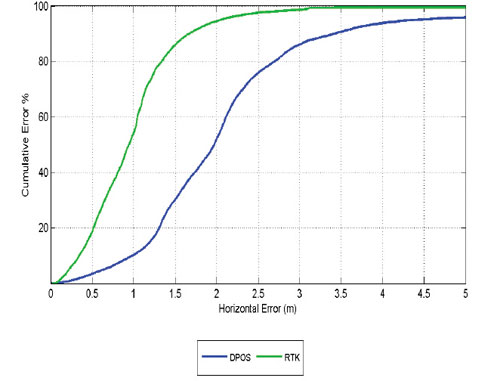
As discussed earlier, V2V relative position solutions using RTK were logged in real time as a part of the test setup. We compared these real-time RTK solutions and the DPOS solutions estimated in post-mission for all datasets. Figure 6 shows three cumulative probability distribution (CDF) plots generated using RTK and DPOS accuracy data from a freeway test dataset. The first CDF plot (left) shows the comparison of accuracy when both vehicles use Type A receivers with RTK and DPOS methods. The second CDF plot (center) shows the same CDFs when both vehicles use the Type B receivers. The third shows the DPOS and RTK accuracy CDFs when vehicle 1 uses Type A receiver and the other uses Type B receiver.
Figure 6 demonstrates that if higher quality GPS receivers similar to Type A are used in both vehicles, both RTK and DPOS methods would provide a solution of better than Which Lane accuracy more than 90 percent of the time. However, if Type B receivers are used, a solution with similar accuracy will only be available 60 percent of the time if the DPOS method is used for relative positioning of the vehicles. If the RTK method is used, this availability can be increased up to 90 percent.
The performance difference between the two methods becomes even more prominent when the two vehicles use a mix of receiver types. In the right-most CDF of Figure 6, a solution with Which Lane accuracy is only available 30 percent of the time if DPOS method is used with the mixed receiver configuration. The RTK solution availability still remains around 90 percent even with the mixed configuration. This confirms that use of measurement data eliminates some of the limitations associated with the DPOS method.
Comparison of only the RTK performance between all three CDFs in Figure 6 shows that RTK V2V performance is only limited by the worst-performing receiver in the receiver combination. Out of the three CDFs, the middle (both vehicles using Type B) and the right (Type A and B mix) CDFs have almost identical RTK performance curves. Given that the RTK curve with both using Type A receivers shows much better performance, it is fair to conclude that in the mixed-receiver case, the RTK curve is limited by the performance of th
e Type B receiver. Figure 6 also shows that at Which Road accuracy, all receiver combinations and both processing methods yield almost identical performance.
Other Approaches
Given that carrier-phase measurements are subject to cycle slips in some road environments, we ran a test using code measurements only in relative mode, using selected data sets collected on a mountainous highway. Only common satellites were used. Given that code measurements are not affected by a loss of phase lock, such a solution is more robust, but is subject to code noise and multipath. The RMS horizontal position differences between these solutions and the reference inter-vehicle separations were 25 centimeters and 1 meter for receiver Types A and B, respectively. Both receiver types meet the Where-in-Lane requirement in this test. Type A, with its low code noise and excellent code multipath-reduction capability, has a clear advantage.
Such an approach would represent a compromise between the DPOS and RTK approaches. Its advantage over the RTK approach is a lower data transmission-rate requirement, while that over the DPOS approach is the use of common satellites only. The latter is quite significant, since low-elevation satellites contribute the most to horizontal position solutions, but their measurements are affected more by atmospheric transmission errors that are most effectively removed in differential mode on a satellite-by-satellite basis.
V2V Operation with V2I
While infrastructure support can almost always improve the performance of other V2X applications, it can pose a challenge for positioning when such coverage is not continuous. The complication arises as a result of vehicles transitioning in and out of V2I coverage areas. V2I systems are highly likely to include GNSS augmentation capability so that vehicles within a coverage area benefit from better positioning capability. However, when vehicles transition from standard (V2V) operation mode to a V2I enhanced mode, some effects in the vehicle position domain can pose potential challenges for DPOS-based V2V.
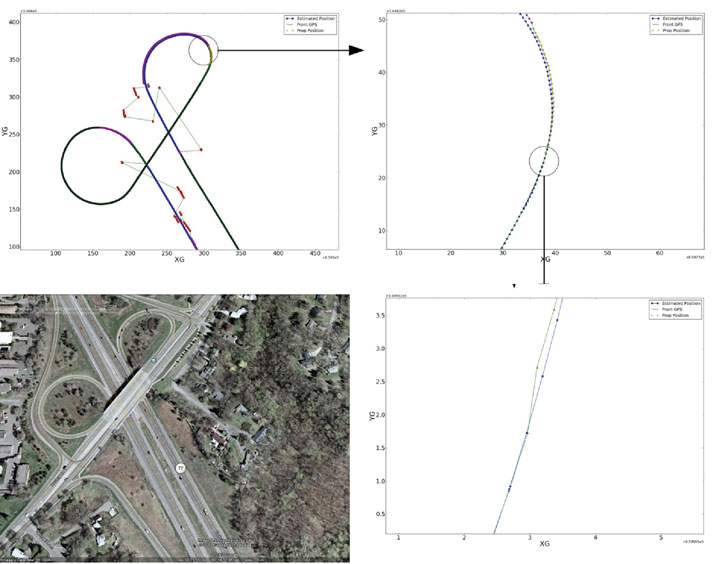
The field study included test scenarios with limited V2I coverage in different driving environments: all of those described above with the exceptions of deep urban and mountains. In deployment, the infrastructure points (IPs) would broadcast aiding information to the vehicles within their coverage area, allowing real-time calculations. In the field study, in which the role of the IP was filled by a stationary high-grade receiver with a tripod-mounted antenna, all V2I estimates of the IVV were calculated using post-processing. Further, V2I estimates of the IVV were only calculated when at least one of the vehicles was within the coverage area of the IP, here chosen to be a circle of radius 300 meters centered at the IP. This range was chosen since it is the nominal effective range of the DSRC link.
The location of the IP, that is, the phase center of the stationary antenna, was determined using commercial RTK network software with additional stations at precise locations on the rooftop of a building at the University of Calgary. The estimated accuracy of this position was 5 millimeters (1 sigma). The distances of the vehicles from the IP, used to indicate when the vehicles transitioned into and out of the IP coverage area, were determined using the GPS/INS reference trajectories. In post-processing, once a vehicle was identified as having entered the IP coverage area, commercial RTK software was used to estimate the position of the vehicle, using the IP as base and each of the test receivers on that vehicle as rovers. The IVV was then calculated using the difference of the positions of the two vehicles. Thus, the V2I estimate of the IVV was determined using what is essentially the DPOS method with stationary base RTK-indicated vehicular positions, instead of the less accurate single-point GPS position solutions. When only one vehicle was within the coverage area, single-point solutions were used for the distal vehicle, resulting in a solution called V2I-S.
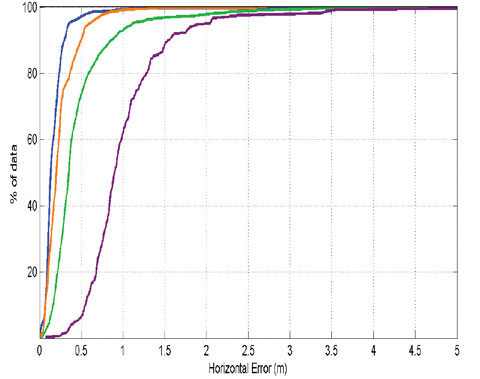
Figure 7 shows two sets of CDFs generated to illustrate the V2V positioning accuracy with V2I capability. The left plot corresponds to AW–AW receiver combination, and the right plot corresponds to the BW–BW combination. Each plot includes four curves. One pair of curves shows the V2V positioning accuracy without V2I, which includes performance when using the DPOS method (green) and another when using RTK (blue). The second pair shows the accuracy of the V2I and V2I-S estimates.
The most striking observation from Figure 7 is the separation of the V2I-S case from others for both receiver combinations (purple). It shows much worse positioning accuracy compared to the other three curves. For instance, using a BW–BW pair, the system will meet the Which Lane accuracy requirement around 80 percent of the time for either DPOS or RTK V2V without V2I support. However, when V2I coverage is available to only one vehicle, the V2I-S case, the accuracy requirement is only met at 40 percent confidence.
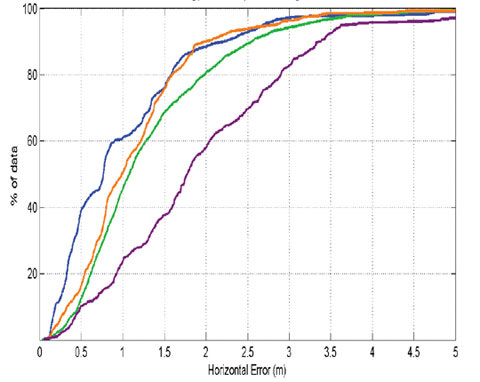
Thus, system accuracy performance degrades when vehicles are operating in DPOS mode and are transitioning in and out of the V2I zones. This is because the V2I-S estimate is the difference of an accurate position solution for the vehicle within the coverage zone, and a potentially inaccurate single-point solution for the one outside the coverage zone. The beneficial cancellation of similar errors that occurs for DPOS estimates (using similar receivers and with common satellite observations) does not occur for V2I-S.
Potential solutions to this problem include using a V2I method of IVV calculation that is not dependent on the estimated position alone (that is, use RTK or other measurement-based methods as opposed to DPOS), or using a position-mode indicator with the DPOS mode such that a DPOS-based V2V solution is only generated when both vehicles are operating in the same mode (that is, V2I). However, the latter does not provide a remedy for the complications when the two vehicles are operating in two different modes. One could also consider a variation of the latter method whereby a V2I-augmented position and a non-augmented position is maintained by each vehicle, such that one of them could be used to generated a mode-matched DPOS V2V solution for a given sender.
Recommendations
These extensive trials provided valuable data demonstrating technical challenges associated with V2X positioning.
- Error characteristics and modeling in the navigation solutions in receivers A and B are type-dependent, and they may not be compatible when a receiver mix is used with the DPOS mode. This is very likely to be the case for many other commercial receivers. Therefore, it is important to develop receiver hardware and software minimum-performance standards that define acceptable performance for measurement quality, satellite tracking and selection criteria, reliability estimates, navigation-solution parameters, and other such indicators.
- Findings with RTK confirm the fact that use of measurement data eliminates some of the limitations associated with the DPOS method. While RTK is the most demanding raw data-based method in terms of processin
g requirements and OTA data needs, the study also conducted limited investigation on other methods that use raw code data and are less resource-intensive, and at the same time better performing than DPOS. Such an approach would represent a compromise between the DPOS and RTK approaches. - An important conclusion based on this data is that more than 98 percent of the individual vehicle-level service outages in the entire study lasted less than 30 seconds using any one of the receiver types. For the deep urban environment, 93 percent of the outages were less than 30 seconds. These statistics are useful for future research on suitable GNSS augmentation methods.
- System accuracy performance degrades when vehicles operate in DPOS mode and transition in and out of the V2I zones. Potential solutions should be incorporated into the systems to take care of these limitations.
Acknowledgments
The authors thank the Crash Avoidance Metrics Partnership Vehicle Safety Communications-Applications team, in particular the Vehicle Positioning Technology Development team, for input. This work was conducted as a part of a CAMP VSC-A project under a cooperative agreement with the U.S. DOT.
CHAMINDA BASNYAKE is a senior research engineer at General Motors Global Research and Development and GNSS technology expert for GM OnStar. He leads GNSS-based vehicle navigation technology R&D efforts at GM and holds a Ph.D. in geomatics engineering from the University of Calgary.
TOM WILLIAMS is a postdoctoral researcher in the PLAN group in the Department of Geomatics Engineering at the University of Calgary.
PAUL ALVES is a Calgary-based geomatics consultant specializing in RTK. He obtained his doctorate from the University of Calgary.
GERARD LACHAPELLE holds an iCORE/CRC Chair in Wireless Location and heads the PLAN Group in the Department of Geomatics Engineering at the University of Calgary.
 The Elephant Charge (“Dust, Sweat, and Gears”), an annual off-road motorsport charity event, brings together competitors, their families, and supporters for a wilderness weekend of GPS-driven fun and frenzy in the Zambian bush. I’m for fun, but I always wince when I see folks tearing up habitat in the name of saving it.