Tag: A-GPS

  • Opening Up Indoors: Japan’s Indoor Messaging System, IMES

    By Dinesh Manandhar and Hideyuki Torimoto, GNSS Technologies, Inc. Japan

    An indoor messaging system (IMES) has been developed to meet the challenges of indoor and deep indoor positioning, as a system that can be implemented in any device that has a GPS/GNSS receiver without hardware modification. IMES can provide reliable 3D position data with a single transmitter device without performing range calculation.

    The cost of embedding location data in portable electronic devices is so low that universal penetration can be foreseen in the next five years. Roughly 70 percent of the world’s population now uses approximately five billion cell phones. This number has doubled in the last four years. Future growth is expected at the same or even a higher growth rate.

    Due to the emergence of smart phones and location-based services (LBS), mobile phones are used not only for communications but also for many applications related to LBS, entertainment, and games. GPS/GNSS devices are included in mobile phones due to compulsory requirement of E911 and safety-and-rescue services by law in many countries for security and safety.

    Access to map data and value-added services using these map data is getting cheaper and eventually will be freely available. Major service providers like Google, Nokia, and Apple already provide access free of cost, and they increasingly focus on location as a core business construct.

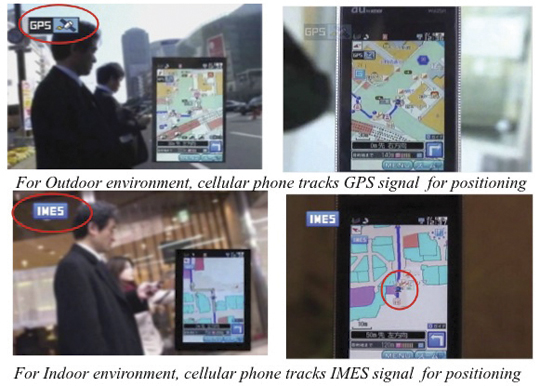
    GPS/GNSS devices were designed to work outdoors, and most GNSS applications are limited to outdoor environments. However, GNSS reliability, availability, and accuracy have led to development of many new and innovative applications that are designed for use in both outdoors and indoors in a seamless fashion. Today, GNSS receivers are integrated in many other devices like mobile phones, navigation systems, personal navigation devices, game devices, security devices, and many LBS-related devices. These devices are increasingly used in indoor environments. Indeed, people generally spend much more time indoors than outdoors. Hence, it is extremely important to have a reliable system that can provide fairly accurate position data even in indoor and deep indoor locations.

    Current GNSS systems do not provide solutions for indoor and deep indoor environment with reliable accuracy of 10–20 meters. New modernized signals such as L5 do provide better position accuracy and better signal reception in indoor areas, but achievable positioning will still vary, and will continue to require more than four visible satellites with some assist data — and still be limited to soft indoors environments such as rooms with glass windows or walls. Limitations remain for hard and deep indoor environments.

    To surmount these obstacles and provide indoor navigation, various technologies such as pseudolites, assisted GPS, wireless networks (Wi-Fi), Bluetooth, RF tagging, and so on have been developed. However, these technologies have their own limitations and are not the most suitable tools for seamless positioning and navigation. Except for pseudolite and A-GPS, they are designed for communication, not for positioning or navigation purposes, but are used for navigation purposes since no other suitable technology exist.

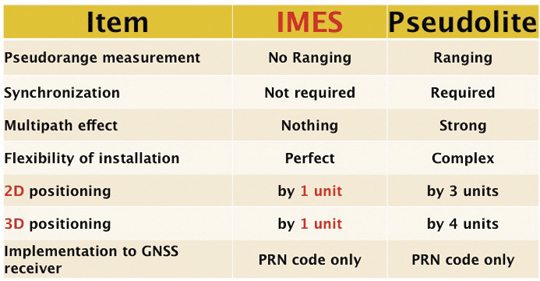
    Pseudolite systems are currently in use for indoor positioning. While technically sound, a system needs at least four signal transmitting units. To cover a large area, it needs many transmitters suitably located and time-synchronized to one other, or their clock errors must be known. Pseudolite systems provide position data based on range calculation from the receiver to a number of transmitters, and this calculation is heavily affected by signal multipath. Table 1 compares IMES and pseudolites.

    IMES-Table1 Source: Dinesh Manandhar and Hideyuki Torimoto, GNSS Technologies, Inc. Japan
    Table 1. Comparison between IMES and pseudolite.

    A-GPS is widely used in mobile phones to compute position data. A-GPS technology includes high-sensitivity signal processing to acquire weak signals and external assistance of data like time, approximate position, and satellite-orbit related parameters. Provision of assistance data requires a communication link between the receiver and the data source, for example, the mobile phone network itself. Thus, A-GPS will not be possible if there is no communication link.

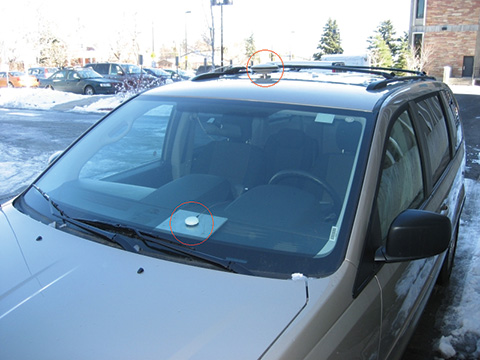
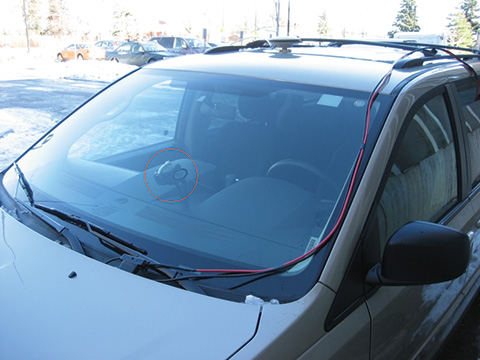
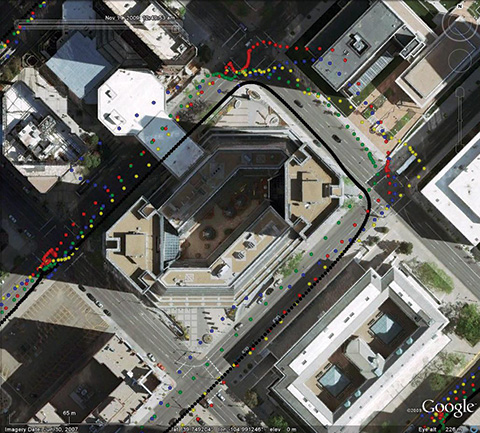
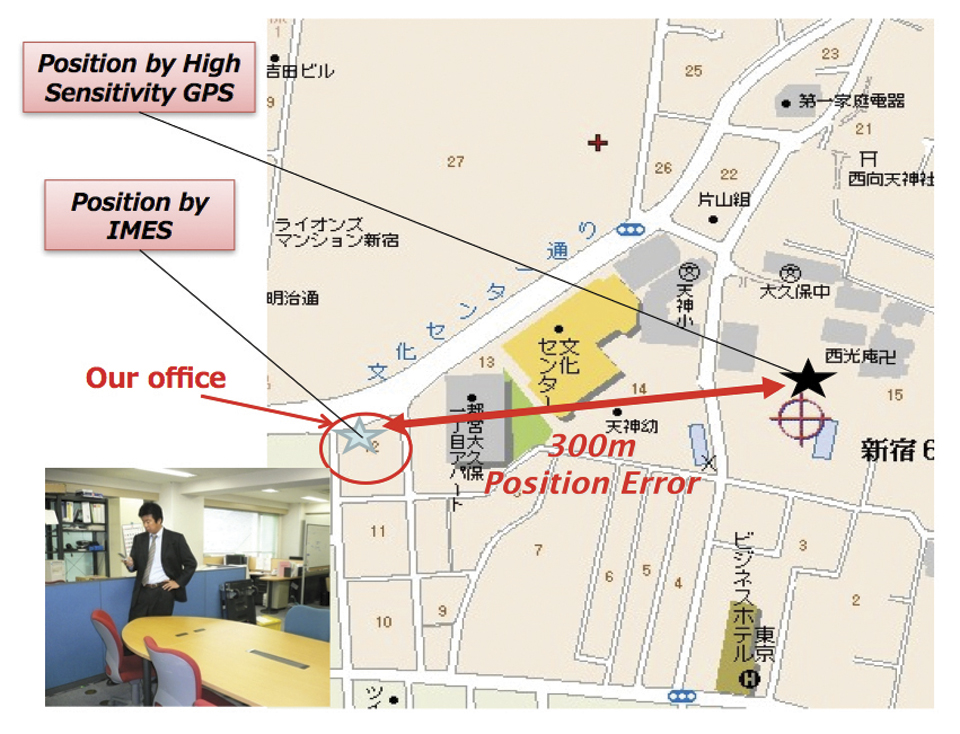
    Normally, A-GPS provides 2D position data. The height data (if 3D output is available) will be highly erroneous. The accuracy of such position data varies from few tens of meters to few hundreds of meters. Also, the position data is heavily affected by signal multipath. Figure 2 compares IMES position and mobile phone position inside an office building. The A-GPS position error is about 300 meters in this case.

    IMES-2-B Source: Dinesh Manandhar and Hideyuki Torimoto, GNSS Technologies, Inc. Japan
    FIGURE 2. Indoor position from high-sensitivity GPS and IMES.

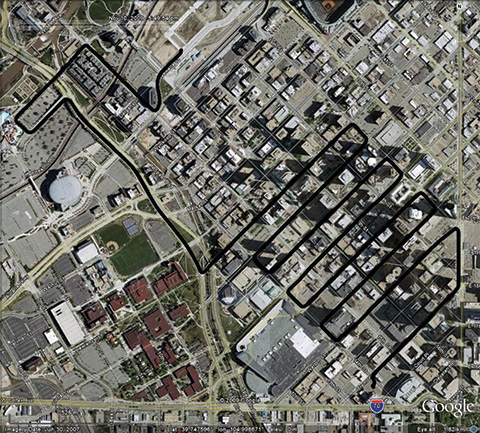
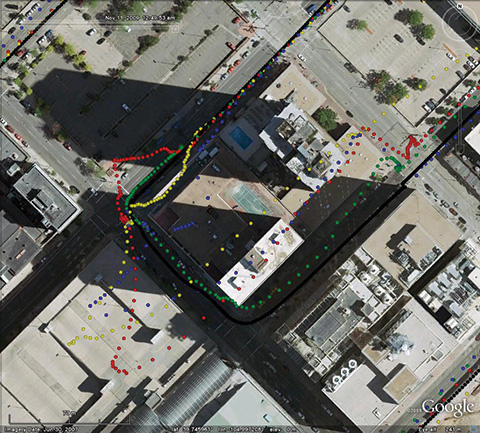
    Wi-Fi is used for indoor positioning in many mobile phone devices. The phone provides position data from a built-in GPS receiver, a Wi-Fi device, cell ID, or a combination of any of these. Recently, position data from Wi-Fi has become popular for indoor as well as outdoor position, since Wi-Fi signals are so freely available. However, using these Wi-Fi signals requires registering the signal power and availability at reference locations. To do this, a huge number of Wi-Fi devices are registered driving around the city. Since these devices are basically installed for communication purposes, they can be relocated, removed, or new devices may be installed without any information to the users or service providers. Thus, continuous maintenance and updating of all these devices are necessary at certain time intervals. The coverage of Wi-Fi devices is not uniform and may vary widely from area to area, affecting position accuracy.

    Telecom service providers are considering the possibilities of seamless positioning technologies. They would like to have one single device that can provide 3D position data both indoors and outdoors, without additional power or cost, and with satisfactory 3D position information. If such a seamless positioning technology is available, it will undoubtedly generate a huge global commercial market. The availability of such technology will also aid development of new applications in location-based services, advertising, marketing, entertainment, and gaming.

    We have conducted research in indoor positioning for the past few years, beginning with pseudolite systems. We have developed IMES to meet the shortcomings of the technologies described earlier for indoor and deep indoor positioning. IMES for a seamless positioning environment can be implemented in any device that has a GPS/GNSS receiver, without hardware modification. IMES can provide satisfactory and reliable 3D position data with a single transmitter device without performing range calculation.

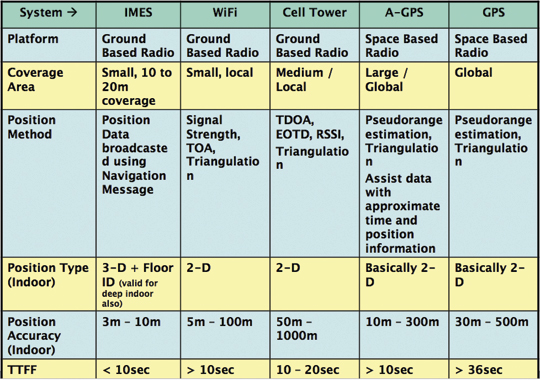
    Table 2 compares IMES with other indoor-position capable devices. IMES can provide the same accuracy even in deep indoor locations, whereas cell tower, A-GPS, and GPS cannot work in such areas. All other systems except IMES provide only 2D position data indoors. The height data from A-GPS is very unreliable and hence cannot be used.

    IMES-Table2 Source: Dinesh Manandhar and Hideyuki Torimoto, GNSS Technologies, Inc. Japan
    Table 2. Comparison of IMES with other indoor positioning systems.

    IMES Concept

    The main concept of IMES is to transmit position and floor ID of the transmitter with the same RF signal as GPS. IMES transmits latitude, longitude, height, and floor ID by replacing the ephemeris and clock data in the navigation mes
    sage of GPS. A single unit of IMES is enough to get the position data, since the position itself is directly transmitted.

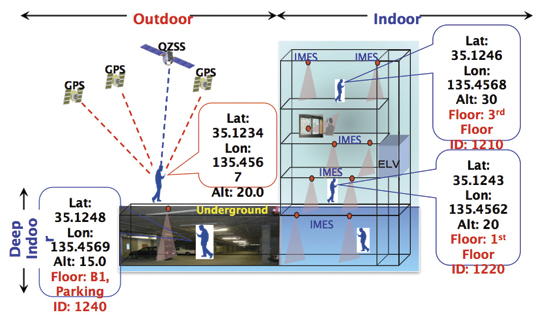
    Figure 3 shows the concept of seamless position data using IMES, where the same receiver can be used both indoors and outdoors without interruption. GNSS satellites provide positioning and navigations outdoors, while IMES provides indoor navigation. Since the signal structures of GPS satellites and IMES is the same except for the navigation message contents, the same receiver can be used for both cases. Current GPS receivers will be capable of receiving IMES signals with modification of firmware only to decode the navigation message. Figure 3shows the concept of seamless 3D route guidance.

    IMES-3 Source: Dinesh Manandhar and Hideyuki Torimoto, GNSS Technologies, Inc. Japan
    Figure 3. Seamless 3D route guidance using IMES.

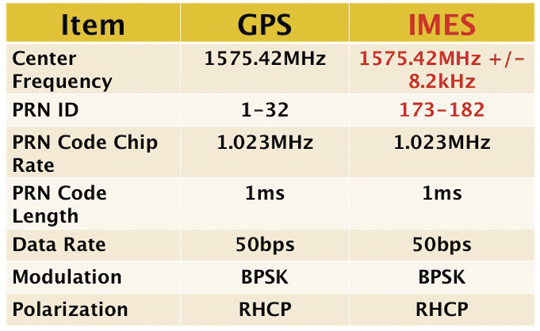
    Signal Properties. The IMES signal is designed much like the GPS signal. It uses the same center frequency as GPS with an offset of +/– 8.2 kHz to minimize the possible interference from IMES to GPS signal. Ten PRN codes from 173 to 182 are assigned for IMES. These codes are provided by the U.S. government. Other signal-related parameters are the same as the GPS L1 C/A code signal. Table 3 shows IMES signal properties with respect to the GPS signal.

     Table 3. IMES signal properties with respect to GPS. Source: Dinesh Manandhar and Hideyuki Torimoto, GNSS Technologies, Inc. Japan
    Table 3. IMES signal properties with respect to GPS.

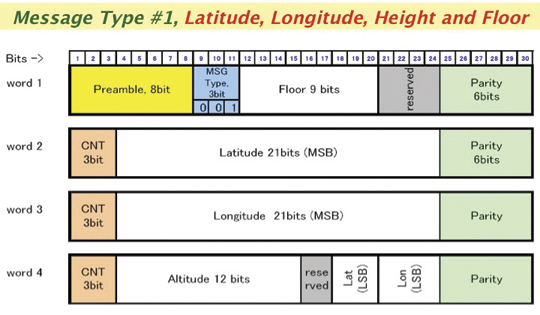
    IMES has four different types of navigation message. The most significant is Type 1 as shown in Figure 4. It transmits latitude, longitude, height, and floor ID. The transmission of floor ID is a key factor for perfect 3D position data. Other message types are Type 0 (2-D position data with floor ID), Type 3 (short ID), and Type 4 (medium ID).

    Figure 4. IMES Message type 1, 3D position, and floor. Source: Dinesh Manandhar and Hideyuki Torimoto, GNSS Technologies, Inc. Japan
    Figure 4. IMES Message type 1, 3D position, and floor

    Interference Issue

    Since IMES shares the same frequency as GPS L1 band (1575.42 MHz), there is an interference level that IMES may have on GPS signals. This interference has been studied in detail by conducting experiments and simulations. Based on these studies and analysis, various methods have been considered to avoid harmful interference to GPS signal. To avoid such interference, IMES center frequency is shifted by +/– 8.2 Khz from GPS L1 band. This will have the least impact on the GPS L1 band signal. For example, if the IMES signal is –110 dBm (very strong) and the GPS signal is –142 dBm (very weak), the loss of GPS signal (C/N0) due to IMES is less than 2 dB. If the IMES signal is –120 dBm and the GPS signal is –142 dBm, there is no loss of GPS signal (C/N0). Based on this analysis, the IMES transmitter power must be controlled such that the maximum power to the receiver does not exceed –110 dBm at a distance of 3 meters from the transmitter. Figure 5 shows the guideline specified in the QZSS IS document for setting the transmitter effective isotropic radiated power (EIRP)based on location.

    Figure 5. IMES transmitter power setup guideline in QZSS IS document. Source: Dinesh Manandhar and Hideyuki Torimoto, GNSS Technologies, Inc. Japan
    Figure 5. IMES transmitter power setup guideline in QZSS IS document.

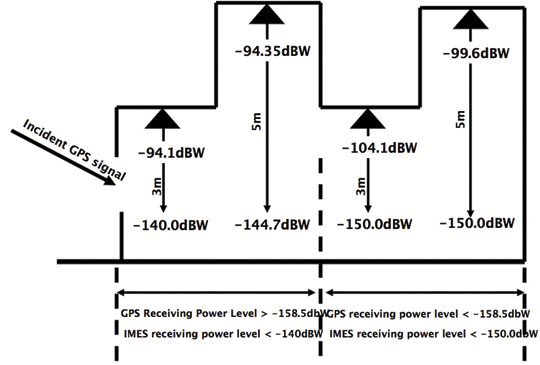
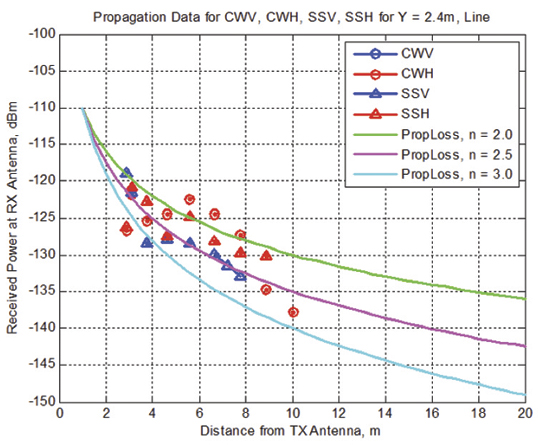
    Figure 6 shows the signal propagation loss for transmitter power of –70 dBm for various propagation loss-factor values of n. Figure 7 shows path loss for various transmitter power for the same loss factor, n = 2.5. These graphs shows the maximum power that shall be used to cover an area without exceeding the maximum power level. If a single unit of IMES cannot cover the complete area, then multiple IMES units will be deployed to cover the entire area with suitable power level. These graphs serve as a guideline for setting transmitter power.

    Figure 6. Signal path loss for –70 dBm signal for different path loss coefficient, n. Source: Dinesh Manandhar and Hideyuki Torimoto, GNSS Technologies, Inc. Japan
    Figure 6. Signal path loss for –70 dBm signal for different path loss coefficient, n.
    IMES-7 Source: Dinesh Manandhar and Hideyuki Torimoto, GNSS Technologies, Inc. Japan
    Figure 7. Signal path loss for path loss coefficient, n = 2.5, for different transmitter power levels.

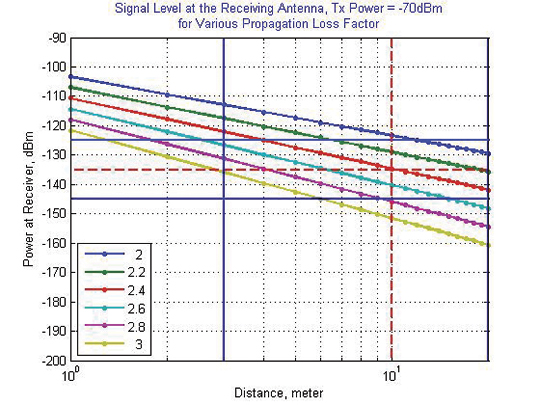
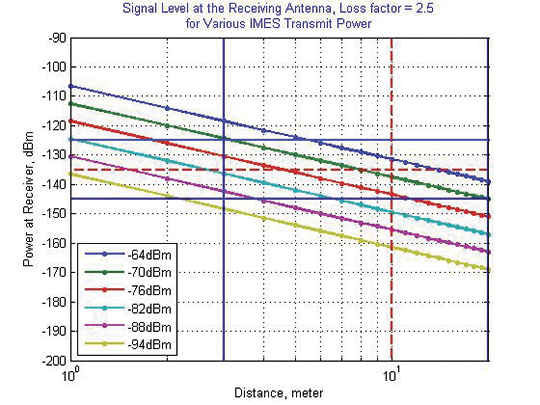
    The signal propagation loss is calculated using the following equation; the gain of transmitter and receiver antennas is considered as unit gain (0 dB).

    IMES-E1 Source: Dinesh Manandhar and Hideyuki Torimoto, GNSS Technologies, Inc. Japan

    Hence, the equation depends on distance from the transmitter, d, and the propagation loss factor, n. The value of n is 2 for free space and increases for areas with objects that obstruct the signal. An office with soft partitions may use n = 2.5. The graphs can be used as a guideline to estimate the transmitter power to cover an area within the allowed power levels.

    Application Areas

    IMES can be used wherever indoor position data is required. It depends upon the application for that particular location as well. For example, an infrastructure-related safety application should have IMES installed at all elevators, escalators, staircases, emergency exits and routes, fire-fighting unit locations, and so on. Here are some of places where IMES might be used:

    • Every room of a building, to provide exact room location.
    • At entrances, exits, elevators, escalators, staircases, public facilities, and corridors for indoor navigation.
    • At every emergency exit for guidance.
    • Along hallways and lobbies at set intervals to guide the user.
    • In front of shops for advertising and information.
    • In sign posts to provide user’s location and guidance.
    • Complement other positioning systems like Wi-Fi, RF Tag, UWB, and so on.
    • As an indoor ground control point for surveying of large and multi-storey buildings.
    • With security cameras to provide accurate position data.
    • In factory production lines for automated control of moving objects.

    Business Perspective

    IMES technology was developed with the guiding concepts of low-cost global implementation and ease of installation and use. Low cost on the transmitter side is achieved by developing large-scale integratin (LSI) chips and IMES installation, setup, and database management tools. At the receiver side it is achieved by design of IMES signal so that existing GPS receivers in mobile phones, PDAs, or any other devices can use IMES by modifying only the firmware. The signal is designed so that it can adapt to other GNSS signals available in the future, for example, Galileo, QZSS, or Compass signals, requiring only firmware modification. Global implementation is made possible by signal design compatibility with existing GPS or GNSS signals. Ease of use is achieved again by signal design: one IMES transmitter can provide 3D position data, including floor information, with reliability and accuracy of a few meters even in deep indoor locations.

    The development of IMES LSI chips (IMES transmitter) will also lead to development of value-added products for many consumer household appliances. For example, the green energy concept produced low-power LED lightbulbs. IMES chips can be installed in LED bulbs at very low additional cost. Similarly, it can be built in many other products like power socket devices, security devices, timing devices, and sensors where position data is also critical. This will provide an opportunity for the manufacturers to provide value-added products to users with indoor positioning devices. Not only electrical products but some construction materials or interior decoration materials like gypsum (dry
    wall) boards can be made with built-in IMES chips. Installation of one piece of wallboard with an IMES built-in chip can provide position data in the room, reducing installation cost while not affecting the interior design of the room.

    Implementation of IMES will also lead to new applications in the field of location-based services and applications where position data are necessary. It can also lead to new applications using IMES as an indoor electronic ground control point (GCP) in large buildings and indoor areas.

    Chip Development. To reduce IMES transmitter cost, the IMES LSI chip has been developed and will be available by the end of the third quarter of 2011. This will reduce overall cost and size, and create platforms to develop value-added products integrating with other devices and systems. The chip is designed for global communications systems like personal handy-phone system (PHS, a mobile phone communication system developed in Japan), CDMA, and GSM. Figure 8 shows a block diagram of the chip transmitter.

    Figure 8. IMES large-scale integration chip block diagram. Source: Dinesh Manandhar and Hideyuki Torimoto, GNSS Technologies, Inc. Japan
    Figure 8. IMES large-scale integration chip block diagram.

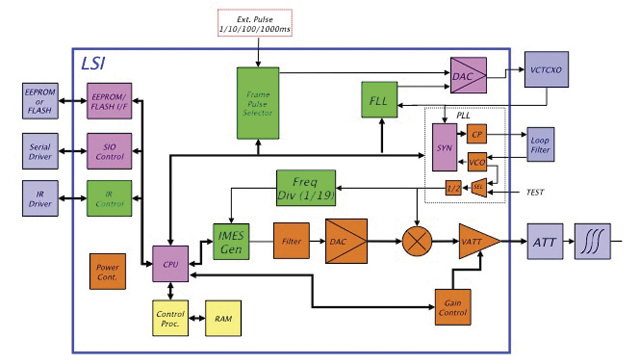
    The basic specifications of the LSI chip are: size, 12 x 12 millimeters; power, to be determined; maximum transmit power, –30 dBm or –60 dBm (user selectable); frequency, L1 band, 1575.4282 MHz or 1575.4118 MHz (user selectable); PRN codes, 173–182 (user selectable); signal type, GPS L1C/A, with upgrade capability to other GNSS signals.

    Installation and Management

    An IMES installation, setting, and management system has been developed to facilitate deployment. The main purpose of the system is to provide IMES transmitter position data (latitude, longitude, height) without conducting precision surveys, thus reducing installation, setting, and management costs. The system helps locate optimum locations for IMES transmitter siting, control transmitter EIRP power, set PRN IDs, and assign position data. The system can also use various types of map data sources to generate necessary floor data or indoor maps in 3D. The inputs can be either 3D vector data or 2D raster images, or even paper maps.

    The overall system consists of four sub-systems:

    IMES Setup Tool (ISET). This tool is used to set up the IMES transmitter. It provides two basic functions: to set up signal-related data (setting PRN code, transmitter power, navigation message rate, and so on) and to set up message-related data (position data, floor data, message types and their contents, message sequence, and so on). The R&D version of IMES also allows transmitting some special data for research and development purpose. It is possible to change the preamble value different from GPS, load a different PRN code table than IMES, change the navigation message data rate, generate a BOC(1,1) signal to test L1C-like signals, and change the RF frequency. The setup tool also has user-access management so that only authorized users can change certain sensitive data like PRN code, position data, and transmitter power.

    IMES Database Management Tool (IDBM). This tool simplifies installation and management by providing a necessary database including a building-related database, a service-provider database, a device-related database, other integrated sensors database (if any), and a signal-related database. Since IMES is controlled and managed, guaranteed and authorized services can be provided for dedicated applications. This enhances the reliability of an IMES-based positioning system for infrastructure, security, and safety-related applications.

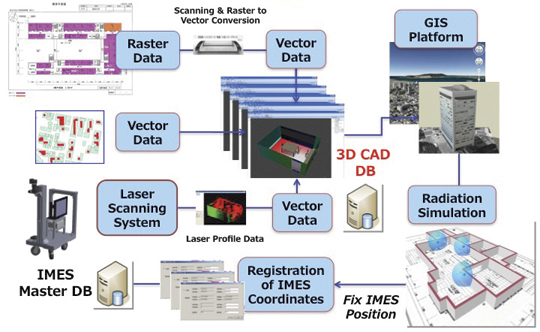
    3D Mapping Tool (IMAP). This tool, shown in Figure 9, provides a 3D map database for IMES either for implementation or end-user applications. The mapping tool can use 3D vector data (for example, existing DXF files), raster image data, or direct user input. A laser scanning system with CCD camera is used to generate 3D data if existing data is not available. The tool creates walls, windows, doors, ceilings and other smaller objects from the laser data. If data are available in paper drawings, they are scanned to create raster images before digitizing them into vector format.

    IMES-9 Source: Dinesh Manandhar and Hideyuki Torimoto, GNSS Technologies, Inc. Japan
    Figure 9. 3D Map Database Development System.
    Figure 10. Concept of IMES database for implementation, setting and management. Source: Dinesh Manandhar and Hideyuki Torimoto, GNSS Technologies, Inc. Japan
    Figure 10. Concept of IMES database for implementation, setting and management.

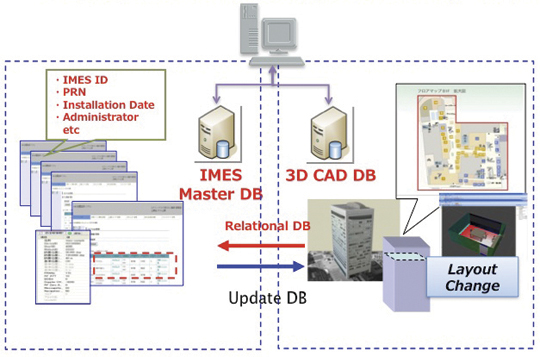
    The system will ultimately create a 3D database of a building at floor level that can be linked with external databases. Figure 10 shows the overall concept of the IMES database system that includes both IMES database and 3D map database. The two database systems are linked by a relational database system. Any update in the map database can be reflected into the IMES database.

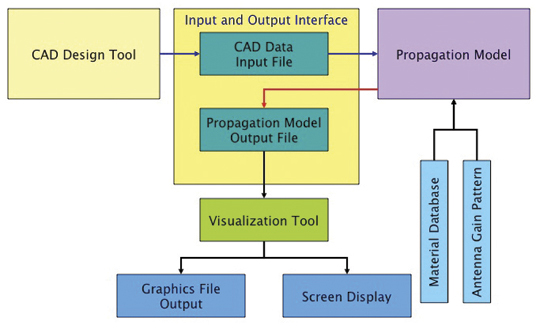
    Signal Propagation Loss Tool (IPMODEL). This tool simulates the signal level where IMES will be set up. It is necessary to have optimum deployment of the transmitter to cover the area as large as possible within the allowed power level. Although the allowed maximum EIRP power level is –64 dBm for Japan, the approach is always to use the least power possible to cover the area, to avoid any possible harmful interference to other systems as well as to limit the availability of the signal to only the desired area.

    The following equation is used to calculate the signal path loss which is based on Frii’s free-space path-loss model.

    IMES-E2 Source: Dinesh Manandhar and Hideyuki Torimoto, GNSS Technologies, Inc. Japan

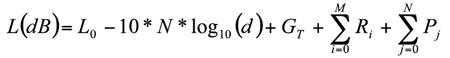
    GT is the transmitter antenna gain. The receiver antenna gain is assumed to have unit gain (0 dB) and hence not included in the model.

    L0 is the power loss at 1 m distance and is given by 20 x log10(signal wavelength) — 20 x log10(4*pi).

    N is the path-loss factor, which is 2 for free space, 2.5 for office room with soft partition, and 3.0 for rooms with hard partition.

    Ri is loss due to i number of reflections by objects.

    Pj is loss due to j number of penetrations through objects.

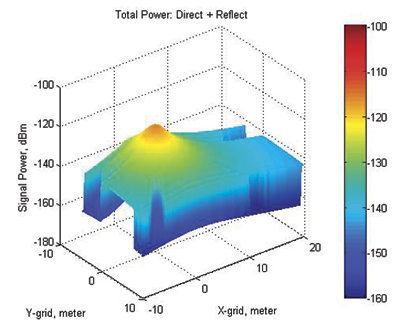
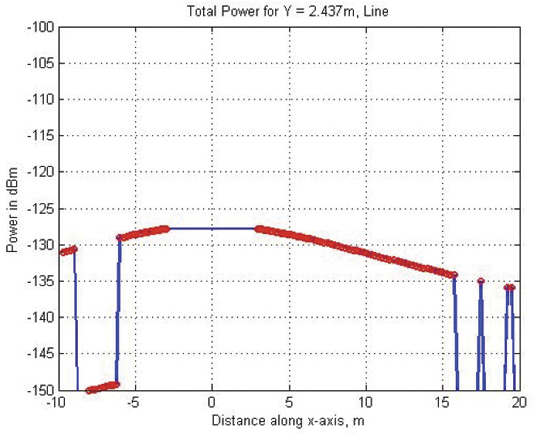
    Figure 11 shows the propagation-loss tool flowchart. It uses 3D map database provided by the 3D mapping tool and database from the database management tool. It also uses antenna gain pattern and material electrical properties to compute the power loss due to reflection and penetration. Figure 12 shows the signal propagation output from the model for a building lobby. Figure 13 and Figure 14 show the output from the propagation loss results from the actual measurement and model output, respectively. The results match within a difference of few dBs.

    IMES-11 Source: Dinesh Manandhar and Hideyuki Torimoto, GNSS Technologies, Inc. Japan
    Figure 11. Path Loss Tool flowchart.
    Figure 12. 3D view of signal power in a building lobby. Source: Dinesh Manandhar and Hideyuki Torimoto, GNSS Technologies, Inc. Japan
    Figure 12. 3D view of signal power in a building lobby.
    Figure 13. Actual signal power measured at different locations in the lobby shown in Figure 12 Source: Dinesh Manandhar and Hideyuki Torimoto, GNSS Technologies, Inc. Japan
    Figure 13. Actual signal power measured at different locations in the lobby shown in Figure 12
    Figure 14. Signal power output from the propagation loss tool at the same location shown in Figure 13 Source: Dinesh Manandhar and Hideyuki Torimoto, GNSS Technologies, Inc. Japan
    Figure 14. Signal power output from the propagation loss tool at the same location shown in Figure 13

    Experiments and Demonstrations

    Experiments and demonstrations have been conducted to validate the IMES concept, uses, and applications. Early experiments validated the
    concept, message design, and interference analysis. Later experiments focused on actual implementation for infrastructure, and social-network and location-based applications. Pilot projects have been conducted in collaboration with the Japanese government to test IMES capabilities for seamless positioning and navigation and for social infrastructure platform.

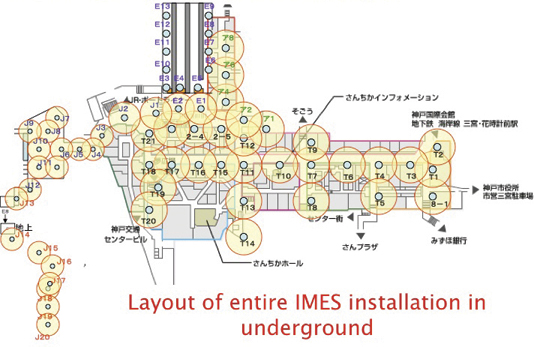
    The Free Mobility Project in Kobe is the biggest social experiment using IMES for seamless navigation under the sponsorship by the Ministry of Land, Infrastructure, Transport, and Tourism. The project was conducted in an underground shopping mall of Kobe railway station. Shopping mall visitors were asked to participate in the navigation using IMES-capable mobile phones. Most visitors could follow the route they had chosen or find the destination point using the IMES set-up.

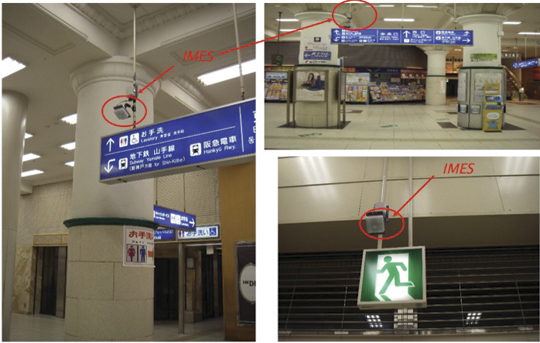
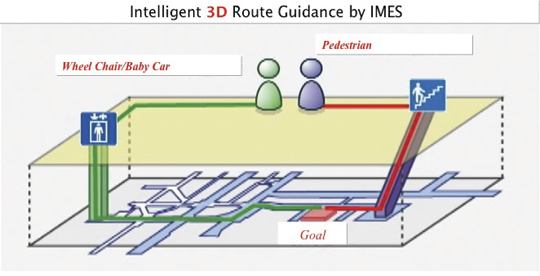
    A total of 70 IMES transmitter units were installed at locations including ticket counters, elevator entrances, emergency exits, fire-extinguisher locations, staircases, station entrances, and alleys of the shopping mall. Figure 15 shows a part of the IMES transmitter location map. It covers one of the sections of the shopping mall. Figure 16 shows various locations where IMES transmitter devices were installed. As shown in Figure 17, intelligent 3D route guidance can be performed based on user preference. For example, a user in a wheelchair must be guided by a route that has no staircases, shown by green route in the figure, to reach the destination. A pedestrian can be guided by red route, which is the most direct route to the destination.

    Figure 15. IMES transmitter location map to cover the underground shopping mall in Kobe Station. Source: Dinesh Manandhar and Hideyuki Torimoto, GNSS Technologies, Inc. Japan
    Figure 15. IMES transmitter location map to cover the underground shopping mall in Kobe Station.
    Figure 16. Installation of IMES near the station entrance and emergency exit. Source: Dinesh Manandhar and Hideyuki Torimoto, GNSS Technologies, Inc. Japan
    Figure 16. Installation of IMES near the station entrance and emergency exit.

     Figure 17. Intelligent 3D route guidance using IMES. Source: Dinesh Manandhar and Hideyuki Torimoto, GNSS Technologies, Inc. Japan
    Figure 17. Intelligent 3D route guidance using IMES.
    Figure 18. Seamless navigation by mobile phone using GPS and IMES. Source: Dinesh Manandhar and Hideyuki Torimoto, GNSS Technologies, Inc. Japan
    Figure 18. Seamless navigation by mobile phone using GPS and IMES.

    The distribution of each IMES transmitter is done in such a way that it covers a radial distance of 10 to 20 meters. The deployment density of IMES depends on the location environment. If an IMES device is located near the entrance, the coverage distance will be around 10 meters to minimize transmitted power. IMES devices in deep indoor locations can cover a radial distance of about 15 to 20 meters.

    Commercially available mobile phones with a firmware update for IMES were used to receive the IMES position data. The phones also included the shopping mall and station map including related databases for various applications.

    Conclusions

    IMES can provide reliable and guaranteed 3D position accuracy, including floor information. IMES signal design is done in such a way that it can use existing as well future GPS/GNSS receivers without any hardware modifications. Necessary implementation, setup, and management tools are also developed to facilitate IMES installation and to minimize the cost so that large-scale global implementation is possible. IMES LSI chips are being developed for large-scale implementation. IMES will also help in developing many other location-based applications and services. IMES evaluation kits will soon be available for joint R&D projects.

    IMES technology-related patents have been filed in Japan and many other countries. The basic patents have already been approved in Japan. GNSS Technologies invites academic institutions to participate in joint R&D projects.


    Dinesh Manandhar is a visiting researcher at the University of Tokyo, where he received his Ph. D, and a senior researcher at GNSS Technologies Inc. He is one of the designers of IMES message structure and involved in developing indoor navigation system based on IMES for seamless navigation environment. He can be reached at [email protected].

    Hideyuki Torimoto is the president of GNSS Technologies Inc. Japan. He established Trimble Navigation Japan and Weathernews Inc. in 1986. He also established the Research Forum on Social Infrastructure for Advanced Positioning (NPO) in 2003 and the Satellite Technology Laboratory in Tokyo University of Marine Science in 2004. He served as Satellite Division Member of ION for 2003-04. He can be reached at torimoto @ gnss.co.jp.

  • GNSS Receiver Evaluation

    Record-and-Playback Test Methods

    This article addresses how best to quantify “which navigation system performs best” in a realistic testing scenario. The methodology focuses on land vehicles navigating in urban environments, but applies equally well to pedestrian navigation and can be adapted for testing assisted-GNSS implementations. During a drive test, the truth-reference system and RF recording system log samples to disk, with no need for the receivers under test to be included during the actual drive. 

    By Eric Vinande, Brian Weinstein, Tianxing Chu, and Dennis Akos, University of Colorado, Boulder

    FIGURE 1. Traditional in-vehicle receiver testing.
    FIGURE 1. Traditional in-vehicle receiver testing.

    Radio frequency record-and-playback systems (RPS) have recently become commercially available. These systems sample the RF environment and store it to disk during a drive test and can replay it through receivers back in the lab environment. Here we explore the improvements in dynamic testing methodology created by these units.

    RPS test system installation.
    RPS test system installation.

    RPS constitute a stark contrast to more traditional signal simulators that use pre-defined trajectories and mathematical models to determine appropriate RF output. Signal simulators attempt to reproduce environmental error factors such as multipath, inertial aiding system errors, and building and vehicle obstructions. They rely on mathematical models to simulate these various error sources. In some cases they do a reasonable job of reproducing these errors, but the dynamic urban environment is so complex (for example, rapidly varying/fading signal strength(s), multiple multipath signals, short/long duration obstructions of multiple layers) that even a sophisticated mathematical model can not replicate all effects completely. Some simulators include software that enables the user to define a trajectory and a limited amount of urban scenario details. Again, only so much realism can be created in a simulation environment. Existing testing standards are simulator-based, and as such, are circumscribed by the signal simulator limitations in representing a dynamic environment.

    Positioning performance of a satellite navigation receiver under test (RUT) is coupled with its RF front-end system and local oscillator quality. Because of the variation in RF components between RUTs, some likely have superior RF interference (RFI) immunity. RFI can be a serious issue in certain land vehicles due to on-board electrical systems or because of external interference sources.

    This article describes a testing method applicable to all receiver types, and complementary to that described in the December 2009 GPS World article by Mitelman and colleagues, “Testing Software Receivers,” regarding validation testing within a production environment. Added elements include taking into account truth-system uncertainty and a repeatability verification of the RF playback process through non-deterministic hardware receivers.

    We present here the dynamic testing approach currently used at the University of Colorado in Boulder for receiver evaluation and comparison in the urban environment. The approach also includes the ability to assess the effect of sensor augmentations (for example, inertial, environmental) on positioning performance.

    Truth Reference. Comparison with a truth reference system is essential for evaluation of satellite navigation receivers. For dynamic testing, this typically includes a survey-grade receiver coupled with a tactical-grade (or better) inertial measurement unit (IMU) and associated carrier-phase differential post-processing software. This software is filter-based and provides a positioning-error estimate in various components. Truth reference systems provide a continuous position estimate whose quality can vary depending on factors experienced in the urban environment, including length of full/partial satellite signal outage. In this study, we subtracted the 99th-percentile horizontal positioning error estimate of the truth system from the nominal RUT positioning error at each reporting epoch, as shown in Figure 2.

    If the RUT position happens to lie within the truth-system position uncertainty, it is not considered to have any position error.

    We focus here on a method to evaluate and compare mass-market, consumer-grade receivers to survey-grade receivers. One difference between these two receiver types is the way they handle the trade-off between accuracy and availability. Consumer receivers strive to provide the user with the highest availability, whereas survey receivers’ goal is to maximize accuracy. As a result, consumer-grade receivers will produce more regular position updates in harsh signal-tracking conditions, but must sacrifice accuracy to do so.

    FIGURE 2. RUT position error calculation
    FIGURE 2. RUT position error calculation

    Current Testing Standards

    Currently accepted A-GPS standards such as those used by the 3rd Generation Partnership Project (3GPP) provide very limited dynamic testing in simulated urban conditions, being mainly designed to evaluate the first position calculation achieved in a particular simulated scenario. High-sensitivity receivers that pass or greatly exceed the 3GPP tests, in our opinion, are not guaranteed to have superior navigation performance in urban areas. Also, local oscillator performance is not specified. The trajectory dynamics imposed can actually be much smaller than the clock dynamics of a very low-cost local oscillator. A GPS receiver cannot tell the difference between the two and must track the effective Doppler variation.

    The 3GPP defines five independent tests for A-GPS receiver certification. They include tests in the areas of: sensitivity with coarse/fine time assistance, nominal accuracy, dynamic range, multipath performance, and moving scenario/periodic update performance. The last three tests include elements that ostensibly pertain to the urban environment. These tests specify discrete, constant signal power levels for implementation in a hardware signal simulator. The discrepancy between the 3GPP-prescribed signal levels and those observed during actual drive testing is detailed as follows.

    The 3GPP moving scenario/periodic update performance test trajectory is shown in Figure 3.

    FIGURE 3. 3GPP dynamic testing trajectory (van Diggelen, A-GPS: Assisted GPS, GNSS, and SBAS, Artech House)
    FIGURE 3. 3GPP dynamic testing
    trajectory (van Diggelen, A-GPS: Assisted
    GPS, GNSS, and SBAS, Artech House)

    This test profile calls for the simulation of five satellites with a constant signal strength of 2130 dBm while the vehicle travels around the racetrack trajectory. In contrast, during an actual drive test in an urban area, a receiver reported the distribution of carrier-to-noise-density values for all tracked satellites as shown in Figure 4. This more accurately shows the range of signal strengths that should be expected in urban conditions.

    FIGURE 4. Drive-test C/N0 distribution
    FIGURE 4. Drive-test C/N0 distribution

    The 3GPP moving test is considered passed if positions are reported regularly, and 95 percent of them are within 100 meters of the true position. This is not a particularly difficult test for a RUT to retain signal lock through, as the linear acceleration is about 0.15 g and the centripetal acceleration is about 0.25 g.

    It is difficult for independent third parties to carry out a receiver evaluation following 3GPP guidelines as several of the tests require receiver restarts, which in turn requires testing automation. Depending on the receiver-evaluation hardware availability, restart commands may not be available to to an independent evaluator.

    3GPP receiver testing results are quoted as pass or fail over a large number of short evaluations. For the dynamic environment, the system performance over continuous time is required to make a proper comparison between evaluated receivers.

    In general, evaluating the GPS engines embedded within cell phones or other devices is difficult. Most are not made to interface with an external antenna, and the mere act of adding an antenna connection can significantly alter performance. The output format is not always documented, if it is even available to an end user. To allow fair across-the-board comparisons, GPS chipset manufacturers should make available development kits that have external antenna connections and well-documented message output formats.

    Drive-Test Configuration

    Current live dynamic testing requires multiple systems to be operating in a moving vehicle (see opening Figure 1). A truth-reference system, usually a high-grade GPS/INS device along with post-processing, provides the basis to which all other RUT are compared. This system requires a dedicated vehicle rooftop antenna with the best possible sky view, separate from a lower-grade test antenna located within the vehicle. Each RUT is connected to the representative consumer-grade antenna located in the vehicle through a high-isolation splitter that suppresses inter-receiver interference. It is important at this point that the gain be set appropriately for each RUT, depending on the front-end expectations while maintaining an equivalent noise figure across all receivers.

    Visualization Methods

    In addition to quantitative methods, we have created a qualitative visualization to assist with interpretation of the raw data. The same parsed data sets that provide the statistical script input are fed into a viewer script along with the post-processed truth reference data. With the truth-reference system data plotted in the center of the screen, each RUT is then plotted the correct distance and direction away, based on the distance and direction of error compared to truth. The receiver plots are overlaid onto Google Earth images centered on the truth-reference location. Plots of number of satellites utilized (top right of Figure 5) and elevation (middle right) as reported by each receiver and the sampled RF spectrum (lower right) are also included.

    For each reporting epoch, based on the data frequency of the truth-reference system, a frame is generated with the aforementioned characteristics. These frames are gathered and encoded into a movie clip which can then be used as a quick and simple qualitative tool for receiver comparison. Figure 5 shows an individual movie frame. A forward-looking camera capability is also being added to this movie so the test environment can be documented from multiple angles.

    FIGURE 5. Movie visualization screenshot
    FIGURE 5. Movie visualization screenshot

    While observing this movie, variations in the sampled RF spectrum from interference or blockages can be associated with the current landscape. Locations of RFI sources can be identified and avoided (or included) in future testing. These RFI and significant blockage locations are of interest for receiver RF component and navigation filter development. The next three figures show spectrum snapshots during various parts of a drive test. In Figure 6, the cumulative GPS spectra rises above the noise floor and is visible during open sky conditions. While below ground level, Figure 7 shows only the front-end filter shape (and relatively minor RFI). Figure 8 shows an example of severe RFI when near a specific parking garage location.

    FIGURE 6. Open-sky spectrum (centered on 1575.42 MHz)
    FIGURE 6. Open-sky spectrum (centered
    on 1575.42 MHz)
    FIGURE 7. Spectrum while below ground level (centered on 1575.42 MHz).
    FIGURE 7. Spectrum while below ground
    level (centered on 1575.42 MHz).

    FIGURE 8. Spectrum near interference source (centered on 1575.42 MHz).
    FIGURE 8. Spectrum near interference
    source (centered on 1575.42 MHz).

    Record/Playback Concept

    To overcome the limitations of hardware signal simulators and repeated vehicle drive testing, the RF record/playback testing method is utilized at the university. Commercially available equipment, capable of recording and playing back an RF signal, has recently become available. Equipment options exist for between $10,000–100,000, with 1–16 bit sampling and 4–25 MHz front-end bandwidth.

    Figures 9 and 10 show the concept of “record once, playback many times.” During a drive test, the truth-reference system and RF recording system log samples to disk. There is no need for the RUT to be included during the actual drive test.

    FIGURE 9. Recording mode block diagram.
    FIGURE 9. Recording mode block diagram.
    FIGURE 10. Playback mode block diagram
    FIGURE 10. Playback
    mode block diagram

    In the laboratory, the logged RF samples are replayed through a splitter to all RUT. The effect of receiver configuration changes can be evaluated without having to repeat the drive test. At a later time, additional receivers can also be tested using the same stored RF sample file.

    During separate record and playback phases, testing considerations and methods discussed previously are implemented.

    Since the recording process can only obviously capture current conditions, additional drive-test collections are required if different satellite geometry is desired, or if additional representative antennas need to be evaluated.

    Repeatability of RPS Testing

    To validate that the playback signal levels were not significantly different from live signals, we conducted an urban, dynamic evaluation. Figure 11 shows that there is typically not more than a 1 dB difference in reported C/N0 between live and playback modes when testing a receiver that only reported integer values. The two dropout instances were excursions into parking garages.

    FIGURE 11. Live and playback C/N0 values
    FIGURE 11. Live and playback C/N0 values

    Figure 12 compares the navigation statistics between replays, using the same five playbacks as in Figure 11. The playbacks show a 1-sigma horizontal position solution spread under 1 meter for approximately 83 percent of the test.

    FIGURE 12. Playback Horizontal Position Error Spread.
    FIGURE 12. Playback Horizontal Position Error Spread.

    These two figures verify the repeatability of the RPS testing method and solidify it as an alternative to both signal-simulator testing and live testing of satellite navigation receivers.

    Denver Testing Method

    To evaluate the RPS concept, we conducted tests in three locations: Boulder, Denver, and Interstate Highway 70, all in Colorado. The Boulder and Denver locations were urban collections, while the Interstate 70 location was a natural canyon with significant elevation change. The collection at each location was repeated with two different representative antennas (patch and cell phone) at nearly the same sidereal time in order to keep the overhead satellite constellation similar.

    We examine here the November 11 and 16 Denver tests. The November 11 test used a patch antenna that places nearly all its gain in the upward direction, making it more immune to interfering sources below and to its sides. Figure 13 shows the patch antenn
    a location on the van, as well as the truth-system antenna location utilized for testing on both days.

    FIGURE 13. Patch antenna (dashboard) and truth-system antenna (rooftop) locations.
    FIGURE 13. Patch antenna (dashboard) and
    truth-system antenna (rooftop) locations.

    The November 16 test used a cell-phone GPS antenna that does not have a preferential gain direction, making it more susceptible to interfering sources below and to its sides. This antenna type is representative of the typical low-cost antenna (in some cases as simple as a piece of wire) found in consumer cell phones. Figure 14 shows the cell-phone antenna suction-cup mounted to the front window of the testing van. The representative antenna mounting location was chosen to minimize locally-generated RFI effects while also being representative of a typical vehicle-use case.

    FIGURE 14. Cell-phone antenna location.
    FIGURE 14. Cell-phone antenna location.

    The required equipment and connections are minimal when performing RPS drive testing, as no RUTs are included. The inset to Figure 1 at the beginning of this article shows the RPS unit in the rear of the van, mounted on layers of foam to reduce vibration, which, if not properly addressed, can cause errors in mechanical hard drives writing data at high rates. Also visible are the truth receiver on the center of the van floor, and the car batteries for powering it and the IMU. The IMU is mounted to the vehicle frame and is not shown.

    The test drive trajectory through Denver on November 11 and 16 as reported by the truth system is shown in black in Figure 15 and is also repeated in Figures 16 and 17. The test lasted approximately 40 minutes on both days. It started in the upper left part of Figure 15 and continued zig-zagging through downtown to the lower right.

    FIGURE 15. Truth trajectory for November 11 and 16 tests.
    FIGURE 15. Truth trajectory for November 11 and 16 tests.

    Figures 16 and 17 show particularly difficult blocks for the four receivers tested under the replay method. These receivers are denoted A (green), B (blue), C (red), and D (yellow).

    FIGURE 16. Difficult block #1 during November 11 test and truth system antenna (rooftop) locations.
    FIGURE 16. Difficult block #1 during November 11 test and truth
    system antenna (rooftop) locations.

    The horizontal positioning error statistics for two receivers on the November 11 test are shown in Figures 18 and 19. The left side shows horizontal error in two different zoom levels. The right side shows a histogram and cumulative distribution of errors, and several reporting metrics over the entire test. Even though receiver A in general outperformed receiver B, from the error time histories there are noticeable periods where both receivers simultaneously had positioning difficulties.

    FIGURE 17. Difficult block #2 during November 11 test.
    FIGURE 17. Difficult block #2 during November 11 test.

    Table 1 summarizes the horizontal positioning statistics for all receivers during both tests. Positioning accuracy was severely degraded when replaying samples collected with the cell-phone antenna as compared to the patch antenna. Receiver A was the most accurate across both tests, while receiver B was the least accurate. The uncertainty of the truth system was subtracted out when producing the horizontal positioning results for all receivers.

    Table 1
    Table 1

    Conclusions

    The record-and-playback system testing approach, in our opinion, represents the best way to test hardware receivers. It overcomes the fidelity limits of simulator-based testing, especially when considering the difficult-to-model urban environment. During receiver development, it requires only a single drive test for each location, as sampled RF data can be replayed from disk.

    FIGURE 18. Receiver A horizontal positioning error statistics (November 11 test).
    FIGURE 18. Receiver A horizontal positioning error statistics (November 11 test).
    FIGURE 19. Receiver B horizontal positioning error statistics (November 11 test).
    FIGURE 19. Receiver B horizontal positioning error statistics (November 11 test).

    Having demonstrated that RPS testing is repeatable, we have produced a library of RF sample files representing real-world conditions for continued receiver development and testing purposes.

    • Eric Vinande is Ph.D. student at the University of Colorado studying GPS/MEMS inertial sensor integration and urban RFI aspects.
    • Brian Weinstein is a BSEE student participating in the Undergraduate Research Opportunity Program for GNSS receiver testing at the University of Colorado.
    • Tianxing Chu is a visiting researcher at the University of Colorado from Peking University where he is a Ph.D. student.
    • Dennis Akos is an associate professor within the Aerospace Engineering Sciences Department at the University of Colorado with concurrent appointments at Stanford University and Luleå University of Technology.

    Manufacturers

    Development of the methodology described here used two different RPS systems, one from LabSat (RaceLogic) and one from Averna. The test data come from the Averna system.