In recent years, scientists have shown that detecting changes in navigation signals from GPS and Galileo after they bounce off Earth’s surface (GNSS reflectometry, or GNSS-R) can deliver valuable information on sea ice. Now research drawing on data from Spire Global has enabled the generation of Arctic-wide sea ice maps, marking a major step forward for the emerging technique.
Spire Global‘s sea ice freeboard maps use data captured by Spire’s GNSS-reflectometry multipurpose listening constellation.
The research — enabled by the Third Party Missions (TPM) programme of the European Space Agency (ESA) — suggests that harnessing reflected navigation signals could become an important complement to established ice-monitoring altimetry missions.
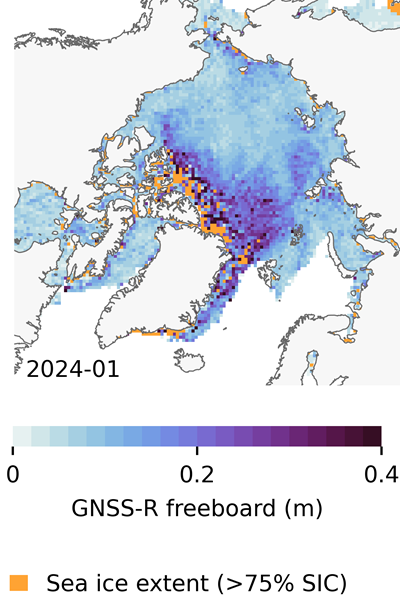
The study leveraged Spire’s GNSS-R data to retrieve sea ice freeboard measurements across an entire winter season. The results show strong alignment with established altimetry datasets, including the ESA’s CryoSat mission, validating the complementary role of commercial satellite data alongside government missions.
Arctic-wide sea ice freeboard map for January 2024. (Credit: ESA)
The study was led by Felix Müller at the Technical University of Munich (DGFI-TUM) and Robert Ricker at the Norwegian Research Centre, experts in GNSS-R.
“The primary purpose of signals emitted from GNSS is to fix the location of a device at any point on Earth,” Müller explained. “However, when these signals bounce off Earth’s surface, their properties change. By analyzing these changes, we can infer information about the characteristics of Earth’s surface.”
“Previous research has shown that this technique works well experimentally,” Ricker added. “Using the Spire constellation, we aimed to demonstrate whether it would hold up on a larger scale by generating an Arctic-wide map of sea ice freeboard, which is a measure of how far ice protrudes above the waterline.”
Spire’s GNSS-R constellation
Spire’s constellation was first used to sample the atmosphere for weather forecasting. Then scientists began exploring other applications. Spire started collecting reflected signals arriving at shallow angles using a technique called grazing-angle GNSS-R. This method is particularly well suited for ice monitoring.
The research team analyzed data detected over the Arctic Ocean and surrounding seas between October 2023 and July 2024. The data was obtained via the TPM program, through which ESA disseminates data from a range of commercial and institutional partners on a free basis for research and development purposes.
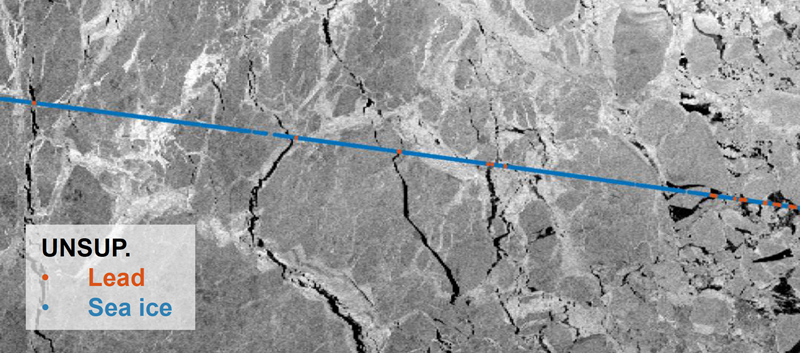
The team focused on one of the most critical challenges in sea ice altimetry: reliably identifying narrow openings in the ice pack, known as leads. These openings are reference points for determining sea surface height and, ultimately, sea ice freeboard.
In turn, sea ice freeboard can be used to infer sea ice thickness — an essential parameter for tracking climate change, estimating sea level, and modeling ocean and weather patterns.
Identifying leads in sea ice with GNSS-R data. (Credit: ESA)
Classifying surface properties
“In the initial phase of the project, we used two complementary methods to identify surface properties based on GNSS-R data, with the aim of identifying leads,” Müller said.
The first — known as the adaptive threshold technique — involved measuring the power of the reflected navigation signal to classify surface type as either water or ice. This method allows rapid processing of the entire GNSS-R dataset, while remaining robust to changes in signal conditions.
The second method — known as unsupervised clustering — offers a more complex approach to classifying surface conditions. In addition to signal power, it considers multiple other signal features that tease out more nuanced information on surface type, including identifying thin or refrozen ice.
Both methods were compared with co-located CryoSat surface-type classifications and Sentinel-1 imagery, confirming that the GNSS-R classifications were largely comparable against conventional satellite products.
Mapping sea ice freeboard
“Building on this classification work, we then took the research to the next step by producing Arctic-wide sea ice freeboard maps from GNSS-R data,” Ricker said.
The team corrected ice surface height measurements generated from GNSS-R data for tidal variations, sea surface height, and atmospheric delays, which is standard practice in altimetry. A refined algorithm then identified where leads in the ice were likely to occur, with the lowest points in these areas revealing estimated sea surface height. Sea surface height estimates were then subtracted from ice surface heights to retrieve freeboard. Using this approach, monthly gridded freeboard products were generated for the full winter season.
The team reported that the GNSS-R datasets showed strong agreement with CryoSat freeboard datasets across much of the Arctic, confirming that GNSS-R can reproduce large-scale patterns previously observed by dedicated altimetry missions. Independent validation against upward-looking sonar measurements in the Beaufort Sea further supported the accuracy of the retrieved freeboard values.
However, as expected, the GNSS-R estimates became less reliable during spring, when surface melt alters reflection characteristics. This limitation is consistent with earlier GNSS-R and radar altimetry studies and remains an active area of research.
The contribution of commercial data
While GNSS signals have long been used for positioning, this research highlights how reflected signal analysis can extend their value into large-scale Earth observation applications, delivering persistent coverage independent of sunlight or weather conditions, said Theresa Condor, Spire Global CEO.
“Advances in miniaturization, digital signal processing, and machine learning have fundamentally changed what’s possible in RF sensing,” Condor said. “Commercial constellations can now deliver persistent, high-quality RF data that complements traditional government systems with greater flexibility and cost efficiency.
“As environmental monitoring requirements intensify, we’re seeing agencies increasingly integrate commercially sourced RF datasets into operational architectures, reflecting the continued maturation of this market and the growing role of commercial infrastructure in government missions.”
“By producing analysis-ready gridded datasets, this work marks an important milestone in the progress of grazing angle GNSS-R from an experimental method to a reliable technique for mapping Arctic sea ice freeboard at scale,” said Matthieu Talpe, Remote Sensing Product Engineer, Spire Global. “In doing so, it strengthens the case for the grazing angle GNSS-R technique employed by the Spire constellation as a valuable complement to existing ESA and partner missions, helping to close observational gaps in one of Earth’s most rapidly changing regions.”
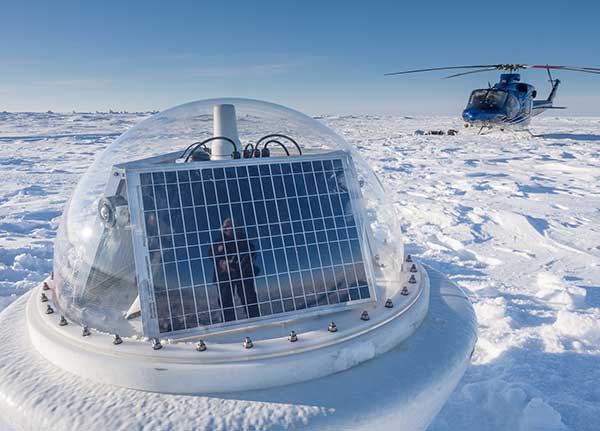
GNSS and inertial navigation sensors are meeting the challenges of extreme conditions, from freezing Arctic ice to the edges of steaming volcanoes, from high-speed aircraft over cities to the subways under them. Even beyond, into deep space.
IN THE ARCTIC
Wave Buoys Help Study Arctic Climate Change
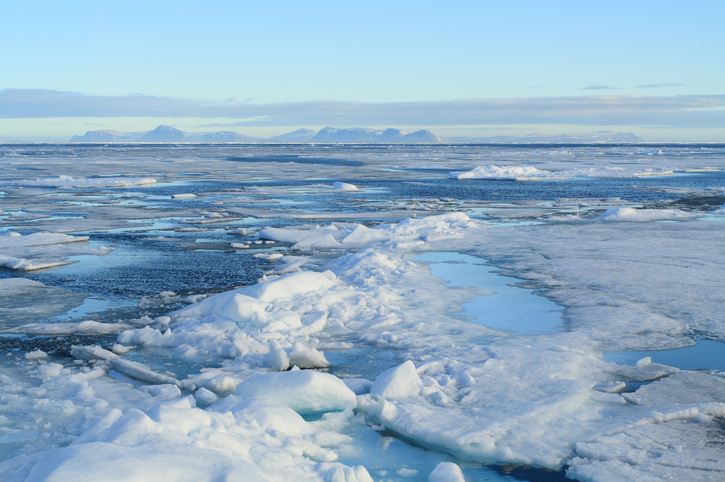
Where the edge of Arctic ice transitions to open water, towering seas are smashing sea ice into melting pieces, with far-flung effects on climate and nature. Over recent decades, the Arctic has warmed more than any other region, leading to a significant reduction in sea ice volume. The combination of increased ice-free area and more mobile ice cover has led to the emergence of a seasonal marginal ice zone (MIZ) in the Beaufort Sea, north of Prudhoe Bay, Alaska.
The United States Office of Naval Research conducted a five-year study of the MIZ, which included intense field work in the freezing Arctic sea. Here, the ice is vulnerable to ocean surface waves that form in the open water, resulting from strong winds and frequent storms. Also studied were in-ice waves, where ice and water clash. The goal was to understand how both factors impact the ice floe melting.
The MIZ lies in the subarctic seas in winter and transitions into the interior of the Arctic Basin in summer. To investigate the MIZ’s dynamics, ONR engaged an international program of observations and simulations using several autonomous systems, including wave buoys. The wave buoys — officially designated the autonomous ocean flux buoys — integrate SBG Systems’ miniature inertial sensors.
The MIZ study comprised an international team of scientists from more than a dozen organizations.
Buoys for All Seasons. The program included 20 buoys deployed in the summer, and five in the winter, to quantify open ocean and in-ice wave characteristics and evolution. “We needed a very rapid and cost-effective solution to measuring directional wave spectra in the ocean,” said Martin Doble, oceanographer at the French UPMC School and member of the research program. “Time to deployment was very short, so an integrated solution, giving us good heave numbers straight out of the box, was essential. Delivery time of the units was also critical.”
Drilled into the ice, the summer buoys were powered with solar panels and equipped with SBG Systems’ IG-500A miniature attitude and heading reference system to detect both distant and near-wave effects on the local ice floe. Once the ice melted, the summer buoys continued to measure open ocean characteristics.
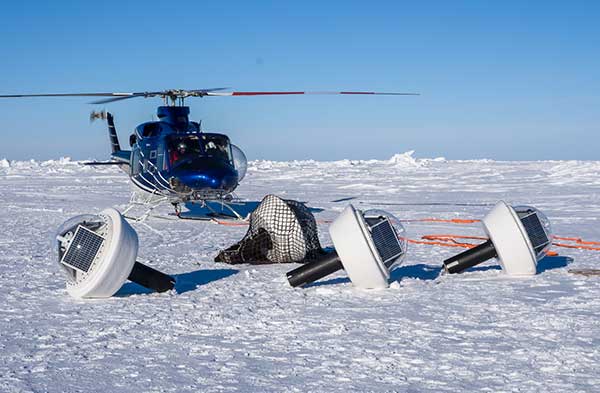
Five winter buoys were installed on the ice. These buoys were made of aluminum for better resistance and contained enough battery power to keep them going through the dark winter months. Every buoy also contained processing and control electronics, an SD card, a GPS receiver and an Iridium satellite modem and antennas to transmit the recorded data to its base station. Both summer and winter data from the buoys were used to quantify the wave attenuation rate.
Winter buoy installed on an ice floe. (Photo: SBG Systems)
By measuring the waves and ice, the buoys help scientists understand how waves are approaching and breaking up the sea ice. When winter approaches and ice begins to refreeze, the buoys help show how the waves interact with the ice as the temperatures change.
Calibration. The IG-500A inertial sensors were used for wave height and direction. IG-500A measures in real time the roll, pitch, heading (accurate to 0.35°) and heave (accurate to 10 centimeters). Every sensor is calibrated for bias, linearity, gain, misalignment, cross-axis and gyro-g from –40° to +85°C. The calibration is key to enabling the sensors to provide reliable data in the harsh environment.
Doble said the units were reliable, with no failures in the harsh Arctic conditions. They ran continuously for more than a year without requiring power cycling, and “the numbers look good, giving clear results.”
The data is helping researchers understand the physics that control sea ice breakup and melt in and around the ice edge. “We have this amazing picture of the ocean, atmosphere, and ice going from the fully frozen period in March to meltdown and breakup right through to freeze-up,” said Craig Lee of the University of Washington’s Applied Physics Laboratory.
The IG-500A sensors also delivered heave measurement, important for instrumented ocean buoys. During the project, SBG Systems released the Ellipse Series, and the new line replaced the IG-500 series. More accurate in attitude and more reliable (with an IP68 rating) for the same budget, the new miniature inertial sensors now provide a heave measurement that automatically adjusts to the wave period, resulting in higher performance.
Clear differences were measured between surface wave activity outside of the ice, and then moving into the ice, with huge attenuation as the waves enter the ice and die back quickly.
Current Arctic Program. Following the close of the MIZ project in 2015, the ONR launched a new project for 2016–2020, the Stratified Ocean Dynamics in the Arctic (SODA). SODA is also taking place in the Beaufort Sea, and is using the autonomous ocean flux buoys. The buoys are now equipped with SBG’s Ellipse-A sensors.
Why the Arctic Matters
“There’s no question that the Arctic sea ice extent is decreasing,” said Martin Jeffries, program officer for the ONR Arctic and Global Prediction Program. “Multiple sources of data — autonomous underwater gliders, ice-measuring buoys and satellite images of the marginal ice zone — were used to help understand why the ice is retreating.”
The implications for the U.S. Navy, and the world, are significant. If there were no sea ice in the Arctic at the end of summer, that would mean that the Arctic Ocean would, until the winter ice came in, be completely open — something unprecedented in living memory, Jeffries noted.
Naval leaders have made it clear that understanding a changing Arctic is essential for the Navy to be prepared to respond effectively to future needs.
“[T]he opening of the Arctic Ocean has important national security implications as well as significant impacts on the U.S. Navy’s required future capabilities,” said then Chief of Naval Operations Admiral Jonathan Greenert, in his introduction to the U.S. Navy Arctic Roadmap, 2014–2030, published in 2014. “The United States has a history of maritime homeland security and homeland defense concerns in the Arctic Region […] .”
In the period between 2007 and 2014, satellites recorded the eight lowest sea ice levels ever. A key goal of the MIZ and SODA programs is to use the new data collected to make better predictive computer models — ensuring safer operations for not only naval vessels, but also anticipated increased sea traffic by shipping and fishing industries; oil, gas and mining companies; and tourism operations.
Much of the data coming in to Arctic scientists is now from improved sensors, with greater ability to survive the harsh weather and ocean conditions.
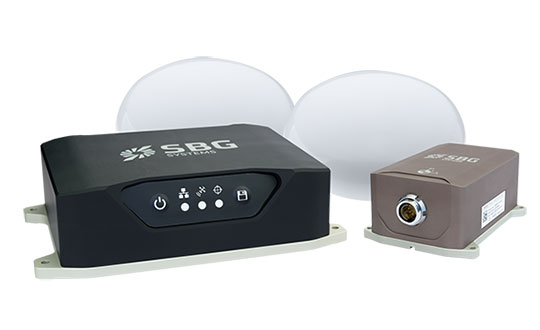
Inside the Ellipse
Alexis Guinamard, chief technology officer of SBG Systems, described to GPS World the company’s most advanced sensor for extreme environments.
“Of course we have more precise sensors like Ekinox, Apogee or even Horizon, for ‘extreme’ precision. But for extreme environments, the more appropriate sensor line is the Ellipse series,” Guinamard said. “There are several key parameters that make them better for this kind of environment.”
Those features include a high-temperature calibration range, from –40°C to +85°C, which enables the sensors to operate at the same performance level in the most extreme temperature environments.
“While typical entry-level or industrial-grade sensors only provide a room temperature or basic temperature calibration, we have developed a calibration procedure used for both survey-grade and industrial-grade sensors using a precision two-axis rotary table with temperature chamber,” Guinamard said. “An advanced thermal modeling minimizes the calibration error over the full temperature range.”
Ellipse-D dual-antenna mini INS/GNSS. (Photo: SBG Systems)
The sensors work in highly dynamic and vibrating environments because their gyros operate well, changing position up to 900° per second. Similarly, their accelerometers can reach up to 40 g, with excellent behavior in vibrating environments. “We can typically install our sensors directly on the chassis of the vehicle, while lower grade sensors may require specific dampers that are complex to design and make it difficult to precisely align the sensor,” Guinamard said.
A GNSS interference-mitigation capability enables the sensors to perform in challenging GNSS environments.
With the Ellipse-D, high latitude operation is possible because it provides a dual-antenna heading that is insensitive to higher latitudes, Guinamard explained.
Saltwater-Proof. SBG Systems sensors typically have waterproof (IP68) enclosures that can deal with harsh conditions and sustain exposure to saltwater for a limited period of time. For long exposure to salt water, the company offers specific titanium enclosures. For instance, its Navsight series has a saltwater-proof inertial measurement unit.
Navsight marine solution. (Photo: SBG Systems)
The Navsight Marine Solution is a motion and navigation solution for hydrographers available as a motion reference unit (MRU), as an inertial navigation solution (INS) with embedded GNSS, and as an INS using a third-party GNSS receiver.
Navsight can be outfitted for demanding shallow- or deep-water environments to survey highly dense areas (bridges and buildings), as well as applications where only a single antenna can be used.
With the addition of the Horizon inertial measurement unit (IMU) to the Navsight line in January, which joined the Ekinox and Apogee IMUs, the line is suitable for large hydrographic vessels surveying harsh environments. The Horizon IMU is based on a closed-loop fiber-optic gyro (FOG) technology that enables ultra-low bias and noise levels, allowing robust and consistent performance.
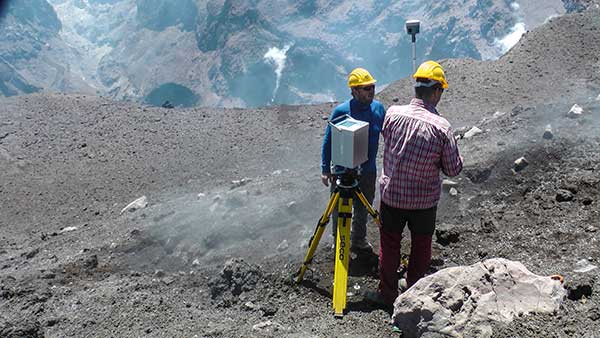
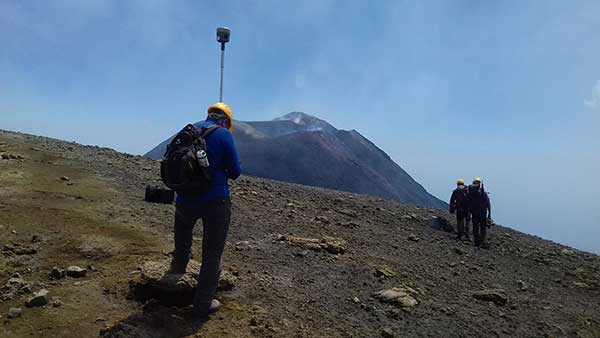
Dust, noxious gas and loose rock near the summit makes volcanic surveying especially challenging. (Photo: Trimble)
AT VOLCANO’S EDGE
GNSS Tracks Magma on Mount Etna
Scientists seeking to better understand volcanoes are using GNSS to investigate one of the most active in the world.
Mount Etna, in eastern Sicily, Italy, has been erupting for hundreds of thousands of years. The constant activity makes it a popular tourist attraction — smoke often billows from the mountain and fiery lava spews down its sides.
Researchers flock to Mount Etna, too, to study the movement of magma — the hot fluid beneath the Earth’s surface from which rocks are formed when cooled.
To measure the vertical gradients of gravity on Mount Etna’s slopes and summit craters, geophysicists from Slovakia and Italy teamed up on a field campaign during which they used high-accuracy GNSS positioning with emphasis on accurate height measurements to collect gravimetry and topographic information.
The extreme environment and spotty cellular coverage on Mount Etna made using GNSS with real-time kinematic (RTK) or virtual reference station (VRS) a challenge. The geophysicists used the Trimble CenterPoint RTX correction service and Trimble R10 GNSS receivers to ensure reliable GNSS performance.
“On many points, especially the higher part of the volcano, Internet signals were poor or [there were] none at all,” said Juraj Papčo, a geodesist with the Earth Science Institute of the Slovak Academy of Sciences. “Only by using RTX were we able to collect real-time data. It performed well in higher elevations and difficult conditions.”
The project teams also used Trimble RTX to navigate to locations where they needed measurements. At each station, they collected static and real-time positions and later compared post-processed results with the real-time positions.
Dust, noxious gas and loose rock made approaching the summit especially challenging. Trimble RTX helped the Slovak-Italian team of geophysicists better understand volcanoes and anticipate volcanic events.
Researchers used high-accuracy GNSS positioning to collect gravimetry and topographic information. (Photo: Trimble)
Prisms affixed to the track enable measurement of change and structural movement. (Photo: Topcon)
UNDER A METROPOLIS
Harsh Construction Environment Monitored
Deep beneath Paris, work is underway to expand the Metro, the city’s rapid transit system. The Grand Paris Express project encompasses a 200-kilometer-long network of railway lines — mostly underground — that will link the suburbs to the city.
The contractor responsible for monitoring construction of the first stage of the project’s infrastructure, Cementys, is using more than 100 instruments from Topcon’s MS series of robotic total stations because they can withstand the harsh construction environment.
Monitoring structural movement across the network is critical; the goal is to protect the surrounding Parisian structures and the people who live and work in them. Use of the monitors also ensures that the expensive equipment used on the project is not stolen.
Topcon’s MS Series robotic total stations continuously measure the angles and distances of prisms fixed to structures. As a result, site engineers know immediately when measurement change and structural movement occurs. The technology also includes Matrix Detection software to help increase the measurement system’s speed and accuracy. The company’s TSshield integrated security software, standard on all its total stations, provides remote locking and location positioning data to within 100 meters, depending on GPS and cellular coverage.
“We have been able to integrate this open technology perfectly into our global data management system, which also includes optical fibers sensors, vibrating wire sensors, and others,” said Cementys CEO Vincent Lamour.
Construction of the Grand Paris Express project is taking places in stages and is expected to be complete in 2030.
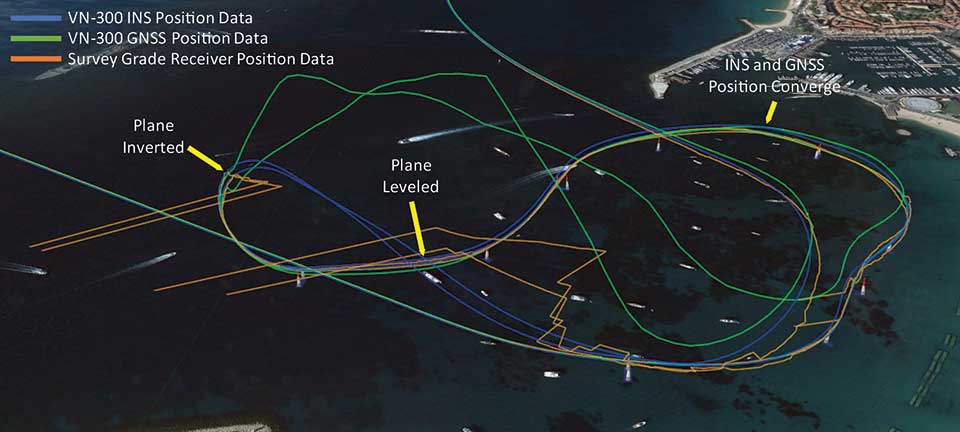
Photo:Position tracks from two laps of the race show that when the plane inverts and starts to track the reflected signal, the VN-300 GNSS/INS (blue trace) reverts to free inertial navigation and propagates the position based on inertial data. The trace follows a smooth trajectory through the next air gate until the GNSS data converges with the INS position. (Image: Google Earth with VectorNav Data)
ABOVE THE SEA
Flying High with Augmented Reality
The 2018 Red Bull Air Race World Championship in Cannes, France, made it easier for fans to follow along. Though pilots race one at a time, the new “Ghost Plane” augmented reality imagery provided fans with a real-time representation of each pilot’s flight, which challenges their speed, precision and skill maneuvering lightweight racing planes.
The Ghost Plane is driven by onboard telemetry data gathered during flight. For a pilot’s run to be accurately represented, the onboard telemetry system has to track position, velocity and attitude (yaw, pitch and roll) through high-dynamic maneuvers and in challenging environmental conditions.
While every Red Bull Air Race track layout is different, they all include a difficult vertical turning maneuver (VTM), where pilots pass through a gate and turn 180 degrees to reverse course quickly without exceeding the g limit.
Each plane is fitted with several GNSS receivers to track the plane, but dynamic maneuvers made during the race rapidly changes which satellites the GNSS receiver can track, which typically results in a loss of position fix.
To further increase the challenge for the telemetry systems, races are commonly held over water, which can reflect GNSS signals and create significant multipath errors at low altitudes. During the VTM, the plane can experience 300°/second angular rates and 12-g accelerations, during which GNSS tracking is typically lost because the antennas no longer point to the sky.
To make the Ghost Planes possible, a VectorNav VN-300 dual-antenna GNSS/INS (inertial navigation system) couples gyroscope and accelerometer data to propagate position and velocity estimates during loss of GNSS measurements through maneuvers such as the VTM.
The VN-300 combines two GNSS receivers with a 9-axis inertial measurement unit (IMU). It couples acceleration and angular rates from the IMU with position and velocity data from the receiver using a quaternion based Extended Kalman Filter (EKF). VectorNav algorithms work in conjunction with the state estimation filter, making the VN-300 more robust and intelligent, and enabling it to reject poor GNSS data and perform accurately in high-dynamic maneuvers and challenging operating conditions.
NEW EQUIPMENT
Antenna Designed for Challenging Environments
CHC Navigation’s latest GNSS antenna is an example of a product designed specifically for harsh environments.
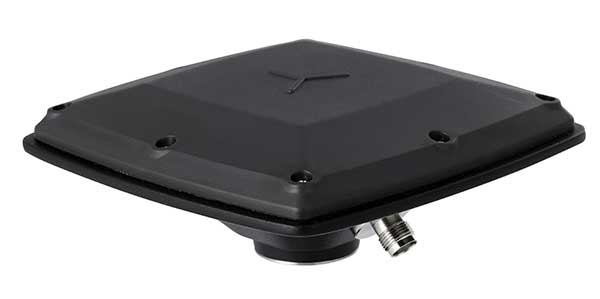
AT311T antenna. (Photo: CHC Navigation)
The heavy-duty CHCNAV AT311T is designed for demanding applications subject to shocks and vibrations. With advanced filtering and robust signal tracking, it provides survey-grade GNSS signals to enhance position reliability for marine applications, machine control, precision agriculture and industrial automation.
Features include multi-constellation GNSS tracking using GPS, GLONASS, BeiDou, Galileo, QZSS, IRNSS and SBAS. Its IP68 water-resistant design makes it safe to use in extreme conditions with a wide temperature range (–40°C to +85°C). Its internal stacked structure enhances performance in high-interference environments, and the 40-dB signal gains, advanced signal filtering and multipath rejection design provide superior and robust GNSS signal tracking in challenging surroundings.
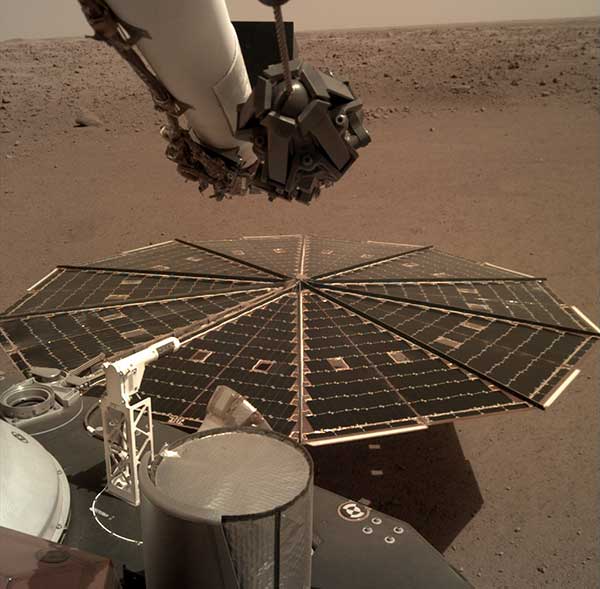
One of the two solar arrays on the InSight lander dominates this view of the plain of Elysium Planum, taken Dec. 4, 2018. (Image: NASA/JPL-Caltech)
IN OUTER SPACE
Exploring Beyond Earth
While GNSS isn’t useful on the surface of Mars, inertial navigation is a key technology for exploration of the red planet. For instance, the Northrop Grumman LN-200S sensor guided the Mars Opportunity rover, which explored Mars for 15 years until a storm struck in June 2018.
The LN 200S sensed acceleration and angular motion, with its data output used by the rover’s control systems for guidance.
The hermetically sealed unit, suitable for planetary and asteroid probes, helped position the rover’s antennae to relay photos and data to satellites. Opportunity beamed back 187,000 raw images, according to NASA.
Because IMUs don’t depend on satellites, they work well for deep space missions, Honeywell explained in a press release.
In November 2018, NASA’s InSight spacecraft landed on Mars to study the interior with a heat probe and listen for marsquakes with a seismometer. Aboard was Honeywell’s Miniature Inertial Measurement Unit (MIMU), an IMU that has been a part of Lockheed Martin’s Mars satellites and landers since 1998.
The MIMU is a three-axis strapdown device specifically designed for the satellite and deep-space-probe market (more than 500 MIMUs have been deployed throughout the solar system). It uses ring laser gyros to help control and stabilize a spacecraft during entry, descent and landing, as well as maintain orbit and payload orientation. The radiation-hardened design supports 15-year missions.
Traditional tide gauges are in contact with the water surface and as a result are susceptible to measurement error and damage during extreme weather. An alternative approach is the use of GNSS reflectometry. We learn how this innovative use of satellite navigation signals works in this month’s Innovation column.
Innovation Insights with Richard Langley
Seawater level is conventionally monitored by tide gauges that measure the vertical distance of the water surface from a point on the ground. As the tide gauges provide seamless and highly accurate measurements, many countries operate a tide-gauge network to monitor sea-level changes and to assess flood risk. For example, the National Oceanic and Atmospheric Administration (NOAA) operates a permanent observing system, the National Water Level Observation Network (NWLON), with more than 400 gauges throughout the United States.
However, some challenges of tide gauges can be identified. Firstly, tide-gauge measurements require direct contact with the water, which causes limitations in installing and maintaining the equipment. The equipment requiring direct sensing is highly vulnerable to coastal hazards, such as coastal flooding and tsunamis, resulting in potential measurement errors or even equipment destruction during severe natural events.
Furthermore, tide gauges require maintenance on a regular basis, which is expensive because it requires the use of divers. This greatly limits the operation of tide gauges, especially in extreme environments such as in the Arctic. Alaska, for example, has significant gaps in its available spatially-varying tidal information. However, in the Arctic, it is also very important to constantly and closely monitor the long- and short-term variation of water levels because this area has a significant impact on global climate and ecosystems. Consequently, more support is needed for sea-level monitoring and coastal mapping in this region.
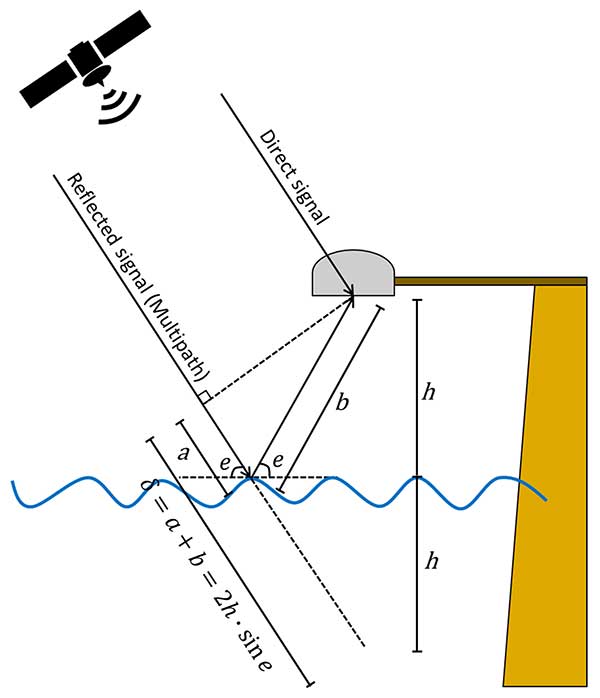
GNSS can serve as an alternative approach for water-level monitoring. GNSS satellites continuously transmit radio signals and ground-based, space-based, and airborne receivers access the signals regardless of weather conditions. Some of the received signals are reflected from obstacles or surfaces near the antenna, a phenomenon referred to as multipath (see FIGURE 1).
FIGURE 1. Schematic drawing of the GNSS-based tide gauge. (Image: Authors)
Multipath tends to be regarded as one of the major error sources for GNSS positioning where it causes unexpected phase delays when compared to the direct signal. Consequently, various procedures have been developed to mitigate the multipath effect. However, the GNSS signals reflected from the Earth’s surface contain information about the geophysical properties of the reflecting surface. The use of these signals is known as GNSS reflectometry (GNSS-R). GNSS-R allows us to monitor the temporal variation of water levels by calculating phase delays of GNSS signals reflected from the water surface. A GNSS-R-based tide gauge does not require direct contact with the water because it measures the water levels based on a remote-sensing technique. Thus, a GNSS-R-based tide gauge can be effectively applied to water-level monitoring.
However, several challenges exist in processing GNSS signals observed at high latitudes compared to mid-latitudes. Not only do we have to contend with extreme weather conditions and limited infrastructure availability, but also with problematic satellite geometry and ionospheric effects on the GNSS signals. To overcome these limitations in the use of GNSS-R in the Arctic, we introduce enhanced algorithms to improve the temporal and spatial resolutions of GNSS-R sea-level measurements.
Our approach includes an enhanced spectrum analysis based on multi-frequency signals and statistical reliability verification. Moreover, we include the signals transmitted by the Galileo constellation in addition to GPS to improve the quantity and the quality of GNSS observations in the Arctic. We have tested the proposed method with an experiment in Alaska and validated the results with nearby tide gauges. The experimental results clearly show the feasibility of employing GNSS-R-based tide gauges in the Arctic.
GNSS-R-BASED WATER-LEVEL MONITORING
Martin-Neria first introduced a method of monitoring sea level using the GNSS-R technique in 1993. Thereafter, many studies have been conducted to apply GNSS-R to water level estimation. Anderson proposed a method to estimate sea level using the interference pattern caused by the direct and reflected GNSS signals, which relies on the fact that the spacing between peaks in the interference pattern is almost entirely dependent on the height of the antenna above the reflecting surface.
The phase difference in the GNSS receiver between the direct and the reflected satellite signals varies while the geometry of a GNSS satellite changes (see Figure 1), generating the interference pattern. The interference pattern is particularly noticeable in signal-to-noise ratio (SNR) data. The reflected signals contribute to the SNR data in the form of oscillations, while the smoothly rising overall arc mostly depends on the signal strength and the antenna gain pattern.
The reflected signals can be isolated from the SNR data by removing the main trend — for example, by polynomial fitting — indicative of the direct signal. The frequency of the remaining dSNR oscillations is constant with respect to the sine of the elevation angle, assuming that the water level does not change during the satellite arc and the reflection surface is horizontal. Consequently, the frequency of the oscillation is linearly proportional to the height of the antenna above the reflecting surface.
The frequency can be derived from the dSNR data by spectral analysis. Among a number of spectral-analysis methods, the Lomb-Scargle periodogram (LSP) is commonly applied since it allows for processing of unevenly sampled data.
Determining the frequency of the oscillations. The antenna height above the water surface is directly calculated from the frequency of the oscillations derived from LSP processing. However, it is difficult to determine the dominant frequency because of the roughness of the water surface, especially in extreme environments such as Arctic regions with high currents and strong winds. In addition, the observed SNR data is easily affected by obstacles near the GNSS antenna. Therefore, it is difficult to distinguish the spectral peak of the signal reflected from the water surface from other additional reflected signals, especially when additional and unexpected reflections occur near the sea surface.
To minimize the erroneous determination of the frequency of the oscillations using dSNR, we can take advantage of the multiple frequencies of modern GNSS signals. In our study, we processed signals from both the GPS and Galileo constellations, with GPS transmitting three carrier signals (L1, L2 and L5) and Galileo transmitting five carrier signals (E1, E5a, E5b, E5ab and E6).
By comparing the spectrum peaks from the multiple signals on different frequencies, one can analyze the dominant peaks across the different frequencies on the same raypath. This algorithm is based on the fact that the multiple frequency signals should detect consistent sea-level heights because they are transmitted along the same raypath during the same period. One of the biggest advantages of this approach is that no additional data or equipment is required to accurately determine the frequency of oscillations of the GNSS signals reflected from the water surface.
Statistical Testing of Retrieved Sea Levels. Reflected signals are not necessarily all from the sea surface. To remove erroneous solutions, we conducted a statistical test. Data including measurement errors and/or some noise can be approximated to the model by the least squares method that determines the model parameters by minimizing the sum of squared residuals. However, this method yields an incorrect result when many outliers deviating from the normal distribution are included in the data set.
This problem can be overcome by applying RANdom SAmple Consensus (RANSAC). RANSAC stochastically estimates the model parameters maximizing consensus, that is, the parameter supported by the largest number of sample data through an iterative process. However, the RANSAC results can act differently each time for the same input data because it is essentially a statistical estimation method using random samples. Therefore, we perform RANSAC with rough constraints primarily to remove outliers significantly out of normal range, then the remaining noise in the data can be excluded by performing secondary fitting using tightly constrained least squares. For the least squares procedure, a series was applied for the fitting model, which represents various motions of the sea surface such as ocean tide loading, as a sum of trigonometric functions.
SEA-LEVEL MONITORING IN ST. MICHAEL
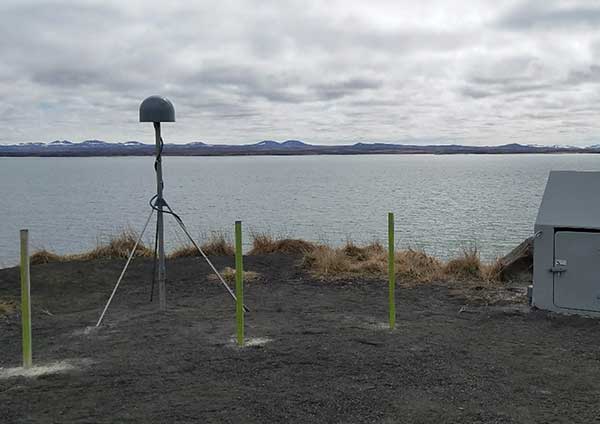
The Plate Boundary Observatory (PBO) network operated by UNAVCO (formerly the University NAVSTAR Consortium) is primarily designed to monitor long-term tectonic and volcanic deformation. However, it can also be used for GNSS-R applications. A new PBO station, AT01, was installed in May 26, 2018, in St. Michael, Alaska, which is designed to be suitable as a GNSS-R-based tide gauge with a clear and wide-open view toward the sea covering from 0° to 230° in azimuth (see FIGURE 2). The equipment at this site consists of a Trimble choke-ring geodetic antenna and a Septentrio PolaRx5 receiver that can receive not only GPS signals but also those of Galileo, with data recorded every 15 seconds.
FIGURE 2. The surrounding area of AT01 in St. Michael, Alaska: south view. (Photo: Authors)
We have used this station to assess our technique using one month of SNR data from June 2018. It should be emphasized that not only GPS but also Galileo signals were processed, and the Center for Orbit Determination in Europe’s Multi-GNSS Experiment final orbit and satellite clock products were used to minimize the satellite orbit error. Additionally, NOAA tide gauge stations (9468132 and 9468333) were used for comparison and verification of the water levels measured from the GNSS-R-based tide gauge (see FIGURE 3).
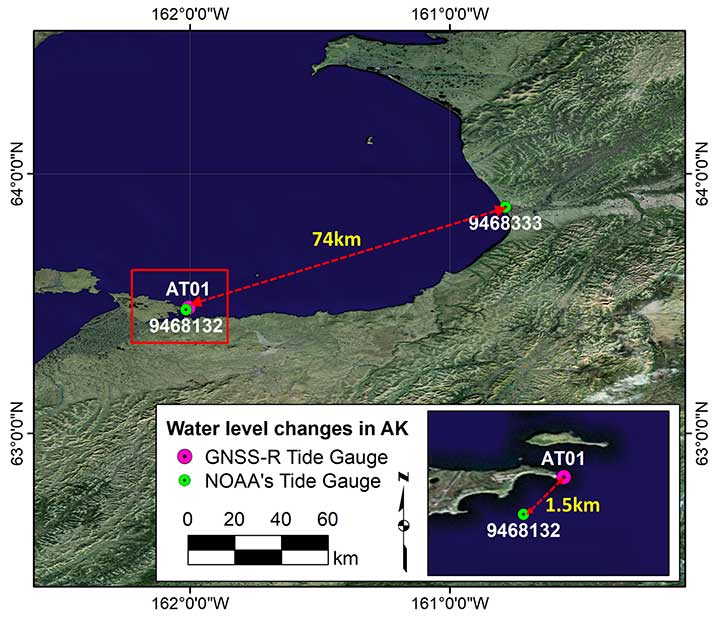
FIGURE 3. Locations of AT01 and two NOAA tide-gauge stations (9468132 in St. Michael and 9468333 in Unalakleet). The red box represents the zoomed area at the bottom right. (Image: Authors)
The 9468132 tide gauge in St. Michael is the nearest tide gauge at approximately 1.5 kilometers from AT01. However, since it is not operational, NOAA only provides water-level predictions (just high and low tides) based on the harmonic constituents, not the actual measurements. On the other hand, the 9468333 tide gauge in Unalakleet is approximately 74 kilometers away from AT01. This makes it difficult to use the tide gauge as ground truth, but it does provide the actual sea-level measurements including any abnormal daily variations during the observation period. Therefore, we used the water-level predictions and measurements from both stations to validate the GNSS-R-based water-level measurements at AT01.
Determination of Water Level. The GPS and Galileo SNR data were independently analyzed using our in-house software package (written in MATLAB) using the following procedures.
As a preprocessing step, each SNR data series was examined to filter out the signals reflected from other surfaces surrounding the antenna and to isolate the signals that were reflected by the sea surface. Since AT01 PBO station was installed to investigate the feasibility of its use as a GNSS-R-based tide gauge, the most effective azimuth and elevation ranges were given, which are 0° to 230° and 10° to 25°, respectively.
The azimuth and elevation angle ranges were applied, which effectively removed reflected signals from surfaces other than the sea surface. After identifying the SNR data affected by the reflection from the sea surface, the processing windows were dynamically determined by the continuous path and direction (ascending and descending) of the satellites, and the height of the sea surface was estimated using only a portion of the satellite arc contained within each processing window.
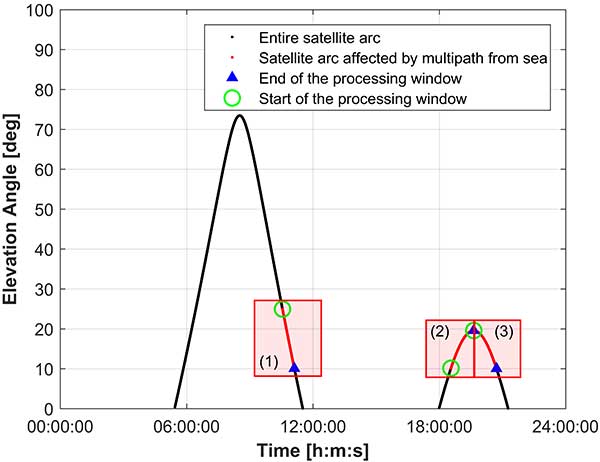
For example, FIGURE 4 shows the processing windows determined for the GPS satellite PRN 1 on June 1, 2018. The red dots in the figure show the parts of the satellite arcs affected by multipath from the sea surface. The data was divided into three processing windows due to the arc discontinuities and satellite path directions. It should be noted that only the processing windows with a data span of 30 minutes or longer were used for water level estimation. This minimum data span duration of 30 minutes was empirically determined by observing the probability of failure of the water -level calculation for shorter spans.
FIGURE 4. An example of the processing window determination for GPS satellite PRN 1 on June 1, 2018. (Image: Authors)
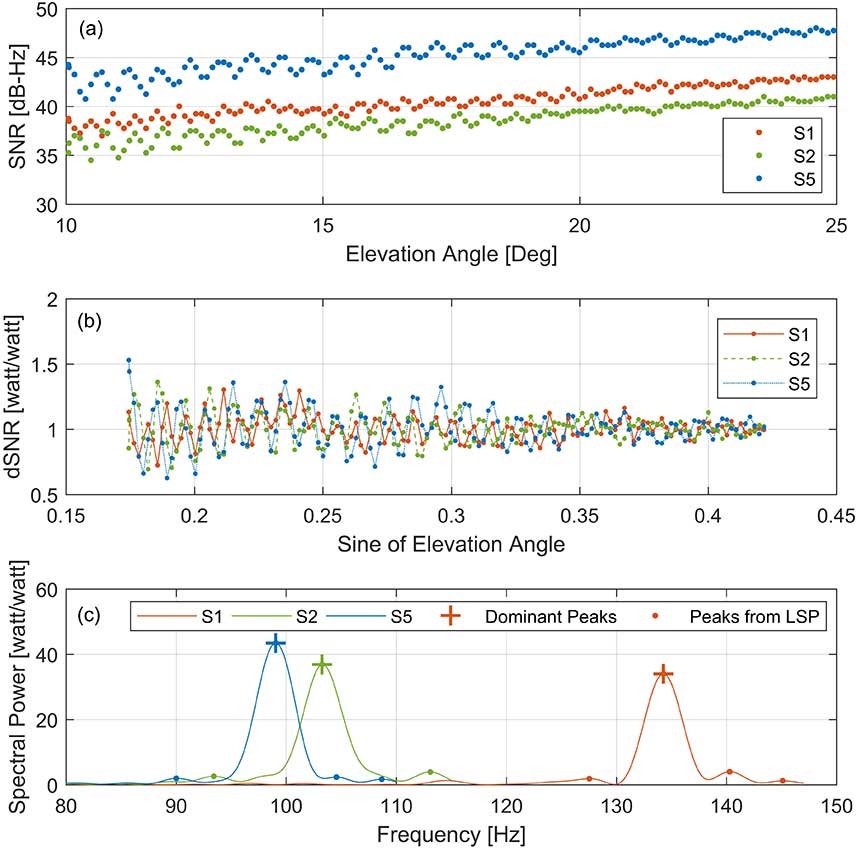
To isolate multipath effects from the SNR observation, we removed the trend in the SNR by a second-order polynomial fitting using only the portion of a satellite arc contained within each window. FIGURE 5 (b) shows the detrended SNR (dSNR) from FIGURE 5 (a), and the impact of the multipath is clearly identified in the form of the oscillation. As discussed earlier, the oscillation frequency is related to the antenna height above the sea surface. Accordingly, the dSNR data was analyzed through an LSP. As shown in FIGURE 5 (c), multiple peaks are founded from the LSP results of each dSNR series, and it is not easy to distinguish the frequency of the reflected signal from the sea level among these peaks.
Since multiple frequency signals from the same satellite must detect the same sea-level height, the final dominant peak was determined by checking the consistency of the resulting heights from each dominant peak among the multi-frequency signals. After that, the dominant frequency was converted to the antenna height above the reflection surface, which was then subtracted from the orthometric height of the antenna (the height above the geoid or, approximately, the height above mean sea level [MSL]) to refer the height of the instantaneous sea surface to MSL.
FIGURE 5. SNR data-analysis procedures with PRN 1 GPS on June 1, 2018: (a) The SNR data affected by the reflection from the sea surface, (b) detrended SNR data through a second-order polynomial, and (c) LSP results and dominant peaks of each frequency. (Image: Authors)
After analyzing all SNR data observed during one day, we carried out the reliability test of the retrieved sea levels to reject erroneous sea-level solutions.
RESULTS AND VALIDATION
The water-level changes from the GNSS-R-based tide gauge at St. Michael were compared to the independently predicted and measured sea levels from the neighboring St. Michael and Unalakleet tide gauges during June 1–30, 2018. Although the tide gauges are considered reliable ground truth, our experimental study must take into account the physical distance between the sites (about 1.5 and 74 kilometers from AT01, respectively) as well as the difference coming from the model versus the actual measurement.
In addition, a vertical offset between the data time series of the GNSS-R-based tide gauge and the standard tide gauges should be considered due to their different datums. Whereas the GNSS-R-derived sea level refers to a geodetic datum — namely the U.S. National Spatial Reference System (NAVD 88) — a standard tide gauge is highly localized with reference to a tidal datum such as local mean sea level. Generally, the difference between the geodetic and tidal datums is provided by NOAA, which allows us to convert between two vertical datums.
However, the vertical datum in Alaska has significant gaps in the spatially varying tidal information because of the difficulties of operating tide gauges there so that accurate information for datum conversion cannot be obtained. Therefore, the averages of the vertical differences were calculated (–6.44 centimeters for the St. Michael tide gauge and 9.54 centimeters for the Unalakleet tide gauge), which were then applied to each of the time series to make the comparisons. In fact, such a problem implies another advantage of a GNSS-R-derived tide gauge: it already returns a water-level height based on the terrestrial datum so that the datum of the land and the ocean can be consistently retained.
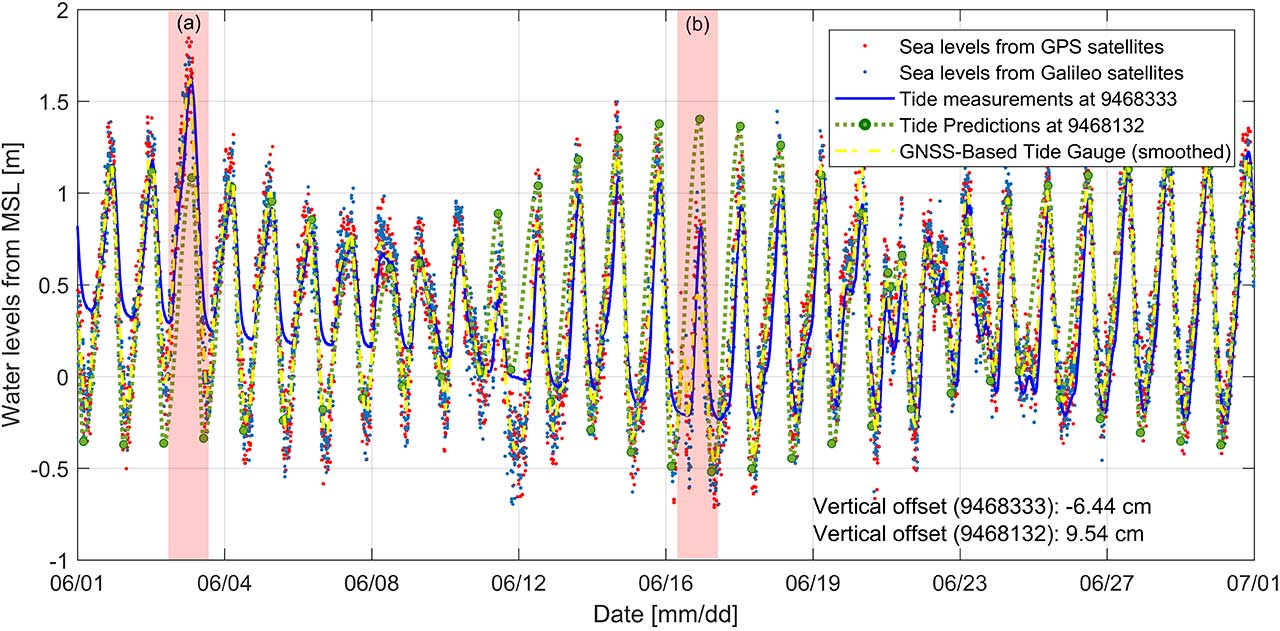
FIGURE 6 shows the sea level derived from the GNSS-based tide gauge measurements using GPS (red dots), Galileo (blue dots), the predicted sea level from the St. Michael tide gauge (green dots and lines) and measured sea level from the Unalakleet tide gauge (blue line).
FIGURE 6. Time series of sea level derived by GNSS-R-based tide gauge (AT01) in St. Michael, Alaska, during a month (red and blue dots for GPS and Galileo satellites, respectively; yellow dashed lines for the smoothed time series from two hours’ moving average filter) together with sea-level measurements from the Unalakleet tide gauge (blue solid line) and sea-level predictions from the St. Michael tide gauge (green dots for high- and low-tide predictions and green dashed line for interpolated predictions). (image: Authors)
The overall results show good agreement with the tide predictions at the nearby St. Michael tide-gauge station. It should be noted that the St. Michael tide gauge only provides high- and low-tide predictions so these were interpolated. However, some tidal characteristics not represented in the published predictions were also confirmed. In particular, as shown in the red-shaded segments of the time series marked (a) and (b) in Figure 6, larger and lower amplitudes than the tide predictions for the St. Michael tide gauge were identified on June 3 and 16, respectively.
These inconsistencies can be explained by the comparison with actual sea-level measurements at the Unalakleet tide gauge (solid blue line in Figure 6), which show very similar sea-level changes compared to those of the GNSS-R-based tide gauge. In addition, the overall larger amplitudes in the time series from the Unalakleet tide gauge can be explained by considering the fact that the amplitudes of the water levels vary along the coastline in Alaska and the Unalakleet tide gauge is approximately 74 kilometers from AT01.
To quantitatively investigate the agreement between the GNSS-R-based tide gauge and the standard tide gauges, we computed correlation coefficients. To ensure simultaneous data, the standard tide-gauge measurements and predictions were interpolated to the time tags of the GNSS-R-based time series. The correlation coefficients are 0.87 and 0.81 with the St. Michael and Unalakleet tide gauges, respectively.
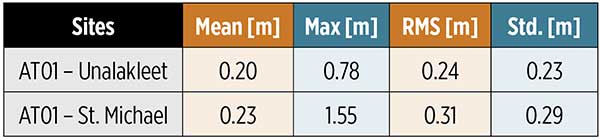
The statistical analysis of the comparison result is summarized in TABLE 1. The mean and maximum values were computed using the absolute sea-level differences. From the results, it could be established that the GNSS-R-derived sea level shows better agreement with actual sea-level measurements at the Unalakleet tide gauge even though it is approximately 74 kilometers away from AT01.
Table 1 Statistical analysis of the sea-level differences between the GNSS-R-based tide gauge (AT01) and the standard tide gauges (Unalakleet and St. Michael).
Spectral analysis was additionally conducted to validate the sea levels from the GNSS-R-based tide gauge. Because the St. Michael tide gauge does not provide actual measurements (only predictions), only the Unalakleet tide gauge was used in the spectral comparison. A fast Fourier transform (FFT) was applied to convert the time series of the sea levels to the frequency domain.
The GNSS-R-based tide gauge showed good agreement with the Unalakleet tide gauge overall. In addition, from the corresponding spectral analysis results, we were able to find meaningful harmonic constituents, M2, K1 and O1. The harmonic constituents estimated from the sea-surface measurements of the GNSS-R-based tide gauge have amplitudes most similar to the published harmonic constituents of the nearest St. Michael tide gauge, although the difference in amplitudes of the three harmonic constituents averages 12.3 centimeters.
In fact, the Unalakleet tide gauge also does not exactly match the amplitude of the estimated harmonic constituents and the published harmonic constituents. But by summarizing the corresponding results, we can conclude that the harmonic constituents estimated from the GNSS-R-based tide gauge are reliable.
As mentioned earlier, in our study, we estimated the water-level change by using GPS and Galileo satellite signals to overcome the degradation of GNSS performance due to the satellite geometry in the Arctic. The smoothed time series, calculated from a moving-average filter of two-hour intervals, is shown in Figure 6 (yellow dashed lines). The time series of sea level derived by the GNSS-R-based tide gauge during the whole month were used as ground truth for evaluating the accuracy.
This was done because the Unalakleet tide gauge is approximately 74 kilometers away from AT01 and the St. Michael tide gauge does not provide actual measurements, making it difficult to use as ground truth. As a result, the sea levels determined using the Galileo and GPS signals showed very similar accuracy with an average difference of 0.11 meters. Therefore, even if Galileo is additionally used, the estimated final water levels were at a similar level of accuracy.
However, the number of water-level observations dramatically increased (approximately doubled) when GPS and Galileo signals were both involved, even though the number of Galileo satellites is fewer than the number of GPS satellites. This is because Galileo transmits on five frequencies while GPS transmits on just three, so we can achieve more robust solutions by including Galileo.
We investigated how adding Galileo satellites changes the temporal resolution of the final sea-level measurements. At this time, several sea-level measurements pointing to the same epoch (such as sea levels from several frequency observations of the same satellite arc) were considered as one measurement for the time interval computation.
Overall, sea-level measurements using only Galileo satellites show lower temporal resolution compared to GPS satellites alone, with a mean time interval of 48.97 minutes because Galileo is not fully operational yet and fewer satellites are available. However, combining GPS and Galileo satellites to the sea-level analysis significantly increased the time resolution.
When only GPS satellites were used, the maximum time interval between two water-level measurements was greater than 3 hours, while the maximum time interval was shortened to about 1.5 hours when Galileo satellites were included in the water-level measurement.
However, even if both GPS and Galileo satellites were used, the average time interval was still 14.1 minutes, which is considerably longer than the time resolution of the standard tide gauge of 6 minutes. The lower time resolution of a GNSS-R-based tide gauge is explained by the limited ranges (azimuth and elevation angle ranges of 0° to 230° and 10° to 25°, respectively) toward the ocean at station AT01. It means the time resolution can be improved by securing a wider view of the ocean from the GNSS-R-based tide gauge.
SUMMARY AND CONCLUSION
The purpose of our study was to evaluate and verify the feasibility of using GNSS-R for sea-level monitoring in the Arctic. We used data from a GNSS station in St. Michael, Alaska, and applied an advanced algorithm that accurately determines sea levels through the comparisons of results from multiple GNSS signals along with an effective filtering procedure. Our results were validated through comparisons with measurements and predictions from nearby standard tide gauges.
From the corresponding analysis, we could confirm that the GNSS-R technique overcomes the limitations of standard tide gauges in the Arctic and successfully estimated the sea-level change in St. Michael, Alaska. The results from this study show many promising applications for a GNSS-R-based tide gauge in the Arctic, such as tsunami and flood monitoring and tidal datum determination.
In future studies, additional research should be conducted on how well the GNSS-R-based tide gauge can operate in extreme conditions such as low temperatures, wind gusts, storms, and snow. And, for further improvement of the temporal resolution of the technique, all active GNSS constellations including GPS, GLONASS, Galileo, and BeiDou should be included — that will certainly improve the temporal resolution and also potentially improve the accuracy and reliability. It would be also worth studying the spatial variations of sea-level changes by investigating the specular reflection points of GNSS multipath signals.
ACKNOWLEDGMENTS
This article is based on the paper “Monitoring Sea Level Change in the Arctic Using GNSS-Reflectometry” presented at ION ITM 2019, the 2019 International Technical Meeting of The Institute of Navigation, Reston, Virginia, Jan. 28–31, 2019.
SU-KYUNG KIM is a graduate research assistant at Oregon State University in Corvallis, Oregon. She received her M.Sc. in geoinformation engineering from Sejong University in Seoul, South Korea, in 2013. Her research interests are focused on sea-level change monitoring and crustal deformation studies using GNSS.
JIHYE PARK is an assistant professor of geomatics at Oregon State University. She holds a Ph.D. in geodetic science and surveying from The Ohio State University in Columbus, Ohio. Her research interests include GNSS positioning and navigation, GNSS reflectometry, ionospheric and tropospheric monitoring for natural hazards and artificial events, and other geospatial-related topics.
FURTHER READING
Authors’ Conference Paper
“Monitoring Sea Level Change in the Arctic Using GNSS-Reflectometry” by S.-K. Kim and J. Park in Proceedings of ION ITM 2019, the 2019 International Technical Meeting of The Institute of Navigation, Reston, Virginia, Jan. 28–31, 2019.
Pioneering Work by Manuel Martin-Neira
“The PARIS Concept: An Experimental Demonstration of Sea Surface Altimetry Using GPS Reflected Signals” by M. Martín-Neira, M. Caparrini, J. Font-Rossello, S. Lannelongue and C.S. Vallmitjana in IEEE Transactions on Geoscience and Remote Sensing, Vol. 39, No. 1, 2001, pp. 142–150, doi: 10.1109/36.898676.
“Coastal Sea Level Measurements Using a Single Geodetic GPS Receiver” by K.M. Larson, J.S. Löfgren and R. Haas in Advances in Space Research, Vol. 51, No. 8, 2013, pp. 1301–1310, doi: 10.1016/j.asr.2012.04.017.
“Monitoring Coastal Sea Level Using Reflected GNSS Signals” by J.S. Löfgren, R. Haas and J.M. Johansson in Advances in Space Research, Vol. 47, No. 2, 2011, pp. 213–220, doi: 10.1016/j.asr.2010.08.015.
“Three Months of Local Sea Level Derived from Reflected GNSS Signals” by J.S. Löfgren, R. Haas, H.-G. Scherneck and M.S. Bos in Radio Science, Vol. 46, No. 6, 2011, RS0C05, doi:10.1029/2011RS004693.
“Determination of Water Level and Tides Using Interferometric Observations of GPS Signals” by K.D. Anderson in Journal of Atmospheric and Oceanic Technology, Vol. 17, No. 8, 2000, pp. 1118-1127, doi: 10.1175/1520-0426(2000)017<1118:DOWLAT>2.0.CO;2.
Earlier Innovation Columns Dealing with GNSS Refectometry
Tides, Surges and Mean Sea-Level by D. Pugh, published originally by J. Wiley & Sons, Chichester, U.K., 1987, reprinted with corrections in 1996 and subsequently issued in e-print form by NERC Open Research Archive.
Random Sample Consensus
“Random Sample Consensus: A Paradigm for Model Fitting with Applications to Image Analysis and Automated Cartography” by M.A. Fischler and R.C. Bolles in Communications of the ACM, Vol. 24, No. 6, 1981, pp. 381–395, 10.1145/358669.358692.
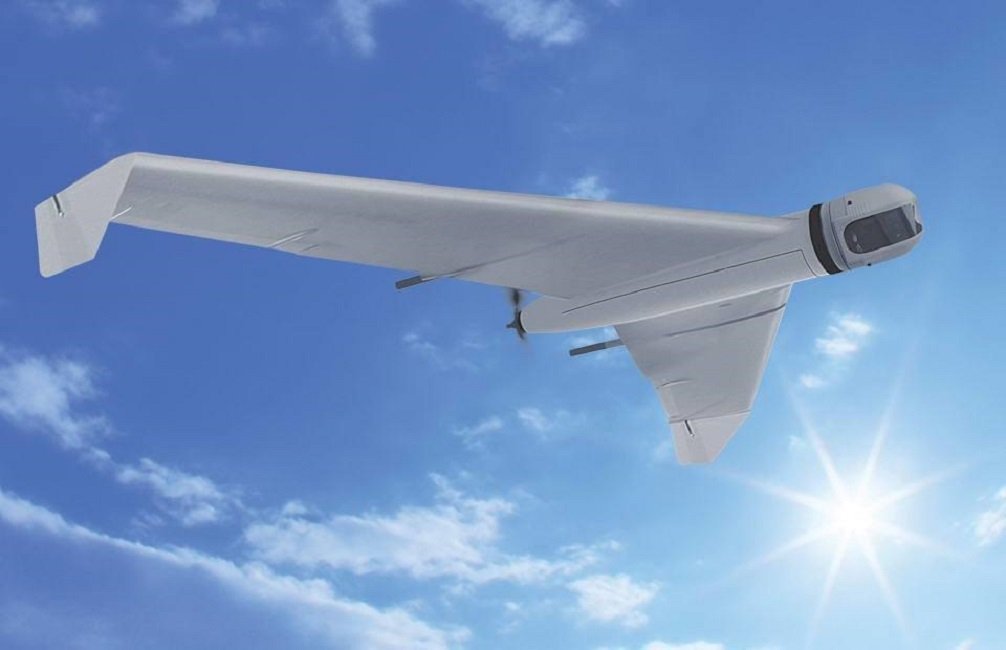
The ZALA Arctic drones are capable of successfully solving both civilian and military tasks, according to maker Kalashnikov.
Russian small arms manufacturer Kalashnikov presented the ZALA Arctic unmanned aerial vehicle (UAV) adapted for work in Arctic latitudes at the eighth international forum, “The Arctic: the Present and the Future,” reports Russian state news agency TASS.
The drone has its own GIRSAM alternative navigation system developed specially for the navigation of both UAVs and the ground-and water-based users amid the suppression or the absence of GPS or GLONASS signals.
The ZALA 421-08M and ZALA 421-16E systems are suited for their operation at freezing temperatures, which makes it possible to carry out numerous surveillance operations and regularly monitor the ice. The ZALA Arctic’s capabilities facilitate oil and gas extraction planning in areas where accurate weather and ice situation forecasts are required, according to the Kalashnikov website.
ZALA drones are equipped with the AIS system capable of detecting and identifying vessels at a distance of up to 100 kilometers, which exceeds the operational range of ground-based equipment. The user of the ZALA Arctic system receives information about each vessel: its name, size, course and speed.
The operators can autonomously live in the Arctic in a specially developed all-weather living module based on a marine 200-feet container. It is also designed for maintenance of unmanned aerial vehicles at the place of their operation.
“ZALA Arctic drones are capable of successfully solving civilian and military tasks for carrying out research in the Arctic zone, providing for the safety of sea shipping and the round-the-clock protection of the perimeters, organizing the full-fledged system of tracking the Arctic coast and territorial waters,” Kalashnikov Group CEO Vladimir Dmitriyev was quoted as saying.
The forum, “The Arctic: the Present and the Future,” organized by the Association of Polar Explorers, took place Dec. 5-7 in St. Petersburg.
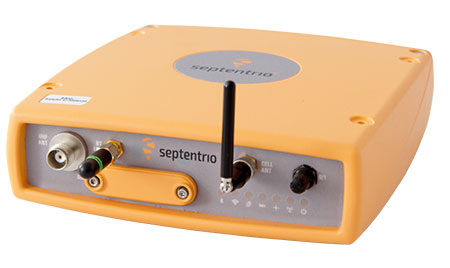
The Belgian dredging, environmental and engineering group DEME relies on the accuracy and reliability of the AsteRx family of precise GNSS positioning solutions from Septentrio.
DEME is using Septentrio’s AsteRx GNSS receivers to obtain centimeter-level accuracy for all its dredging and marine construction operations worldwide. These receivers are specifically designed to operate in difficult conditions, from dredging a few meters from the coastline to constructing wind turbines kilometers out at sea.
AsteRx-U dual-antenna receiver.
DEME began using Septentrio’s solutions more than 10 years ago. While dredging in the Belgian town of Oostende, DEME was unable to obtain a reliable RTK position from their GNSS equipment because of interfering radio signals from a local radio tower.
Septentrio worked with DEME to identify the source of the interference and modified a standard RTK receiver with special firmware to address the jamming problem. This case, along with others faced by Septentrio’s customers in the field, encouraged the development of a dedicated interference mitigation technology called AIM+, which is now standard in Septentrio’s GNSS solutions.
Septentrio’s AsteRx GNSS receivers have been deployed on DEME’s ships around the world. They have been vital to DEME for the success of projects such as the creation of Gateway Port in London, U.K.; the construction of Deurganckdok in Antwerp, Belgium; the Pearl Qatar City; the Thornton Bank Offshore Windfarm in Belgium; the extension of the Suez Canal in Egypt; and many more.
“’Creating land for the future’ is the slogan here at DEME and this is thanks, in part, to the accuracy and robustness of the solutions offered by Septentrio,” says Lorentz Lievens, head of the survey department.
“Jamming is a concern which DEME has seen more and more all over the world,” Lievens says. “Septentrio’s receivers are unique in that they continue to provide an accurate solution even in areas of high radio and ionospheric interference allowing DEME to deliver projects on time and on budget. Septentrio’s precise positioning solutions will remain vital for DEME to deliver quality and cost-effective operations around the world for many years to come.”
The Arctic SDI Board, — which includes mapping executives from Canada, Kingdom of Denmark, Finland, Iceland, Norway, Russia, Sweden and the U.S. — met June 14-16 in Anchorage, Alaska, to further develop a robust Arctic Spatial Data Infrastructure.
The Arctic SDI is a cooperation based on a Memorandum of Understanding signed by the eight National Mapping Agencies and is intended to ensure Arctic geospatial data is easier for users to access, validate and combine.
Erosion and climate change along Alaska’s Arctic Coast. (Photo: USGS)
A spatial data infrastructure (SDI) provides tools for data distributors to ensure geospatial data is easier for users to access, validate and combine with other data. Important data sets are produced and distributed by many stakeholders — in the public and private sector — and most of it can be geographically referenced.
“It’s important that scientists, resource managers, decision-makers and citizens can discover, access and use trusted data to conduct research, make informed decisions, and respond to emergencies in a changing Arctic,” said Kevin Gallagher, the USGS associate director for core science systems and current Arctic SDI Board chair. “The Arctic SDI initiative brings together geospatial experts and scientists in a voluntary cooperation between these country’s national mapping agencies in direct support of the priorities of the Arctic Council and other important stakeholders.”
The Arctic SDI cooperation has built a foundation on which important strategic work is being conducted by lead countries through several working groups in alignment with the five-year Arctic SDI Strategic Plan 2015-2020 adopted last year.
Polar bear mother and two cubs on the Beaufort Sea ice. (Photo: USGS)
The Arctic SDI Geoportal, launched in 2014, includes a continuously updated, harmonized pan-Arctic basemap using data delivered by the individual countries and national mapping agencies. Together they are working to increase the number of national authoritative datasets available through the Geoportal. The basemap, geoportal and access to data are continually being improved.
Additionally, an Open Geospatial Consortium (OGC) Arctic Spatial Data Pilot, sponsored by Natural Resources Canada and the USGS is underway to test interoperability of standards, increase the inventory of available Arctic data, and advance the understanding of best practices for distribution and sharing of data by showcasing the value of a standards based, data rich environment.
In 2009, the Arctic Council Senior Arctic Officials gave unanimous formal support to the Arctic SDI initiative and while the Arctic Council represents its primary stakeholder group, the Arctic SDI is aligned with the global, regional and national geodata context, including:
The United Nations Committee of Experts on Global Geospatial Information Management (UN-GGIM),
The Global Earth Observation System of Systems (GEOSS),
The European Commission’s Infrastructure for Spatial Information in the European Community (INSPIRE)
The U.S Federal Geographic Data Committee National Spatial Data Infrastructure (NSDI),
and Canada’s Spatial Data Infrastructure (CGDI).
Additionally, the work adheres to Open Data principles, including facilitation of open and interoperable data based on OGC and ISO standards, specifications, architecture and software.
Arctic SDI Working Groups are continuing communication and outreach with stakeholders, especially the Arctic Council Working Groups, to advance understanding of data sharing and management techniques, and best practices to improve data access and availability. This work also includes development of communication materials, user guides and a manual.
Additionally, elevation experts from the national mapping agencies have been cooperating with the National Science Foundation and Polar Geospatial Center to provide data and expert reviews in support of a high quality Pan-Arctic Digital Elevation Model being developed in support of a U.S. Chairmanship Arctic Council Initiative.
A sea-based test is demonstrating the potential of extending satnav augmentation coverage into north polar regions, offering a safety-of-life standard of navigation performance to users including shipping or aircraft in flight.
Norwegian research vessel Gunnerus, owned by the Norwegian University of Science and Technology, is equipped to pick up satnav signals from GPS and GLONASS as well as augmentation signals specially generated for the test, modeled on Europe’s existing European Geostationary Navigation Overlay System (EGNOS).
Norwegian research vessel Gunnerus, owned by the Norwegian University of Science and Technology. (Photo: ESA)
Gunnerus is making use of the signals during five days of sailing off Trondheim. The demonstration is part of the Arctic Test Bed project, conducted within the European Global Navigations Satellite System Evolutions Programme (EGEP) of ESA.
The ESA-designed EGNOS improves the precision of US GPS signals over most European territory, while also providing continuous and reliable updates on their integrity.
A 40-strong network of ground monitoring stations perform an independent measurement of GPS signals, so that corrections can be calculated and then passed to users immediately via a trio of geostationary satellites. The result is a several-fold increase in precision.
“Simply due to Earth’s curvature, EGNOS signals are not visible above about 70 degrees north, but they are needed to support polar routing,” explains Marco Porretta, overseeing the Arctic Test Bed project.
To investigate possible methods for improving Satellite-Based Augmentation System (SBAS) performance in this Arctic region, the test campaign will assess the benefits of augmentation for various types of satnav signals: single-frequency GPS; dual-frequency GPS; and dual-constellation dual-frequency, where GPS signals are combined with those of its Russian counterpart, thus increasing the number of observations.
“The planned next-decade upgrade of EGNOS, along with other augmentation systems operated over other continents (such as the U.S. equivalent Wide Area Augmentation System, WAAS), will perform multi-constellation augmentation as standard,” adds Marco. “That means data from this test case should be especially valuable to support interoperability between future augmentation systems.”
The Arctic Test Bed makes use of some EGNOS reference stations along the north of Europe, along with additional stations in locations including Greenland, Jan Mayen Island, Spitsbergen and Norway.
Model of the well-known Oct. 30, 2003, Halloween solar storm produced by the MIDAS tomographic ionospheric model from the University of Bath. (Image; ESA)
Marco explains, “These stations will allow specific monitoring of the ionosphere — the electrically active segment of Earth’s atmosphere — in the Arctic region. The ionosphere is significant because it is an important source of satnav signal delay, or in some cases can cause receivers to lose signal lock due to ionospheric scintillations.”
With geostationary satellites out of sight, navigation corrections for the Arctic Test Bed will be transmitted via terrestrial radio. In future, an operational version of the system could either stick with this solution or rely on other satellite-based means of dissemination from non-geostationary orbit.
The all-important generation of the augmentation correction message will take place at a processing center in Hønefoss, Norway, using adapted EGNOS algorithms.
An operational version of the Arctic Test Bed could potentially extend augmentation coverage to as high as 85 degrees north, as high as Greenland, extending to the edge of WAAS coverage.
The Arctic Test Bed project was initiated by ESA, with Kongsberg Seatex serving as prime contractor, GMV Aerospace and Defence, Thales Alenia Space France, Logica, Terma, the Norwegian Mapping Authority, Technical University of Denmark, Septentrio and the University of Calgary.
The Arctic SDI Pilot is sponsored by the United States Geological Survey (USGS) and Natural Resources Canada. The goal is to demonstrate to Arctic stakeholders the diversity, richness and value of a Spatial Data Infrastructure (SDI) based on web services and standardized exchange formats in helping address critical issues impacting the Arctic.
Stakeholders include national and pan-Arctic science and monitoring organizations and decision makers engaged in Arctic research, social and economic policy, and environmental management. The organizations participating in the ArcticSDI Pilot will document and publicize best practices that can support a rich network of web-accessible data and service resources for the Arctic.
The pilot has two phases.
Phase 1, an OGC Interoperability Program Concept Development study, began in December 2015. In Phase 1, project planners are building an inventory of currently available Arctic geospatial data layers and web services and defining the Arctic SDI architecture. This work will be supported by partners engaged in industry, research, and numerous jurisdictions. A Request for Information will be published in January 2016 to elicit further ideas, experiences, and projects in industry, research institutions and public administration to make maximal use of the ArcticSDI and to develop it further.
The Arctic SDI Pilot Phase 1 will also provide direct input into OGC’s major Testbed 12 Interoperability Program initiative. USGS has indicated that sponsor funding will be made available for Testbed 12 to test and further develop components identified in the Arctic SDI pilot. Through this collaboration, arctic stakeholders and the Arctic SDI will leverage and benefit from the leading-edge interoperability research, development and outreach that is ongoing in the OGC’s series of major testbeds.
All findings from Phase 1 will serve as input for Phase 2, which will be an OGC Interoperability Program Pilot Project. OGC pilot projects apply and test OGC Standards in operational applications using Standards Based Commercial Off-the-Shelf (SCOTS) products that implement OGC Standards. Pilot projects provide an operational implementation so that users and technology developers can collaborate and learn how to better address their requirements using standards-based architectures.
To articulate the value of interoperability via standards, technology provider participants will implement the recommended Arctic SDI architecture in support of Arctic policy scenarios. A video will be produced to engage policymakers on the benefits of integrating diverse data utilizing Arctic SDI standards and information management best practices.
The OGC is an international consortium of more than 515 companies, government agencies, research organizations, and universities participating in a consensus process to develop publicly available geospatial standards. OGC Standards support interoperable solutions that “geo-enable” the web, wireless and location-based services, and mainstream IT. OGC Standards empower technology developers to make geospatial information and services accessible and useful with any application that needs to be geospatially enabled.
Arctic sea ice volume has declined by 36 percent in the autumn and 9 percent in the winter between 2003 and 2012, an international team of scientists has discovered.
Researchers used new data from the European Space Agency’s CryoSat-2 satellite spanning 2010 to 2012, and data from NASA’s ICESat satellite from 2003 to 2008 to estimate the volume of sea ice in the Arctic.
They found that from 2003 to 2008, autumn volumes of ice averaged 11,900 cubic kilometers (2,855 cubic miles) But from 2010 to 2012, the average volume had dropped to 7,600 cu. km. (1,823 cu. mi.) a decline of 4,300 cu. km (1,032 cu. mi.) The average ice volume in the winter from 2003 to 2008 was 16,300 cu. km. (3,911 cu. mi.), dropping to 14,800 cu. km (3,551 cu. mi.) between 2010 and 2012 — a difference of 1,500 cu. km. (360 cu. mi.).
A Polar-5 aircraft flying over an Arctic site uses its instruments to validate sea-ice thickness measurements made from space by the Cryosat-2 satellite. (Credit: R. Willatt)
‘The data reveals that thick sea ice has disappeared from a region to the north of Greenland, the Canadian Archipelago, and to the northeast of Svalbard,” said Katharine Giles, a research fellow at the Centre for Polar Observation and Modelling at University College London (UCL) and a member of the scientific team.
Giles and her colleagues report their findings in a paper that has been accepted for publication in Geophysical Research Letters, a journal of the American Geophysical Union. AGU has posted the manuscript online as an accepted article.
The findings confirm the continuing decline in Arctic sea-ice volume simulated by the Pan-Arctic Ice-Ocean Modelling and Assimilation System (PIOMAS), which estimates the volume of Arctic sea ice and had been checked using earlier submarine, mooring, and satellite observations until 2008.
Other satellites have already shown drops in the area covered by Arctic sea ice as the climate has warmed. Indeed, sea-ice extent reached a record minimum in September 2012. But CryoSat-2, launched in April 2010, differs in that it lets scientists estimate the volume of sea ice — a much more accurate indicator of the changes taking place in the Arctic.
“While two years of CryoSat-2 data aren’t indicative of a long-term change, the lower ice thickness and volume in February and March 2012, compared with same period in 2011, may have contributed to the record minimum ice extent during the 2012 autumn,” said Professor Christian Haas of York University, Canada Research Chair for Arctic Sea Ice Geophysics, co-author of the study and coordinator of the international CryoSat sea ice validation activities.
CryoSat-2 measures ice volume using a high-resolution synthetic aperture radar altimeter, which fires pulses of microwave energy down towards the ice. The energy bounces off both the top of sections of ice and the water in the cracks in between. The difference in height between these two surfaces let scientists calculate the volume of the ice cover.
The team confirmed CryoSat-2 estimates of ice volume using measurements from three independent sources — aircraft, moorings, and NASA’s Operation IceBridge.
The research was funded by the Natural Environment Research Council, the European Space Agency, the German Aerospace Center, Alberta Ingenuity, NASA, the Office of Naval Research and the National Science
Foundation.