Tag: experimental geoid models

  • NGS releases annual experimental geoid models and gravity interpolation tools

    NGS releases annual experimental geoid models and gravity interpolation tools

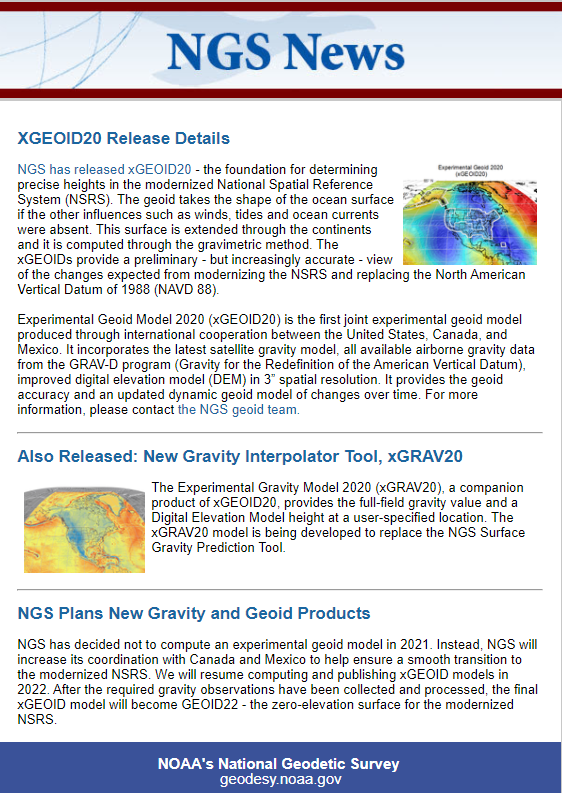
    My last column highlighted an ArcGIS web application that incorporates various datasets and data layers to assist surveyors planning vertical control surveys. On Jan, 29, the National Geodetic Survey (NGS) released the latest experimental geoid model, xGeoid20, and a new gravity interpolation tool (see box below, “NGS Releases Annual e& Gravity Interpolation Tools”).

    This newsletter will highlight some attributes of these two new products. First, why am I writing about another experimental geoid model. I discussed xGeoid18 in my December 2018 column and xGeoid16 in my June 2017 column. What’s important here is that this will be the last experimental geoid model until 2022, and the dynamic geoid model has also been updated this year in the form of xDGEOID20.

    xDGEOID20 is produced by NGS within the Geoid Monitoring Sƒervice (GeMS) and is part of the new NAPGD2022. Therefore, users only have a few more years to understand the differences between the hybrid geoid model that is being used today to estimate GNSS-derived orthometric heights and the gravimetric geoid model which will be used to estimate North American-Pacific Geopotential Datum of 2022 (NAPGD2022) GNSS-derived orthometric heights.

    NGS also announced a new gravity tool, denoted as “The Experimental Gravity Model 2020 (xGRAV20).” xGRAV20 is designed to provide a full-field gravity value and a digital elevation model height at a-specified location. The xGRAV20 model will be important to users that are computing leveling-derived orthometric heights consistent with NAPGD2022.

    It is important to note that the xGEOIDs provide a preliminary but increasingly-accurate view of the changes expected from the upcoming NAPGD2022. Also, the xGEOID20 geoid model is the first combination of the geoid models computed by scientists at NGS and Canadian Geodetic Survey (CGS). One unique element to xGEOID20 is that the differences between the A and the B model are due to the contribution of the GRAV-D airborne gravity and differences in methodology.

    The National Geodetic Survey (NGS) has published annual experimental geoid (xGEOID) models since 2014. Each of these experimental geoids demonstrate the improvements provided by the addition of airborne gravity data (GRAV-D data) and by the refinement of geoid computation methods.

    NGS Releases Annual Experimental Geoid Models & Gravity Interpolation Tools. (Image: NGS)
    NGS Releases Annual Experimental Geoid Models & Gravity Interpolation Tools. (Image: NGS)

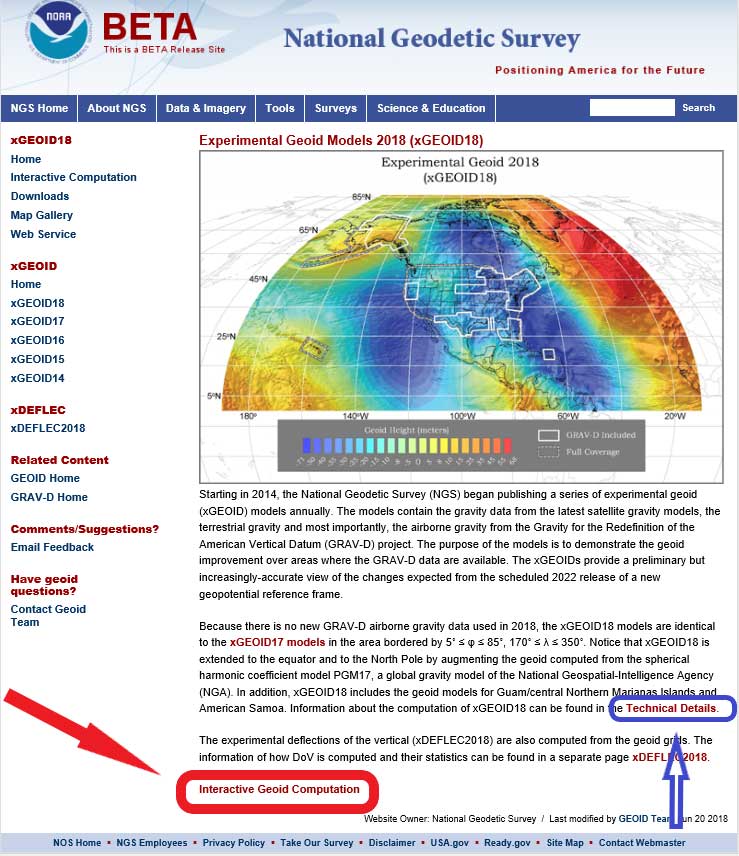
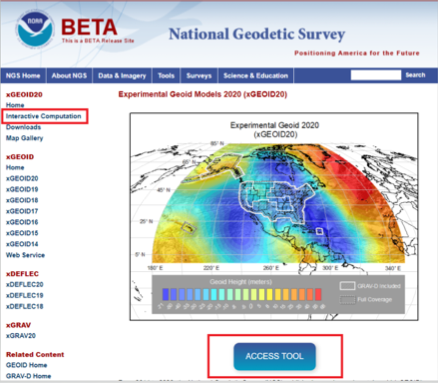
    First, users can access the xGeoid20 model here. See the box titled Experimental Geoid Models 2020 (xGEOID20).

    Experimental Geoid Models 2020 (xGEOID20). (Image: NGS)
    Experimental Geoid Models 2020 (xGEOID20). (Image: NGS)

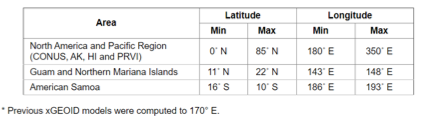
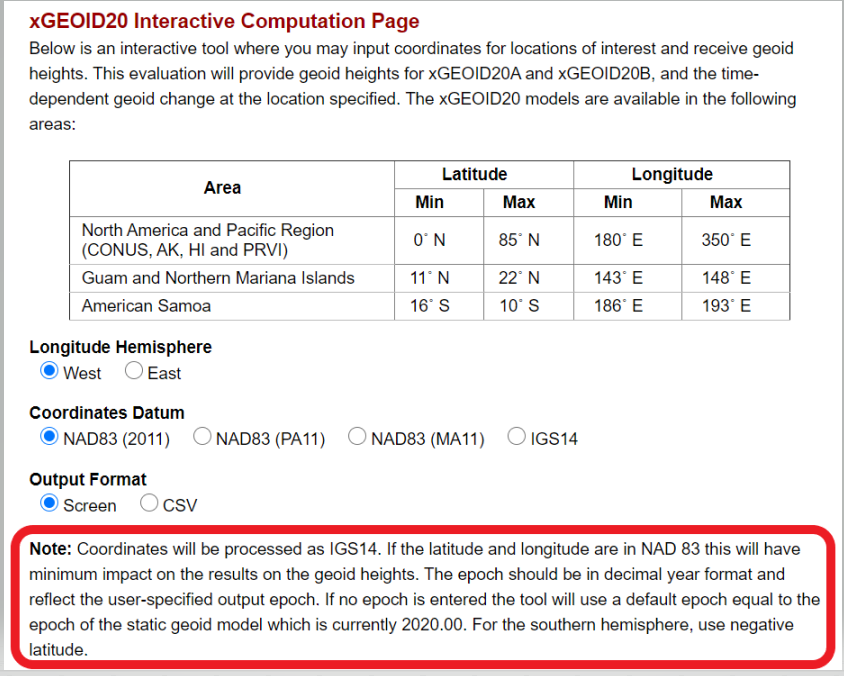
    As the image above indicates, the xGEOID20 is available over a very large area. The box below lists the latitude and longitude boundaries of the areas where xGeoid20 is available.

    Areas Where xGeoid20 Model Is Available. (Image: NGS)
    Areas Where xGeoid20 Model Is Available. (Image: NGS)

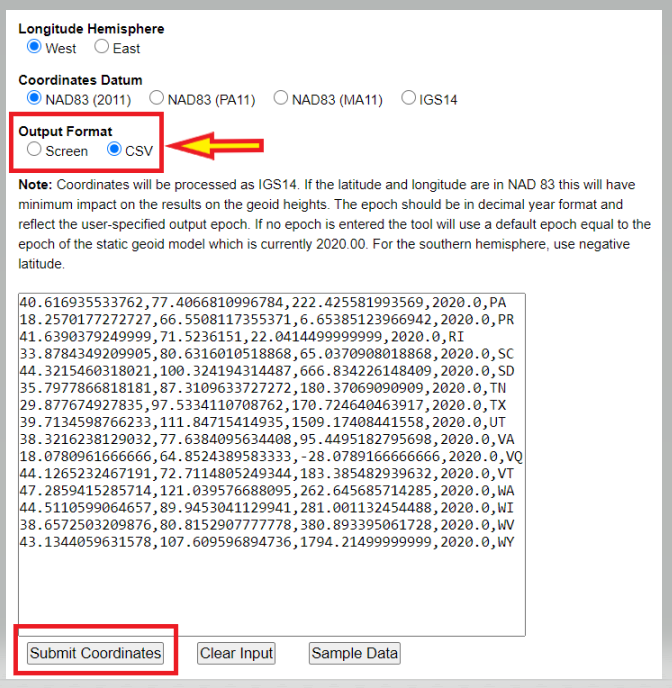
    To use the xGeoid20 Interactive Computation Page, the user can click on the “ACCESS TOOL” button below the map or the Interactive Computation button on the left side of the webpage (see the image above, “Experimental Geoid Models 2020 (xGEOID20)”). I’d like to highlight a statement that NGS added as a note on the computation page:

    1. Coordinates will be processed as IGS14.
    2. The epoch should be in decimal year format and reflect the user-specified output epoch. If no epoch is entered, the tool will use a default epoch equal to the epoch of the static geoid model, which is currently 2020.00.

    The user needs to know that the epoch is used to compute the xDGEOID20 value. I will demonstrate how this works later in this column.

    xGEOID20 Interactive Computation Page. (Image: NGS)
    xGEOID20 Interactive Computation Page. (Image: NGS)

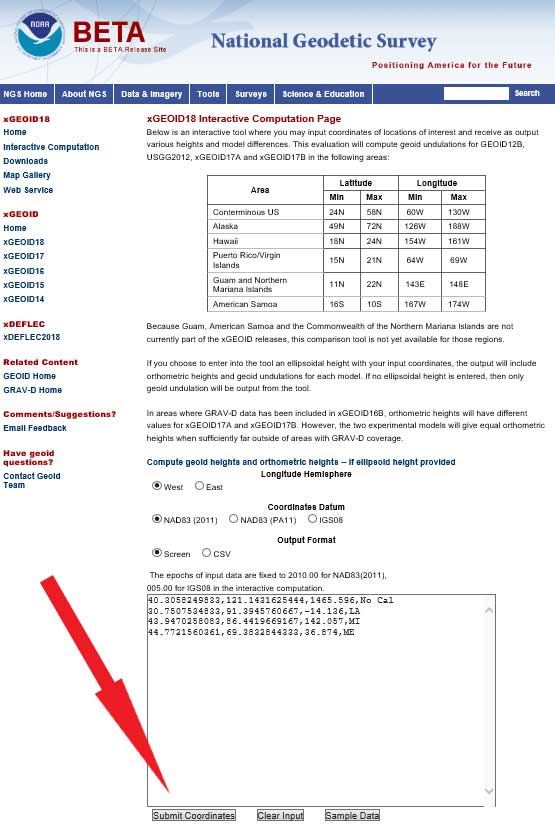
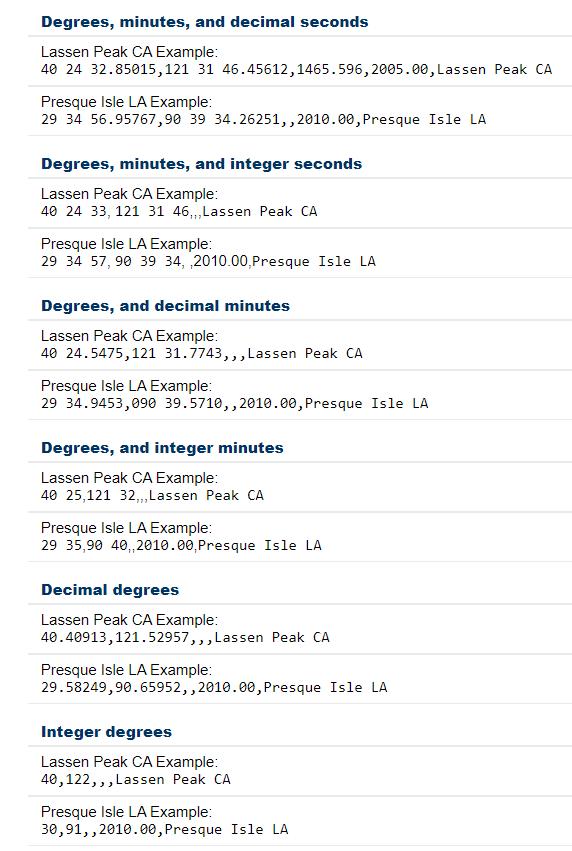
    As in past xGeoid interactive computations web applications, the user can submit data in various formats. The box titled “Input Formats Permitted for xGeoid20 Webtool” provides a list of the permitted formats. It should be noted that inputting an ellipsoidal height, epoch and name are optional. However, the default epoch is 2020.00, so if you want a different epoch, you need to enter the date. Also. the program will only compute an orthometric height if the user provides an ellipsoidal height.

    Input Formats Permitted for xGeoid20 Webtool. (Image: NGS)
    Input Formats Permitted for xGeoid20 Webtool. (Image: NGS)

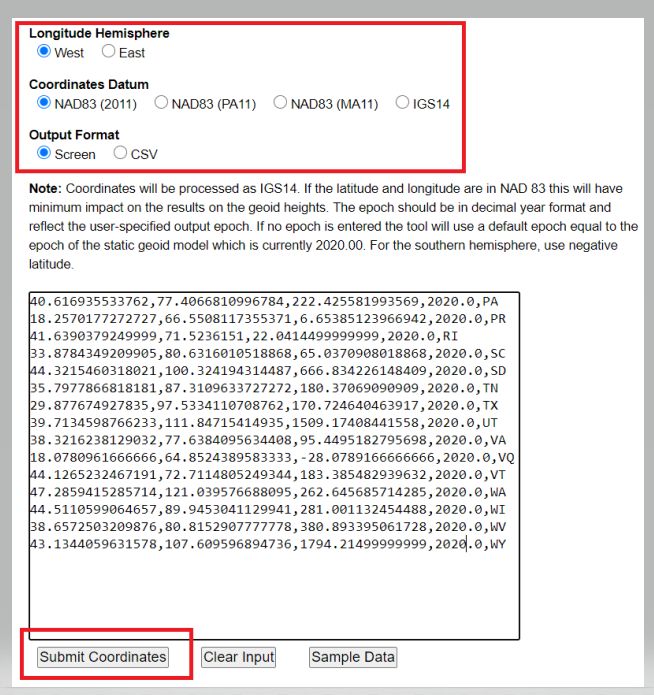
    Users have the option of getting the output from the xGeoid20 tool on their computer screen or in the CSV format. The box below is an example of inputting data using the screen option. Once you enter your data, the user clicks on the submit button.

    Example of Input Format for Screen Option. (Image: NGS)
    Example of Input Format for Screen Option. (Image: NGS)

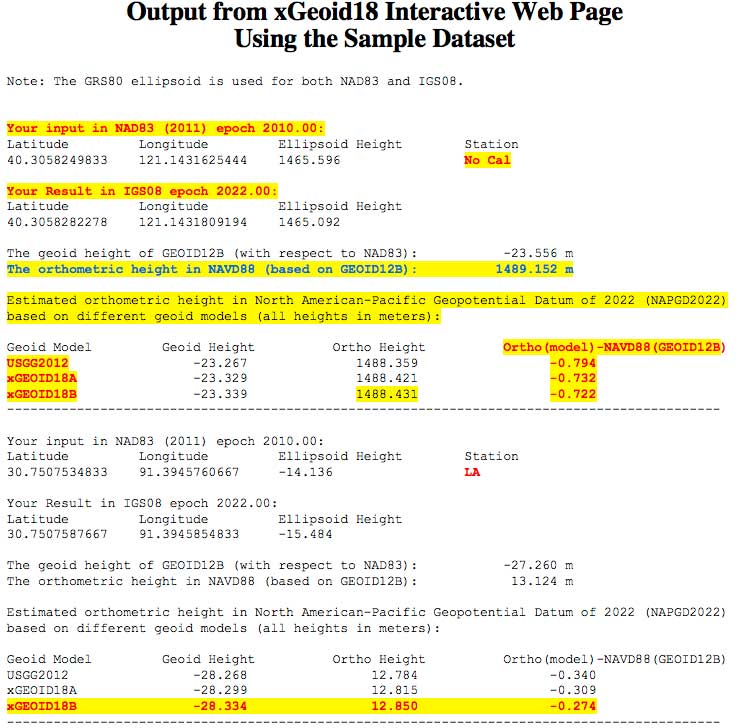
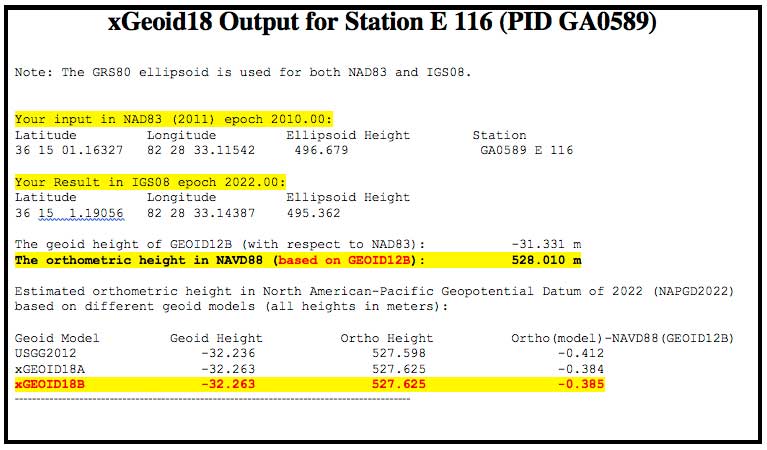
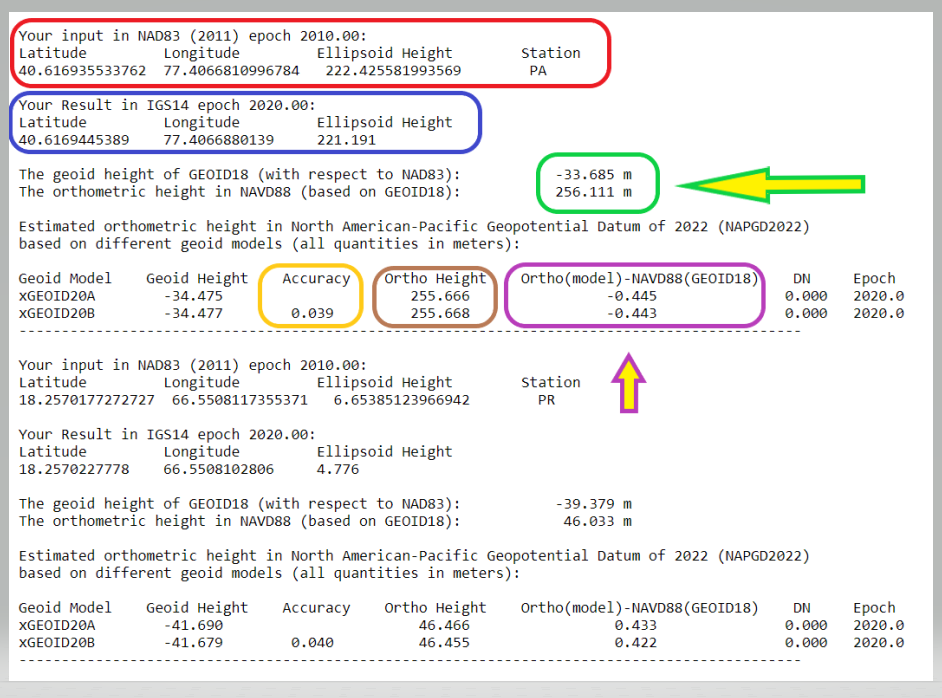
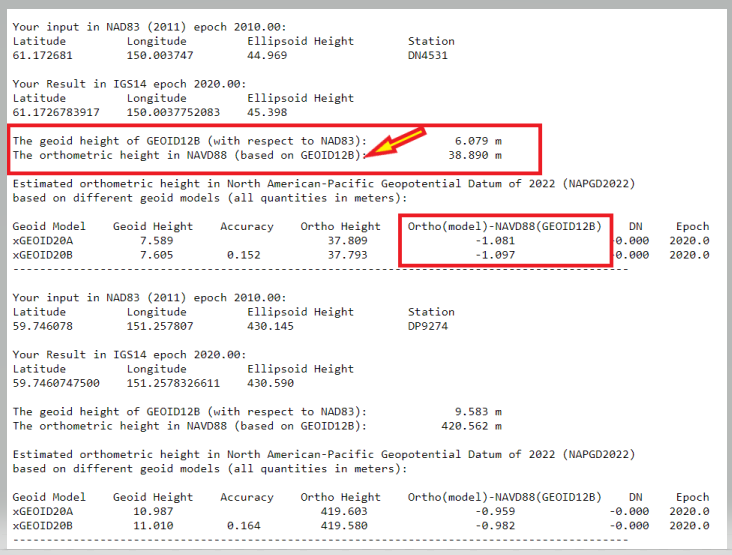
    The next image shows an example of the output using the screen option. I have highlighted a few numbers that I’d like to address.

    • Your input in NAD83 (2011) epoch 2010.00 (red). I entered my coordinates as NAD 83 (2011), and it assumed that these coordinates are epoch 2010.0.
    • Your Result in IGS14 epoch 2020.00 (blue). The routine provides your output coordinates in IGS14, epoch 2020.00. This is the epoch of the static geoid model.
    • The geoid height of GEOID18 (with respect to NAD83) and the orthometric height in NAVD88 (based on GEOID18) (green). This NAVD 88 value is for comparison purposes only. It is using GEOID18 and provides an estimate of the differences between the future NAPGD2022 and the current NAVD 88. The orthometric height is computed using the following formula: NAD 83 (2011) ellipsoid height (epoch 2010.0} minus GEOID18.
    • Ortho Height (brown). This is the estimation of the orthometric height using the following formula: IGS14 ellipsoid height (epoch 2020.0} minus xGEOID20A (or B).
    • Ortho(model)-NAVD88(GEOID18) (purple). These differences are the estimates of the differences between the future NAPGD2022 and the current NAVD 88. It provides the differences for both the xGeoid20A and xGeoid20B model. I look at the B model because it used the GRAV-D data in the development of the model.
    • Accuracy (yellow). This is the estimated 95% confidence interval for geoid height.

    Example of Output Format from Screen Option

    xGEOID20 Interactive Computation Output

    Note: The GRS80 ellipsoid is used for both NAD83 and IGS14.

    N: The geoid height at epoch t0 = 2020.0, which is geocentric and relative to the GRS80 reference ellipsoid.

    Accuracy: Estimated 95% confidence interval for geoid height.

    DN: The time-dependent geoid change computed between user inputted epoch (t) and t0. To obtain the dynamic geoid height at user inputted epoch (t), add N + DN.
    Either Model A or Model B N values may be used for this depending on user preference.

    Example of Output Format from Screen Option. (Image: NGS)
    Example of Output Format from Screen Option. (Image: NGS)

    The box below shows an example of inputting data using the CSV option.

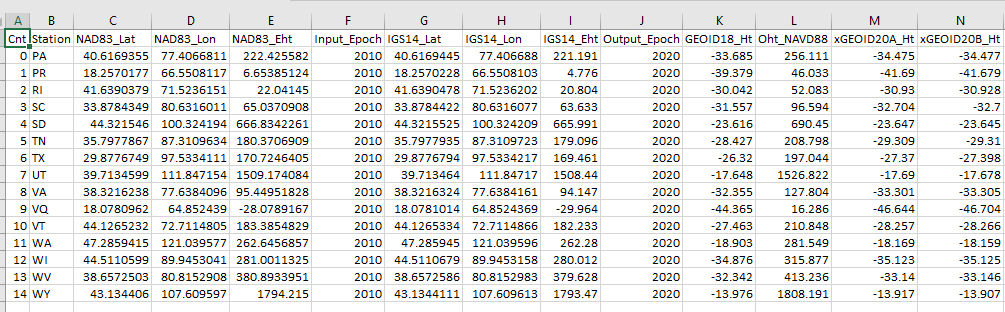
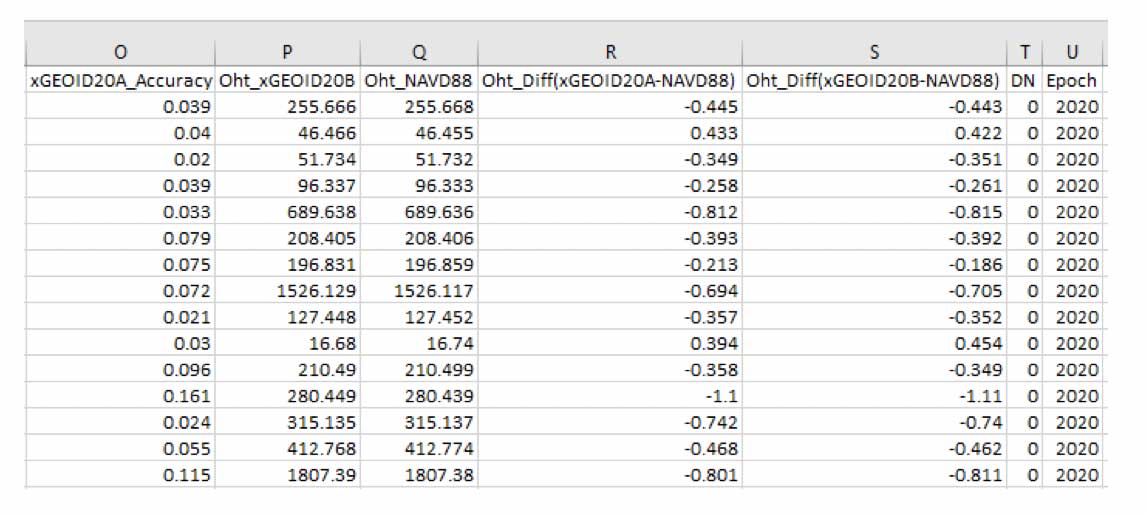
    Example of Output Format from CSV Option

    Note: The GRS80 ellipsoid is used for both NAD83 and IGS14.

    N: the geoid height at epoch t0 = 2020.0, which is geocentric and relative to the GRS80 reference ellipsoid.

    Accuracy: Estimated 95% confidence interval for geoid height.

    DN: the time-dependent geoid change computed between user inputted epoch (t) and t0. To obtain the dynamic geoid height at user inputted epoch (t), add N + DN. Either Model A or Model B N values may be used for this depending on user preference.

    Cnt,Station,NAD83_Lat,NAD83_Lon,NAD83_Eht,Input_Epoch,
    IGS14_Lat,IGS14_Lon,IGS14_Eht,Output_Epoch,GEOID18_
    Ht,Oht_NAVD88,xGEOID20A_Ht,xGEOID20B_Ht,xGEOID20A_Accuracy,
    Oht_xGEOID20B,Oht_NAVD88,Oht_Diff(xGEOID20A-NAVD88),Oht_Diff(xGEOID20B-NAVD88),DN,Epoch

    0,PA,40.616935533762,77.4066810996784,222.425581993569,
    2010.00,40.6169445389,77.4066880139,221.191,2020.00,
    -33.685,256.111,-34.475,-34.477,0.039,255.666,255.668,
    -0.445,-0.443,0.000,2020.0001,PR,18.2570177272727,66.5508117355371,
    6.65385123966942,2010.00,18.2570227778,66.5508102806,
    4.776,2020.00,-39.379,46.033,-41.690,-41.679,0.040,46.466,46.455,
    0.433,0.422,0.000,2020.000

    Example of Input Format for CSV Option. (Image: NGS)
    Example of Input Format for CSV Option. (Image: NGS)

    The printed output from the CSV option looks very confusing, but it can be imported into an excel spreadsheet. The headings and values are all separated by a comma so everything falls into the appropriate columns after importing the data (see image below.)

    Example of CSV Output Format Imported into Excel. (Screenshot: David Zilkosky)
    Example of CSV Output Format Imported into Excel. (Screenshot: David Zilkoski)
    Example of CSV Output Format Imported into Excel. (Screenshot: David Zilkoski)
    Example of CSV Output Format Imported into Excel. (Screenshot: David Zilkoski)

    I stated in the xGeoid20 write up that the dynamic geoid model has also been updated this year in the form of xDGEOID20. This model is produced by NGS within the Geoid Monitoring Service (GeMS) and is part of the new NAPGD2022. For a thorough discussion on GeMS and the time-dependent geoid, view the webinar from NGS’ presentation library. See the box titled “GeMS Webinar by Kevin Ahlgren.”

    GeMS Webinar by Kevin Ahlgren (available at https://www.ngs.noaa.gov/web/science_edu/presentations_library/). (Screenshot: David Zilkoski)
    GeMS Webinar by Kevin Ahlgren (available at ngs.noaa.gov/web/science_edu/presentations_library). (Screenshot: David Zilkoski)

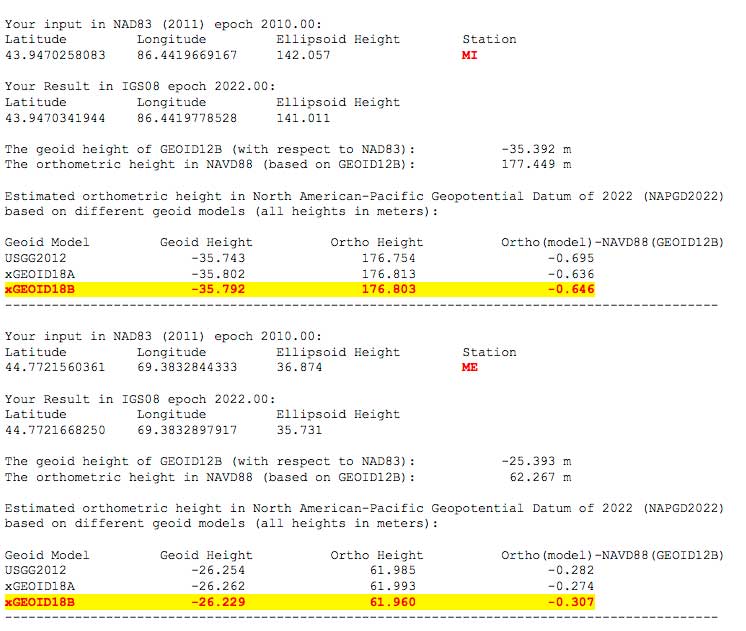
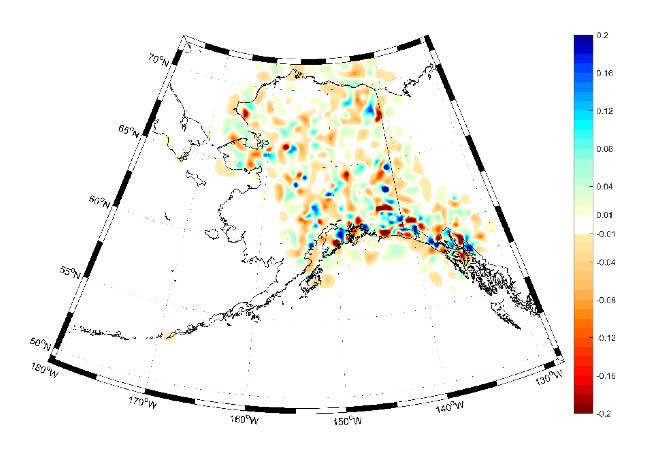
    Also, one of my previous columns described NGS’ GeMS program. The images titled “Examples of the Time-Dependent Geoid Change in Alaska EPOCH 2020.0” and “Examples of the Time-Dependent Geoid Change in Alaska EPOCH 2025.0” show the change in geoid value from Epoch 2020 to Epoch 2025 for two stations in Alaska.

    Examples of the Time-Dependent Geoid Change in Alaska EPOCH 2020.0. (Image: NGS)
    Examples of the Time-Dependent Geoid Change in Alaska EPOCH 2020.0. (Image: NGS)
    Examples of the Time-Dependent Geoid Change in Alaska, EPOCH 2025.0. (Image: NGS)
    Examples of the Time-Dependent Geoid Change in Alaska, EPOCH 2025.0. (Image: NGS)

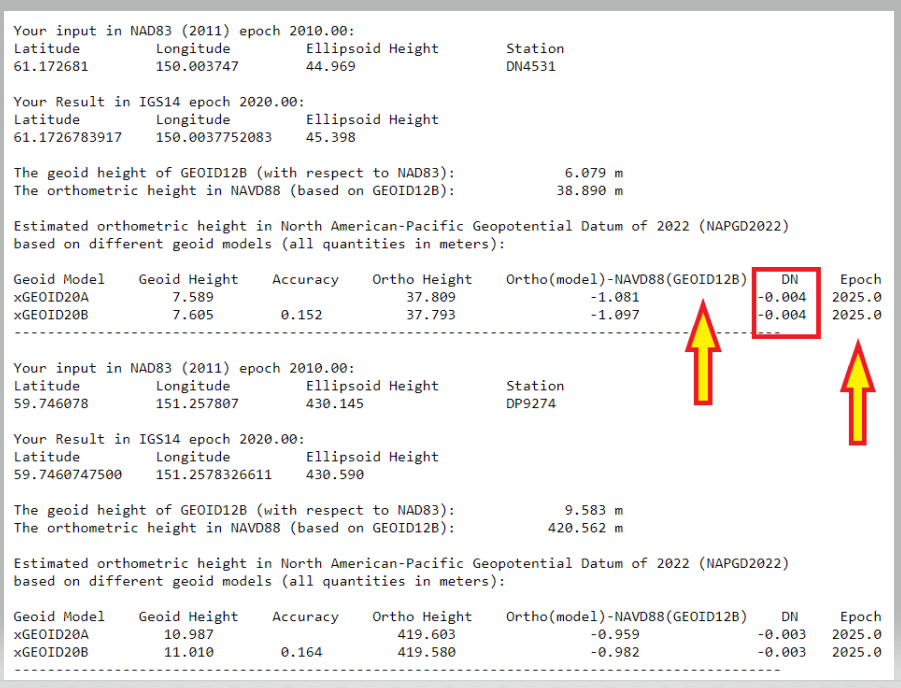
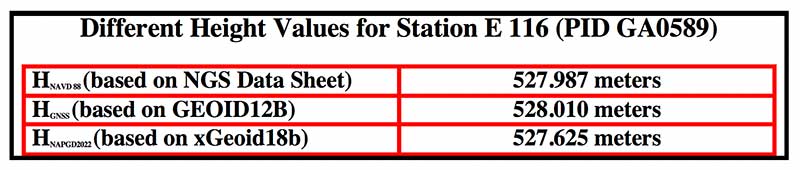
    First, looking at the box titled “Examples of the Time-Dependent Geoid Change in Alaska EPOCH 2020.0,” the change between NAPGD2022 and NAVD 88 is approximately 1 meter. Users should note that the GEOID12B is used to establish the NAVD 88 height. Alaska was not included in GEOID18. Comparing the two Alaska labeled boxes, the xDGEOID2022 change between 2020.0 and 2025.0 is –4 mm. I will address this topic in more detail in future newsletters.

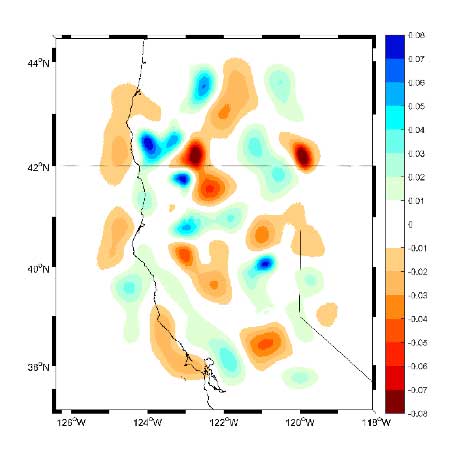
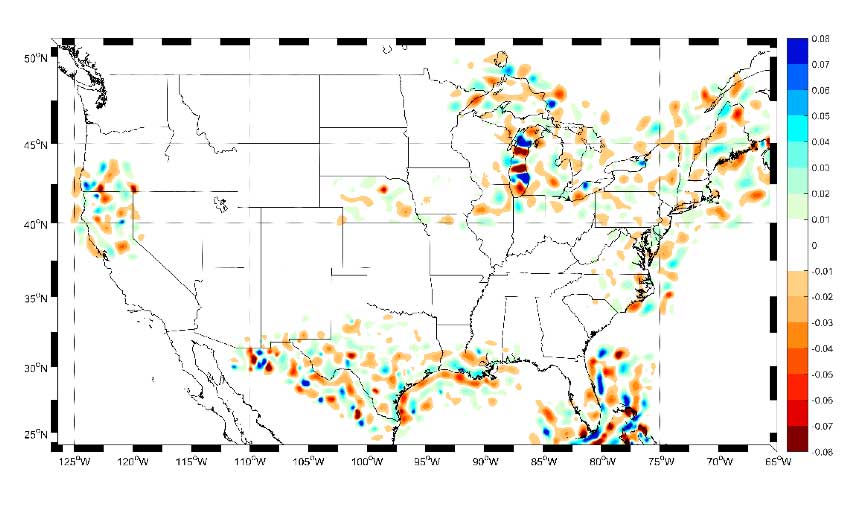
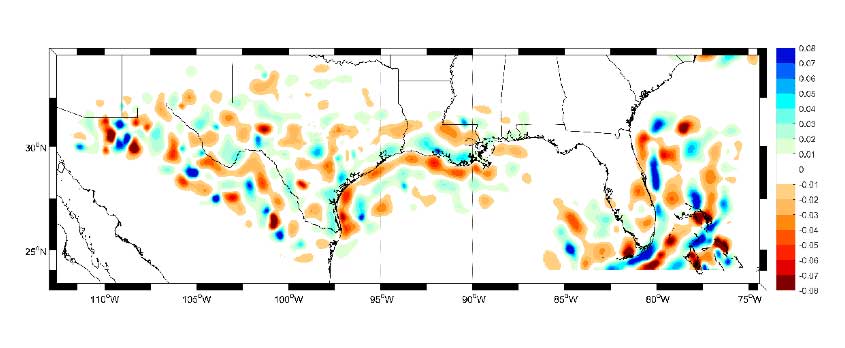
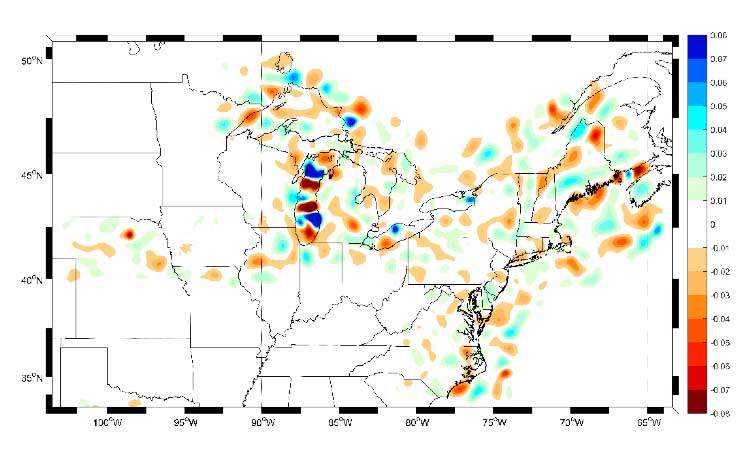
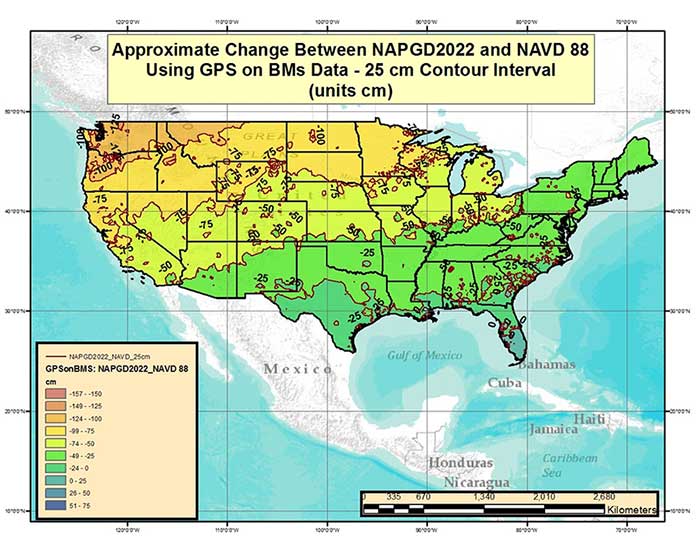
    As stated by NGS news announcement, “The xGEOID models provide a preliminary but increasingly-accurate view of the changes expected from the upcoming North American-Pacific Geopotential Datum of 2022 (NAPGD2022).” NGS has produced many figures that describe the bias and trend between the future NADGP2022 and NAVD 88. In my June 2017 column I provided a plot that depicted the difference between NAPGD2022 and NAVD 88 based on the GPS on Bench Mark dataset. See the image below.

    Figure from June 2017 Survey Scene column. (Image: NGS)
    Figure from June 2017 Survey Scene column. Approximate Change Between NAPGD2022 and NAVD 88 Using GPS on BMs Data (units = cm). (Image: NGS)

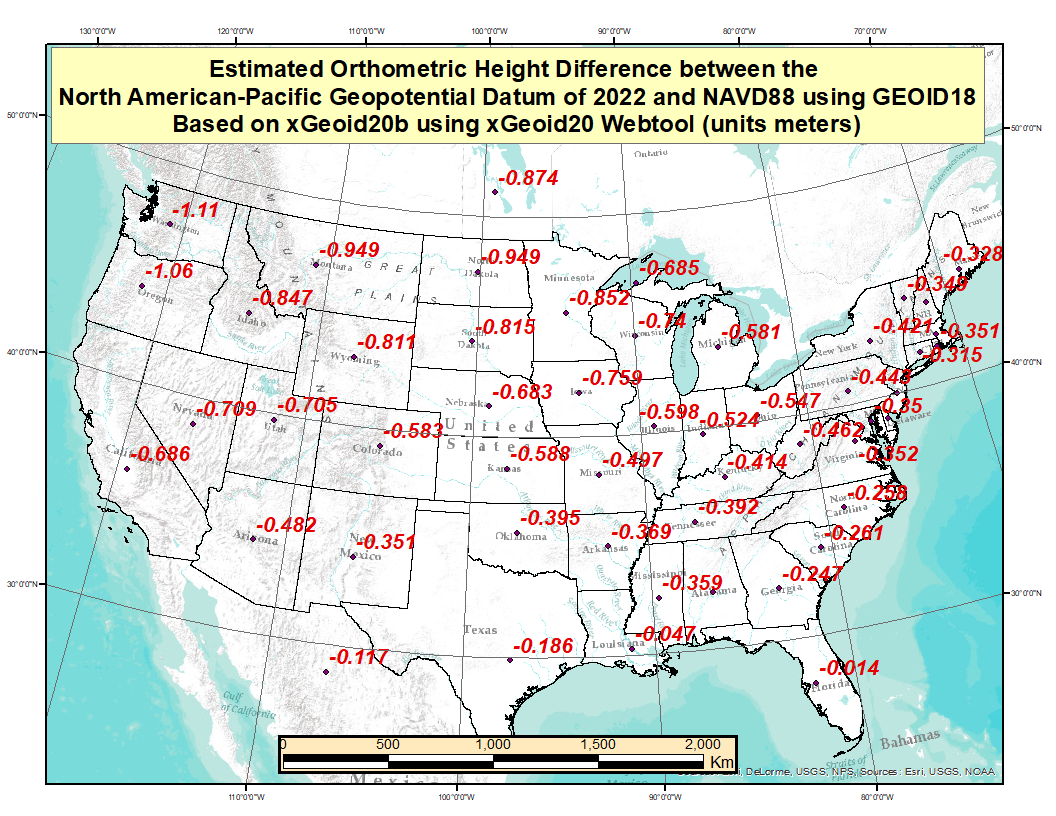
    These figures provide a broad picture of the change but to better understand the changes across the Nation, I used the GPS on Bench Mark dataset, that was involved in the creation of Geoid18 model, to compute an average latitude, longitude, and ellipsoid height for every State. Obviously, this is a fictitious mark but it provides an idea of the average change based on marks that have both a GNSS-derived ellipsoid and a leveling-derived orthometric height. The plot titled “Difference Between the Future NAPGD2022 and NAVD 88” depicts the average difference for each state based on the GPS on Bench Mark data file. These differences were generated using the xGeoid20B values from the output of the xGeoid20 website.

    Difference Between the Future NAPGD2022 and NAVD 88. (Image: NGS)
    Difference Between the Future NAPGD2022 and NAVD 88. (Image: NGS)

    I would encourage everyone to select a couple of marks and compute the differences to understand the change in their particular region. I was the NAVD 88 Project Manager and I informed users of the potential changes between the NGVD 29 and NAVD 88 for about a decade, and I still had surveyors tell me that they didn’t know it was coming. Please take a few minutes to read NGS’ write up on xGEOID20, estimate the differences in your area of interest, and spread the word to your colleagues, friends, and clients.

    The last item that I’d like to highlight is that NGS has released a beta version of a surface gravity model consistent with xGEOID20. See the box titled “Experimental Surface Gravity Model 2020 (xGRAV20).” Users can access the beta webtool here.

    Experimental Surface Gravity Model 2020 (xGRAV20). (Image: NGS)
    Experimental Surface Gravity Model 2020 (xGRAV20). (Image: NGS)

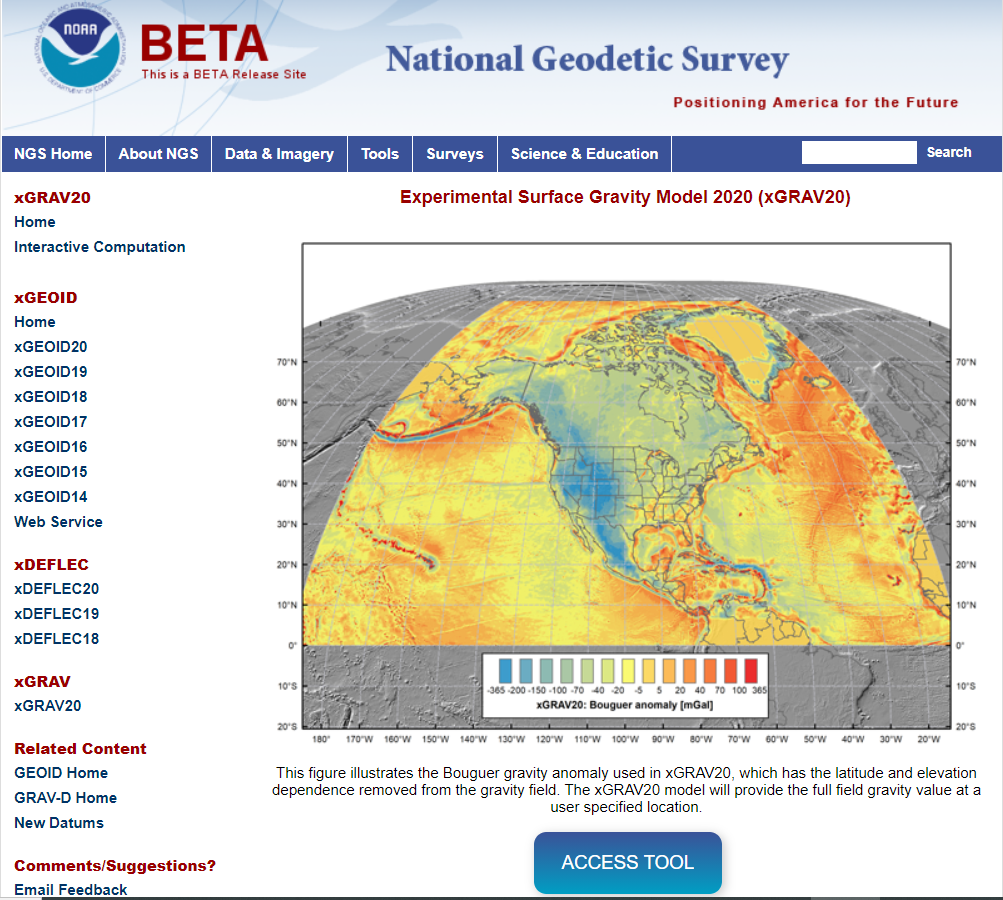
    The access and input to the tool is similar to the xGEOID20 web tool. Saying that, I’d like highlight a few items:

    • The input height should be an orthometric type of height not an ellipsoid height.
    • If a height is entered, the tool will assume that is correct and use it for the gravity prediction.
    • If you do not know the elevation, leave the entry blank. The tool will use the DEM interpolated height if it is blank.
    xGRAV20 Interactive Computation Page. (Image: NGS)
    xGRAV20 Interactive Computation Page. (Image: NGS)

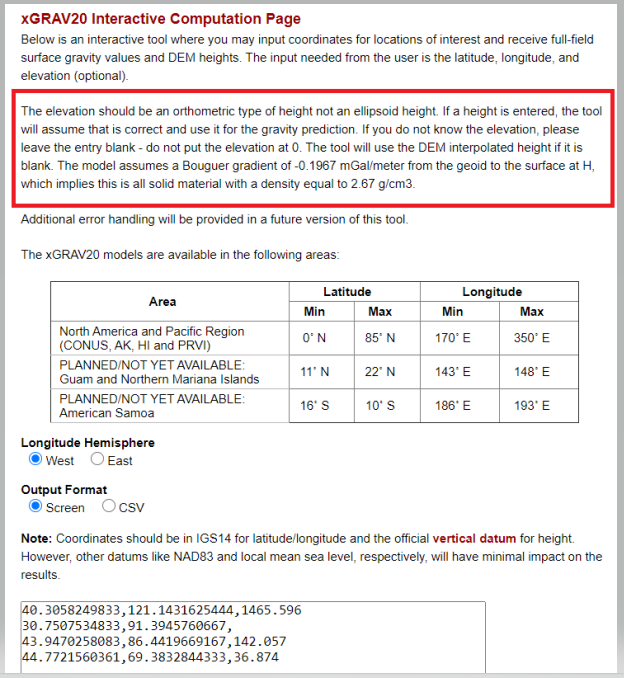
    The box below provides the output using the tools sample data.

    Output from Screen Output Format from xGRAV20 Tool. (Image: NGS)
    Output from Screen Output Format from xGRAV20 Tool. (Image: NGS)

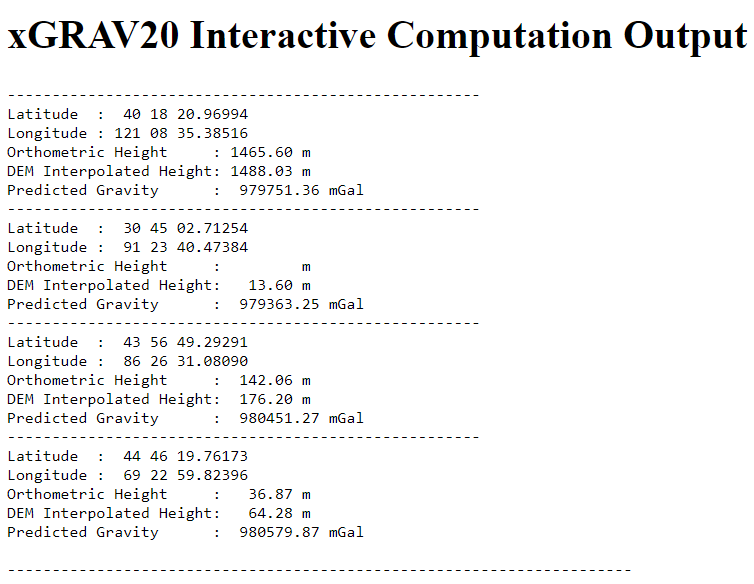
    This gravity tool will be important when users want to incorporate leveling-derived orthometric heights into NAPGD2022. We will address this tool in more detail in future newsletters. I want to emphasis that these two web tools are beta sites. As a beta site, users should verify all information from the site. I encourage everyone to access the tool and check out a few of their favorite marks, and then send an email to NGS informing them of what you like, what you would like to change, and what you would like to see added to the tool.

    NGS is releasing this tool as a beta product to get feedback from users. They are interested in your feedback concerning its function and usability as well as how users would like to interact with NGS web tools in the future. Email NGS at [email protected].

    In conclusion, I want to leave you with a thought about change. When I give presentations and seminars, I usually include a slide that probably expresses the thoughts of many individuals.

    My brother once told me:

    “If you geodesists did it correctly the first time you wouldn’t have to keep performing adjustments and changing the values. Just do it right the first time.”

    He’s a doctor and said he must do it right the first time.

    My response to my brother and to everyone else is the following:

    If you want to improve you have to be willing to change, and if you want to continue to meet future positioning requirements you need to continually change.

    Winston Churchill said it better “To improve is to change; to be perfect is to change often.”

  • A look at NGS’ experimental and hybrid geoid models

    A look at NGS’ experimental and hybrid geoid models

    On Aug. 10, the National Geodetic Survey (NGS) released its latest experimental geoid model, xGeoid18. In early 2019, NGS is scheduled to release its next hybrid geoid model, Geoid18.

    NGS’ 2018 experimental geoid model, xGeoid18, and the next hybrid geoid model, Geoid18, are not the same. This column will address the latest experimental geoid model, xGeoid18, and the future hybrid geoid model, Geoid18, and why it’s important to understand that they are very different and cannot be interchanged.

    In my October 2015 column, I described the differences between NGS’ hybrid geoid models and their experimental geoid models. It has been three years since I wrote the newsletter that addressed the differences between the experimental geoid model and hybrid geoid models. NAPGD2022 is now only about three years away. There will be significant differences between NAVD 88 and NAPGD2022 height.

    My June 2017 column provided an estimate of the differences based on the 2016 experimental geoid model, xGeoid16b. These differences between NAVD 88 and NAPGD2022 will vary from state to state, as well as within an individual State. Products referenced to NAVD 88 will be different from products referenced to NAPGD2022. Users will need to prepare for the NAPGD2022 and develop implementation plans. Users should obtain an understanding of the differences between NAPGD2022 and NAVD 88.

    NGS has a webpage that provides information on all of their experimental geoid models. It page provides information on the development of the program and information on each of the experimental geoid models.

    NGS’ Experimental Geoid Website

    Photo: National Geodetic Survey Photo: National Geodetic Survey. Click to enlarge.

    If the user clicks on the xGeoid18 button (see orange arrow in the box titled “NGS’ Experimental Geoid Web Site”), the experimental geoid model xGeoid18 web page appears (see box titled “NGS’ Experimental Geoid Models 2018 Web Site”).

    NGS’ Experimental Geoid Models 2018 Website

    Photo: National Geodetic Survey

    Once users get to the xGeoid18 web site, they can obtain estimates of xGeoid18 values for any latitude and longitude by clicking on the button titled “Interactive Geoid Computation.” See red arrow in box titled “NGS’ Experimental Geoid Models 2018 Web Site.”

    Input Page of xGeoid18 Interactive Web Page Using the Sample Dataset

    Photo: National Geodetic Survey

    Users should note that the output of the xGeoid18 interactive web service provides the results in IGS08 epoch 2022.00. The output provides an estimate of the NAVD 88 orthometric height based on GEOID12B, an estimate of the NAPGD2022 orthometric height based on xGeoid18b, and the difference between NAPGD2022 and NAVD 88. The box titled “Output from xGeoid18 Interactive Web Page Using the Sample Dataset” shows the output from the interactive web service using the sample dataset provided by the web service.

    The sample dataset has four stations — a station in California, Louisiana, Michigan and Maine. The results indicate that the differences will vary from state to state — the difference between NAPGD2022 and NAVD 88 in California using xGeoid18b is -0.722 meters, in Louisiana the difference is -0.274 meters, in Michigan the difference is -0.646 meters, and in Maine the difference is -0.307 meters (see box titled “Output from xGeoid18 Interactive Website Using the Sample Dataset”). More detailed estimates of differences between NAPGD2022 and NAVD 88 based on xGeoid16b can be found in my June 2017 column.

    Output from xGeoid18 Interactive Website Using the Sample Dataset

    Note: The GRS80 ellipsoid is used for both NAD83 and IGS08.

    Data: National Geodetic Survey

    Data: National Geodetic Survey

    Users can find technical information on xGeoid18 by clicking on the link labeled as Technical Details on the xGeoid18 website (see blue arrow in box titled “NGS’ Experimental Geoid Models 2018 Web Site”). The box titled “Excerpt from Technical Details for xGEOID18 Models” provides an excerpt of the technical details of xGeoid18.

    Excerpt from Technical Details for xGEOID18 Models

    Summary
    xGEOID18 is identical to xGEOID17 in the area bordered by 5˚ ≤ φ ≤ 85˚, 170˚ ≤ λ ≤ 350˚, which includes CONUS, Alaska, Hawaii, and Puerto Rico. Therefore, for information on xGEOID18 in those areas, the user should refer to the Technical Details of xGEOID17.

    For extended areas down to the equator and above latitude 85˚ north, the geoid is computed from the NGA’s Preliminary Geopotential Model 2017 (PGM17).

    The geoid models for Guam/central Northern Marianas Islands and American Samoa are computed in the closest way as xGEOID17 using the shipborne gravity, altimetric gravity and the reference gravity model PGM17.

    The deflections of the vertical are computed from all the geoid grids and the plumb curvature correction is applied by using the classical Bouguer reduction.


    As the technical detail webpage states, xGEOID18 is identical to xGEOID17 in the area bordered by 5˚ ≤ φ ≤ 85˚, 170˚ ≤ λ ≤ 350˚, which includes CONUS, Alaska, Hawaii and Puerto Rico. Therefore, for information on xGEOID18 in those areas, the user should refer to the Technical Details of xGEOID17. The box titled “Excerpt from Technical Details for xGEOID17 Models” provides an excerpt of the technical details of xGeoid17. This link provides figures that show the contribution of the airborne gravity data to the geoid models. See boxes titled “Excerpt from Technical Details for xGEOID17 Models” and “Figure (2,3,4,5) from Technical Details for xGEOID17 Models.” As stated in the technical details, users can examine each of the regional plots to see where the incorporation of GRAV-D data has changed the values of the xGeoid17B model.

    Excerpt from Technical Details for xGEOID17 Models

    GRAV-D Airborne Gravity Contribution

    The xGEOID17A and xGEOID17B models are identical except that xGEOID17B includes the available GRAV-D airborne gravity data. The difference between the two models shows the contribution of the airborne gravity data to the geoid models. Since the differences are only in areas where the GRAV-D airborne gravity data has been used, examining the regional plots given below will illustrate the varying levels of improvement due to GRAV-D, seen in different parts of the country.

    Photo: National Geodetic Survey

    Figure 1. CONUS – Contribution of GRAV-D airborne gravity [units in cm]

    Figure 2 from Technical Details for xGEOID17 Models

    Photo: National Geodetic Survey

    Figure 2. Alaska – Contribution of GRAV-D airborne gravity [units in cm]

    Figure 3 from Technical Details for xGEOID17 Models

    Photo: National Geodetic Survey

    Figure 3. Gulf Coast – Contribution of GRAV-D airborne gravity [units in cm]

    Figure 4 from Technical Details for xGEOID17 Models

    Photo: National Geodetic Survey

    Figure 4. Northeast – Contribution of GRAV-D airborne gravity [units in cm]

    Figure 5 from Technical Details for xGEOID17 Models

    Photo: National Geodetic Survey

    Figure 5. Pacific Coast – Contribution of GRAV-D airborne gravity [units in cm]

    What does mean to a user today? A station can now have a published ellipsoid height, modeled GEOID12B value, a published NAVD 88 orthometric height, and several xGeoid modeled values. This can lead to confusion if the user is not careful about providing the correct metadata associated with their data and results.

    The box titled “Excerpt from The NGS Data Sheet for Station E 116 (PID GA0589)” provides the output from NGS data sheet retrieval program. The first item to note is that if you compute the GNSS-derived orthometric height (HGNSS) using the formula:

    Equation: National Geodetic Survey Equation: National Geodetic Survey

    the computed value does not equal the published NAVD 88 leveling-derived orthometric height. In this example, the two heights differ by 2.3 cm. As explained in a previous column, GEOID12B is a hybrid geoid model that is distorted to be consistent with NAVD 88 published heights. It is a model and the documentation states that “The relative accuracy of GEOID12B to NAVD88 is characterized by a misfit of +/-1.7 centimeters nationwide.” The box titled “Excerpt from The NGS Data Sheet for Station E 116 (PID GA0589)” provides the computations and the results.

    Excerpt from The NGS Data Sheet for Station E 116 (PID GA0589)

    Data: National Geodetic Survey

    Users can also obtain a xGeoid18B value for the station. The box titled “xGeoid18 Output for Station E 116 (PID GA0589)” provides the output of the xGeoid18 using NGS’ xGeoid18 interactive web service. It should be noted that the xGeoid18 output only provides the NAVD 88 orthometric height using GEOID12B; it does not include the published NAVD 88 orthometric height from the NGS Datasheet.

    xGeoid18 Output for Station E 116 (PID GA0589)

    Note: The GRS80 ellipsoid is used for both NAD83 and IGS08.
    Data: National Geodetic Survey

    The box titled “Different Height Values for Station E 116 (PID GA0589)” provides three different height values that are currently available from NGS web services. These different heights could lead to confusion if users are not careful. Most users won’t be using the experimental geoid interactive web service to compute an estimate of an orthometric height but all users should provide the appropriate metadata to avoid any confusion.

    Different Height Values for Station E 116 (PID GA0589)

    Chart: National Geodetic Survey Chart: National Geodetic Survey

    The hybrid geoid model GEOID18 is currently being developed and is not ready to be published, but there is a web page that highlights that it will replace GEOID12B in early 2019 [see box titled “Hybrid GEOID18 Website“] GEOID18 values will be similar to GEOID12B because both hybrid geoid models are made to be consistent with published NAVD 88 values. Saying that, there will be differences especially in areas where the GPS on BMs program identified stations that have moved since the last time they were leveled and, therefore, they were not used in GEOID18.

    Hybrid GEOID18 Website

    Photo: National Geodetic Survey Photo: National Geodetic Survey

    My last column provided an update and status report on stations observed in support of the 2018 GPS on BMs program. Many stations with potential invalid published orthometric heights have been identified by the GPS on BM program. This information will be very useful to the surveying and mapping community as well as to NGS. Once NGS publishes the next hybrid geoid model, GEOID18, OPUS results will probably provide an estimate of the NAVD 88 orthometric height computed using GEOID18 similar to what it does now using GEOID12B. In my opinion, the results of GEOID18 will be better than GEOID12B in most areas of the United States and will be helpful in identifying stations that have moved since they were last leveled.

    NGS’ official date for accepted data for inclusion in the next hybrid geoid model, GEOID18, ended September 21, 2018. Continuing to submit your results to OPUS Shared will provide a way for others to analyze the results to determine whether a station has an issue that requires attention. New OPUS shared results will be very useful for evaluating the reliability of the model. After the hybrid geoid model, GEOID18, is published, NGS’ GPS-on-Bench-Mark Program will expand to include other regions and will focus on data to improve NGS datum transformation tools. Further columns will address differences between GEOID12B and GEOID18 after GEOID18 officially replaces GEOID12B.