[SPONSORED CONTENT] Frontier Precision Unmanned is revolutionizing geospatial surveying by integrating advanced drone technology into various industries such as mining, construction, and agriculture. Their innovative unmanned aerial systems (UAS) enable professionals to conduct high-precision aerial surveys efficiently and safely. By offering industry-leading products and software from manufacturers like DJI Enterprise, Quantum-Systems, and YellowScan, Frontier Precision Unmanned ensures that clients receive tailored solutions for their specific applications. These applications encompass geospatial surveying, mapping, infrastructure inspection, and environmental monitoring.
In their promotional video, Frontier Precision Unmanned showcases the transformative impact of drone technology on traditional surveying methods. The video highlights how drones facilitate rapid data collection, producing deliverables such as point clouds, digital surface models, and orthomosaic imagery. These advancements not only enhance accuracy but also significantly reduce the time and costs associated with conventional surveying techniques. Frontier Precision Unmanned’s commitment to providing cutting-edge UAS solutions empowers surveyors and GIS professionals to embrace modern technology, ensuring projects are completed with greater precision and efficiency.
All construction work begins with surveying to map the site and generally ends with surveying to document what was done on it — called “as built.” Therefore, surveyors are the first to arrive at a construction site, well before the first heavy machinery, and the last ones to leave, well after the construction crews have left with their equipment. During construction, surveyors get to work any time there are changes in the plans.
Surveyors are not the only ones to use survey-grade GNSS receivers on a construction site, though. GNSS for machine control is increasingly common on excavators, graders, dozers and other heavy machinery. It enables operators to achieve accurate earthmoving and grading operations with minimal manual intervention, significantly improving efficiency and reducing rework by providing real-time positioning data based on 3D design models. Additionally, a dedicated display in the cab allows operators to see a visual representation of the machine’s position relative to the design model and to make adjustments in real-time.
This month’s cover story features case studies from four companies:
CHC Navigation (CHCNAV) on grading for an airport construction project in Shanghai, China.
ComNav Technology on a river flow monitoring system to mitigate the effects of flooding in Japan.
Nearmap on solving the stormwater challenges of a small town in Michigan.
Frontier Precision on the repair of a canal in Montana in very challenging conditions.
Construction of a building cannot begin until the ground is level and matches the design so that it can bear the weight of the planned structure. At times, part of the ground needs to be sloped to ensure proper drainage or to meet the aesthetic needs of the project. However, the ground at a construction site is often uneven and/or sloped the wrong way. Therefore, a critical phase of any AEC project is grading, which is a specialized phase of the construction process that uses machinery such as graders, bulldozers, excavators, and dump trucks to move and shape large amounts of earth.
Traditionally, grading involved the use of string lines and optical levels, which are still valuable for smaller projects. These tools provide a visual reference for achieving the desired slope and allow for manual adjustments as needed. Modern construction practices rely on laser levels — which provide accurate measurements, ensuring a consistent slope — and, increasingly, on GNSS receivers, which aid in precise grading, especially in large-scale projects.
In a recent project to build an apron — a paved area where aircraft are parked, loaded, unloaded, refueled and boarded, also known as the ramp, flight line or tarmac — as part of the expansion of Shanghai Pudong International Airport, the construction company adopted CHCNAV’s i93 GNSS receiver solution. The project, by a large state-owned construction company, began at the end of July 2024 and is expected to take two years to complete. By directly loading the designed triangulated terrain model (TTM) for surface stakeout, the project managers were able to visualize the cut-and-fill values at any location in real time. This approach doubled the stakeout efficiency and significantly improved the quality of site grading.
Project challenges and solution
The airport project covered approximately 360,000 m², demanding high-precision grading. Traditional surveying methods could only verify cut-and-fill heights at grid nodes, failing to effectively cover areas between these nodes. This limitation increased the risk of uneven construction and restricted the comprehensiveness of elevation data. Additionally, the traditional stakeout process was cumbersome and inefficient, requiring point selection before stakeout. To overcome these challenges, the construction team needed a surveying solution that could significantly enhance stakeout efficiency while improving grading precision and construction outcomes.
The construction team used the CHCNAV i93 GNSS receiver and LandStar field survey APP. By using the surface stakeout function for site grading, it was able to load the TTM generated from design data directly into the LandStar software, simplifying the grading process. The software enabled surveyors to obtain cut-and-fill values at any location in real time, thereby eliminating reliance on grid nodes and enabling dynamic verification across the entire site for higher grading precision. Lastly, the solution doubled the stakeout efficiency by reducing the steps of selecting feature points before stakeout.
Using CHCNAV’s Satellite Wide Area System (SWAS) corrections network, a global system that offers users fast and precise centimeter-level positioning services, the surveyor was able to achieve an elevation accuracy of -3 cm ~ +2 cm. SWAS covers most of the inhabited areas in China and is expanding its network globally. CHCNav’s satellite Precise Point Positioning service is being developed and tested; it will become part of the SWAS service in the future. The surveyor guides the site grading by comparing the difference between the elevation in the design plans and the measured elevation. Therefore, when the site grading is complete, it should match the design plans.
Conclusions
“The project involves large areas of earth excavation and levelling,” said Yang, the chief of the survey team. “In the past, we had to stake out all the points of the grid after getting the design drawings, and then calculate the elevation difference of each point. If there were some special points, we also had to calculate their positions in the grid. Now, in LandStar 8, we can directly convert the grid drawing into a TTM file and stakeout, which makes it easy for us to set the elevation difference at any point without the limitation of the grid. This increased efficiency accelerated the progress of the project and reduced our workload.”
The adoption of CHCNAV’s surveying and construction solution significantly accelerated the project’s site grading work. This task, which traditionally would have taken about one month to complete, was fully accomplished in just half a month. During the project acceptance phase, the results met all design requirements and passed inspection smoothly. The construction unit reported that the CHCNAV i93 GNSS receiver and LandStar field survey APP greatly enhanced the efficiency and accuracy of the site grading portion of the construction project.
It is essential to take effective measures to mitigate the effects of natural disasters — such as earthquakes or hurricanes — and to prevent them when possible, such as sometimes with floods. This involves multiple aspects, including the development and rehearsal of emergency plans, the construction and reinforcement of infrastructure, and the monitoring of environmental changes. By identifying potential disaster risks and taking preventive actions, the damage caused by these disasters can be significantly reduced and the resilience of communities and cities can be enhanced, thus better preparing for future catastrophes.
How can these disaster mitigation and prevention measures be specifically implemented? First, by creating detailed emergency plans and conducting regular drills, which ensures a quick and effective response during critical situations. Second, by reinforcing critical infrastructure, such as protective embankments and resilient systems, which strengthens the overall preparedness of both urban and rural areas. Moreover, monitoring environmental changes plays a pivotal role in prevention efforts. Real-time observation systems, including advanced sensors and data integration platforms, enable the early detection of potential risks. This facilitates timely preventive actions, minimizing losses with optimal efficiency and resource utilization.
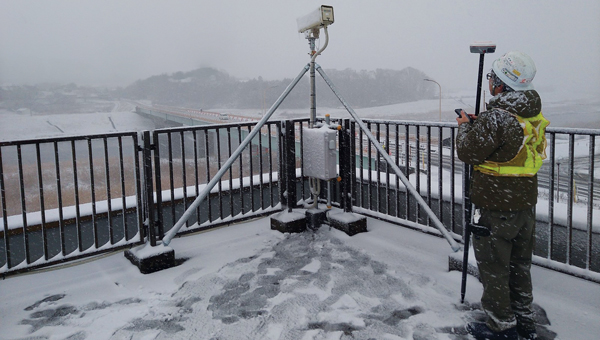
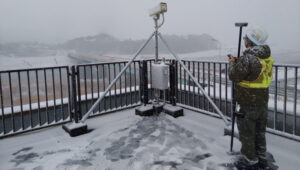
Mars Pro Laser RTK was used to precisely measure the positions of monitoring cameras in the Abukuma River basin.(Photo: Geosurf Corporation)
Monitoring systems
A key aspect of flood defense and disaster prevention is the establishment of monitoring systems and the enhancement of safety measures. In the Abukuma River basin, which flows through Fukushima and Miyagi prefectures in Japan, a flood monitoring system has been built that combines data from water level meters with real-time information on changes in water levels due to natural events such as typhoons. This provides residents with immediate visual updates to help them respond effectively.
ComNav Technology’s Mars Pro Laser RTK has played an important role in this flood prevention and disaster monitoring project. By using the device, which integrates advanced GNSS, IMU, and laser technologies, a team from Geosurf Corporation was able to accurately determine the locations for installing surveillance cameras, ensuring real-time monitoring of water flow conditions, and providing early warnings for natural disasters such as floods. The locations of these cameras typically include areas with a high risk of riverbank collapse, water level observation stations, and other critical spots that require close monitoring.
In the past, this task would have required using a total station. However, using Mars Pro’s very precise green laser, the crews were able to measure the locations of offset points that did not have a clear view of the sky, which is required to receive GNSS signals.
Centimeter-level accuracy
The green laser, which is visible in daylight, enabled the crews to achieve centimeter-level accuracy at any point within a range of 10 meters. They were also able to use its 120-degree tilt compensation feature to drive the stakes efficiently closer to the target point without worrying about leveling. During the RTK positioning process, the team used reliable correction information sources and precise post-processing analysis methods, ensuring that the measurement point consistency was maintained within 2 cm to 3 cm, thus ensuring high accuracy and consistency of the measurement results.
Positioning surveillance cameras in the Abukuma River basin required measuring not only their placements but also the reference points within their coverage areas. Beyond its convenience and reliability, the Mars Pro Laser RTK and its paired software, Survey Master, simplified the survey workflow by using wizard functions. Specifically, the procedure is to follow the instructions of the surveillance camera monitor to move onto the centerline and use the program’s Angle Offset Calculator to calculate the coordinates of a reference point at ±90 degrees to the line segment. Survey Master’s simple survey calculation tool eliminates the need to launch a CAD program in the field, making the staking more efficient.
For the correction information in RTK positioning, Geosurf Corporation used ichimil, a high-precision positioning service provided by Softbank. Geosurf also acquired raw data for post-processing at several locations at the same time and analyzed the measurement points using coordinate results from Japan’s Geospatial Information Authority.
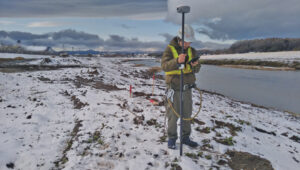
The surveyor used Mars Pro Laser RTK and Survey Master software to measure the reference points within coverage areas of surveillance cameras. (Photo: Geosurf Corporation)
Conclusions
The monitoring system combines water level data collected from devices such as water level meters with changes in water levels caused by natural events such as typhoons, providing real-time visual information to residents. This allows them to stay informed about current water levels, identify potential flood risks early, and take appropriate preventive measures, effectively reducing disaster risks and safeguarding lives and property. More than 100 surveillance cameras have been installed so far in the Abukuma River and its associated watershed.
Through this project, Mars Pro Laser RTK not only enhanced emergency response capabilities but also showcased the versatility of laser RTK technology in disaster prevention and mitigation applications. Climate change is increasing the damage caused by typhoons and torrential rains worldwide. As a result, the demand for such monitoring systems is expected to grow. ComNav Technology plans to further improve user experience by integrating laser technology with additional sensors and developing more innovative tools to address future disaster prevention needs.
While surveyors are typically the first to begin working on a construction site, but they do not start completely from scratch. As a basemap for their measurements, they often use satellite and aerial imagery, the latter collected by planes and UAVs — the same imagery used in geographic information systems (GIS) by governments at every level and private companies to plan, build, and manage buildings and infrastructure. These data include high-resolution orthimages, which are taken pointing straight down at the ground and adjusted to have a constant scale of distance across them; oblique images, which can offer an alternative view of the landscape and structures where height is important; 3D datasets, including digital elevation models and models of buildings, collected using lidar; and AI-derived spatial information.
Additionally, historical imagery datasets document the evolution of land use over time and make it possible to compare conditions before and after natural disasters, such as floods and earthquakes, to expedite emergency response and reconstruction planning.
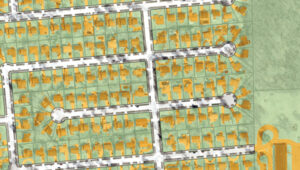
An aerial image of southfield, Michigan, from Nearmap’s natural pervious surface AI data layer. (Photo: Nearmap)
Stormwater utilities project
With a diverse population, more than 10,000 businesses, and a commitment to urban development, the City of Southfield, Michigan is known for its robust economy, thriving commercial centers, modern urban living and innovation. When it needed help to effectively manage its stormwater utilities, the city hired OHM Advisors. Founded in 1962 and with a multidisciplinary team of more than 700 experts, the firm provides consulting in the areas of architecture, engineering, planning, urban design, landscape architecture, surveying, and construction engineering. In turn, for this project, OHM Advisors used location intelligence from Nearmap, an aerial imagery company founded in 2007 that captures urban areas across the United States, Canada, Australia and New Zealand.
Initially, the city planned to have access to the Nearmap imagery for only a year, for use in its stormwater utilities project. However, once it realized how useful it would be across city departments and projects, it decided to continue buying it for the long term.
Aerial imagery
The City of Southfield is currently in the planning stages of considering a new initiative to assess stormwater fees based on the number of impervious surfaces — such as asphalt and concrete — which do not allow water to penetrate the ground, thereby contributing to increased runoff and straining municipal systems. However, the city is challenged by its limited budget for maintaining, let alone upgrading, its stormwater infrastructure. Additionally, the aerial imagery it had was old and one-time flyovers of the small city to update the imagery would have been prohibitively expensive, costing up $100,000.
By purchasing high-resolution aerial imagery (captured up to three times a year), geospatial data, and AI feature layers from Nearmap, as recommended by OHM, the city was able to efficiently map impervious surfaces and readily view, identify, and verify stormwater utilities at scale. This enabled the city to develop a highly accurate and equitable system for assessing fees based on near-real-time data. It also improved the precision and efficiency of its urban planning; enabled city planners to complete tasks remotely, spending less time in the field; and updated the imagery in its GIS.
Business impact
Using current aerial imagery, geospatial data, and AI data, Nearmap and OHM identified every impervious surface in the city, enabling Southfield to:
Accurately assess stormwater fees. Analysis of Nearmap imagery and AI data allowed OHM to tie impervious surface area to stormwater fees and establish a precise, data-backed fee structure that bolsters the city’s infrastructure funding.
Reduce costs. Nearmap offered a cost-effective alternative to traditional data collection, drastically reducing the city’s expenditure without sacrificing data quality.
Enhance urban planning. Access to Nearmap facilitated remote decision-making, allowing Southfield to optimize its urban planning.
Maintain consistent data. OHM and Nearmap led to the resolution of Southfield’s data discrepancies, ensuring reliable insights for future planning.
Conclusions
“Using the high-quality Nearmap AI data allowed the OHM Advisors’ GIS team to efficiently and effectively map out the impervious surfaces for the city,” said Mike Cousins, GISP, practice leader for GIS at OHM Advisors. “Having high-resolution and very recent imagery to pair with the impervious surface data helped with the analysis portion of the project at hand.” The collaboration between OHM Advisors and Nearmap marked a significant change in Southfield’s approach to stormwater management, illustrating the potential of advanced technology to improve urban governance.
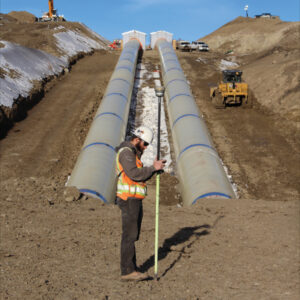
The St. Mary Canal and siphon were completed in 1915 as part of the Milk River Project in North-Central Montana. The canal has delivered water to 110,000 acres of agricultural land in eastern Montana for 109 years. In June 2024, the siphon had a catastrophic blowout when both 90-inch siphon pipes failed, releasing 600 ft³ of water per second for more than 24 hours.
The stakeholders involved quickly went to work on a solution to replace the two siphon pipes. By mid-July, NW Construction, Inc. was brought on site to begin demoing and replacing the siphon. The company uses Frontier Precision as its supplier for all its surveying equipment. Utilizing a mix of GPS machine control, geospatial survey equipment, aerial drone surveys and CAD software, NW Construction will work through the blistering Northern Montana winter to restore the siphon in time for the 2025 irrigation season.
The harsh environment and speed of the project pose tough conditions for surveying. Winds regularly reach 60 mph with gusts up to 80 mph and temperatures go well below freezing for most of the winter. The surveyors on this project will have to overcome the challenges that come with this weather and the remoteness of the project.
The project has about six excavators, including two with tilt rotators, and four dozers, all equipped with GNSS machine control. “Everything we do is completely modeled for those guys through civil 3D and Trimble Business Center,” said Kenny Neskorik, project engineer for Northwest Construction. The GNSS receivers on the earth movers are running RTK as rovers and there is a single base receiver. “When we do any sort of concrete work for this project, we will also set up a robotic total station,” he said.
Additionally, the project uses a DJI Mavic UAV to collect aerial photogrammetry of such things as finished excavation and original ground stockpiles.
Requirements
The requirements for this project are atypical, Neskorik explained, due to its emergency nature. “The design and the construction are going on at the same time through two different entities,” he said. “My company is not the engineering firm stamping the plans. We’re the ones doing the work. I
could almost describe it as a design build, in which the contractor and the engineer meet in the middle to get the best product in the fastest way.”
The project’s biggest requirement is to get water back to the eastern part of the state by summer, when it will be needed to irrigate crops. “To do that,” Neskorik said, “we had to set control.” Because the project is only a few miles from the Canadian border, however, the power of radio broadcasts is restricted to only 2 Watts instead of the usual 35 Watts on RTK radios. “That really hurts your range to talk to your base,” he said. This required setting up several relay repeaters, especially since there’s almost no cell phone service in Montana
Challenges
An additional challenge is the solar cycle, which is nearing its peak. “We have noticed lots of Northern Lights, lots of auroras,” said Neskorik, “but we haven’t seen too many disruptions yet.”
Finally, the biggest challenge is the weather. “We’ve already had probably cumulatively two feet of snowfall,” said Neskorik. “Thankfully, some of that has already melted, but this area is one of the colder parts in the United States.” Browning, he pointed out, is just 30 minutes south of us, holds the world record for fastest temperature change in 24 hours — from 56 degrees Fahrenheit to negative 46 degrees. It’s not uncommon to see negative 50 degrees. “At that temperature, your batteries die really fast, you cannot use touch screens, and you have to drill to set stakes in the frozen ground is frozen. We’ve already experienced winds at nearly 80 miles an hour and that is pretty much how it goes for the entire winter. So, as you can imagine, it’s not an easy task flying a drone around here.”
Accuracy
“Our company standard for any excavator or dozer is an accuracy of one tenth of a foot,” said Neskorik. “We want our GPS rovers to have a vertical tolerance below 5/100s of a foot. Realistically, you’re probably getting a 1/10 of a foot. You cannot have any major fluctuations in the dirt because the pipe sits directly on it.” This all must happen in real time because there is no post-processing. “Everything is modeled and the machines are running on a model. We’re checking their grades as they’re doing the work.”
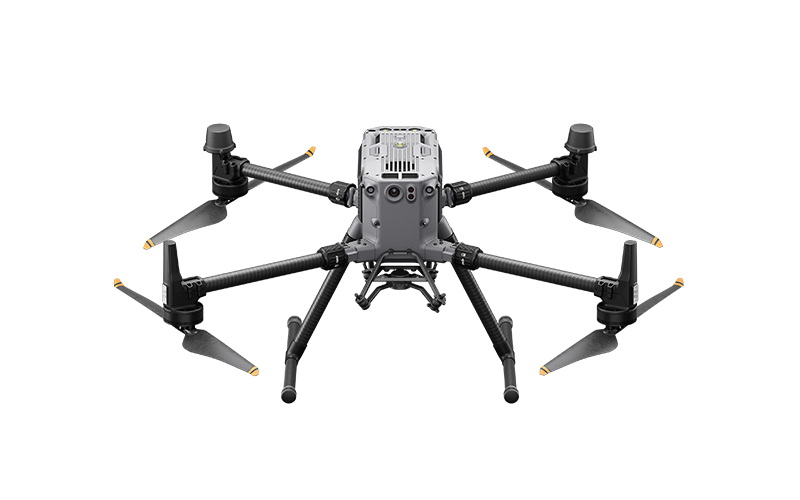
Frontier Precision has announced the availability of an upgraded flagship UAV platform, the Matrice 350 RTK.
This UAV platform features a new video transmission system and control experience, an efficient battery system, and more comprehensive safety features. It also offers robust payload and expansion capabilities.
The Matrice 350 RTK has a 55-minute max flight time and an IP55 rating. It features six-directional sensing and positioning, as well as a night-vision FPV camera, and 400 battery cycles.
The Frontier Precision 2021 TechXpo User Conference takes virtual its popular and informative in-person user conferences, sponsored by Frontier Precision for the past two decades. The conference will take place March 30-April 1, 11 a.m. to 5.pm. Central Daylight Time.
During the 2021 TechXpo, participants can engage in more than 70 webinars, live question-and-answer sessions, daily prizes and a virtual trade show with more than 15 industry vendors such as Trimble, DJI, Yellowscan and more.
Participants will learn new ways to measure, with a wealth of knowledge to be learned and shared, the company said.
“We’ve continued to take our core values of customer service and training, and be the first to bring new technology to the customer as a basic part of our DNA as a company,” said Dennis Kemmesat, Frontier Precision president and CEO.
The virtual conference is highly interactive, making information and technology accessible from a desktop whether in another city, another state, or somewhere on the other side of the world.
The three-day conference will explore the best technology from the engineering, land survey, geospatial information systems (GIS), construction and unmanned aerial system (UAS) industries.
The $49 registration includes 30-day access to recordings.
About Frontier Precision. Frontier Precision is an employee-owned company with 33 years of experience serving survey, mapping, engineering, construction, GIS, forensics, law enforcement, forestry, water resources, mosquito and vector control, and natural resources professionals.
As one of the top Geospatial Trimble dealers in the world, Frontier Precision has been at the forefront of technology. The company provides business solutions in the areas of UAS/drones, laser-based scanning, 3D visualization and virtual reality.
The company is headquartered in Bismarck, North Dakota, with locations in South Dakota, Minnesota, Colorado, Montana, Idaho, Oregon, Washington, Alaska and Hawaii.
A number of geospatial companies played a key role in the government’s response to the Kilauea Volcano eruption. The volcano on the Big Island of Hawaii began erupting May 3, and while quiet for more than a week, it could resume erupting at any time.
Mapping the flow. As a resident of Hawaii, Brennan O’Neill, Hawaiian branch manager of Frontier Precision, was in a unique position to offer support. Frontier Precision provided free access to technology and expertise to assist in mapping the lava flow.
“I had to help out,” O’Neill said. “It was tearing at my soul. For a geologist, it’s even more powerful than that. The lava flow is like a living mass that has a mind of its own, creeping, glowing — an upside-down conveyor belt surging forward and burning everything in its path.”
Through Frontier Precision, O’Neill offered high-tech mapping equipment, his own expertise, and the help of Nathan Stephenson, an applied geospatial engineer working in the company’s Denver office.
“We used a combination of Trimble R10s and Trimble R8s to gather accurate data points on the ground,” Stephenson said.
This thermal map shows the fissure system and lava flows as of 6 a.m. on Saturday, Aug. 11. The thermal map was constructed by stitching many overlapping oblique thermal images collected by a handheld thermal camera during a helicopter overflight of the flow field. The base is a copyrighted color satellite image (used with permission) provided by Digital Globe. (Map: USGS)
The mapping team flew UAS drones over the flow to gather visual imagery data, matched it to the ground reference points, stitched the photos together and draped it over county maps. The process was repeated as often as needed — daily, and sometimes even hourly — to show the speed and direction of the flow.
Stephenson isn’t new to mapping lava flows. As a graduate student at the University of Hawaii – Hilo, he worked on collecting data on the Pahoa eruption in 2014, and he’s seen advances in technology in just a few years.
“One thing we have now that we didn’t have in 2014 was a thermal radiometric camera that helps us map more accurately at night and enables us to capture large heat signatures.”
The collected data helps Hawaii Civil Defense and other agencies keep the public informed and safe, and in the long term it also contributes to the store of scientific knowledge about eruptions and lava flow behavior.
Lidar image of the Hawaii dataset showing the Kilauea Calderand the Halena’uma’u Crater and within it. (Image: Quantum Spatial)
Airborne lidar insights. Another technology that aids in volcano response is lidar. High-resolution lidar surveys help first responders, scientists and government agencies monitor Kilauea conditions and predict future lava flows.
Independent geospatial data firm Quantum Spatial Inc. (QSI) has conducted high-resolution lidar surveys of areas surrounding the Kilauea volcano eruption in Hawaii.
The emergency response effort was part of the U.S. Geological Survey’s (USGS) Rapid Response Imagery Products (RRIP) in support of the Kilauea’s 2018 East Rift Zone – Remote Sensing Acquisition Requirement.
The USGS Hawaiian Volcano Observatory (HVO), along with emergency responders, government agencies and academics, will use the data to better understand the conditions and characteristics of the volcano, and help planners model potential lava flows, which may better predict and respond to future flows and enhance safety of residents.
The QSI team, which included GEO1 and Windward Aviation, deployed within days to acquire high-resolution lidar at point densities averaging from 40 to 80 ppsm, with up to 150 ppsm in select areas and 100-mp digital imagery using a Riegl dual VUX-1 LR sensor pod equipped with ABGPS/IMU mounted on a Hughes 500D helicopter.
The project required 11 missions over the course of six days, operating at times as low as 500 feet above the ground and above active flows and nearby erupting calderas. With a need for a quick turn around, QSI deployed an analyst with the flight crew to post process each mission within hours of collection.
The data was uploaded to the Geospatial Repository and Data Management System (GRiD) interface, developed by the U.S. Army Corps of Engineers (USACE), where additional data products have been developed and provided to the response team that includes FEMA, Hawaii’s Emergency Operations Center (EOC) and the Hawaii County Civil Defense.
After data collection, QSI measured topographic shifts during the processing by comparing new data with a 2011 lidar collection from the same area. Survey specialists and USGS experts confirmed within hours of processing QSI’s lidar data that areas within the site had shifted up to 1.5 meters east, 2 meters to the north and 1 meter in elevation.
USGS scientists will continue to examine the new topographic data to better understand the nature of these shifts, and integrate it into lava flow models for more accurate predictive modeling.
The eruption in action. Using small unmanned aerial systems (sUAS) together with air-quality sensors, advanced imaging tools and Esri’s spatial analytics and mapping, a team from the Center for Robot-Assisted Search and Rescue (CRASAR) provided real-time aerial views of the eruption.
The five volunteers armed with drones, advanced sensor systems and GIS technologies joined the response effort May 14-19 at Kilauea Volcano Lower East Rift Zone to assist in tracking and predicting the ongoing volcanic eruption. The team supplemented the University of Hawaii Hilo’s (UHH) sUAS capabilities, allowing UHH sUAS operators to focus on geographical and volcanology.
The CRASAR team identified a new fissure not visible from the ground, projected the lava flow rate during the night when manned helicopters were not allowed to fly, and provided ongoing data collection from new thermal sensors technology.
During the six-day Leilani deployment, the CRASAR team flew 44 sUAS flights, including 16 at night, using DJI 200, 210, Inspire, and Mavic Pro drones. Esri’s Drone2Map for ArcGIS together with Hangar’s Enterprise Platform for 360-degree imaging enabled rapid 360-imaging for situational awareness.
DJI’s new XT2 thermal sensor provided unprecedented drone-based air-quality monitoring. Video and data were shared with local first responders using FirstNet, the first high-speed, nationwide wireless broadband network dedicated to public safety.
The CRASAR response marks the first known use of sUAS for emergency response to a volcanic eruption and first known use of sUAS for sampling air quality.
The GIS mapping and imaging technologies responders used on the scene at Kilauea Volcano Lower East Rift Zone are available here.