A roundup of recent products in the GNSS and inertial positioning industry from the July 2022 issue of GPS World magazine.
OEM
RTK Receiver
Hybrid high-precision GNSS
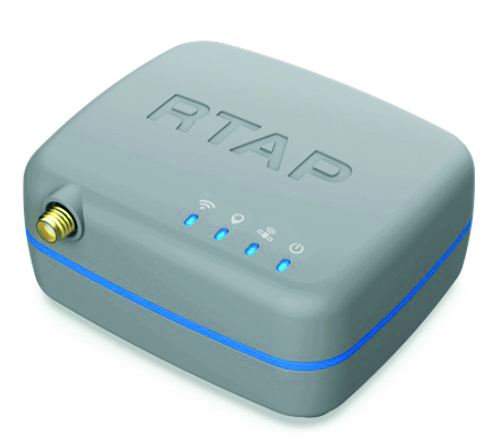
The handheld RTAP2U is a hybrid high-precision, dual-frequency GNSS receiver. It can receive and process GPS, GLONASS, BeiDou, Galileo and QZSS signals. Its user-friendly web interface accesses and configures signal reception, skyplot, data collection, stop-and-go surveying, map display and more. With u-blox’s ZED F9P module, RTAP2U provides 2 cm or better accuracy within a few seconds. A firmware upgrade can provide precise point positioning (PPP) and real-time kinematic (RTK) capability.
PP-Solution, ppsoln.com
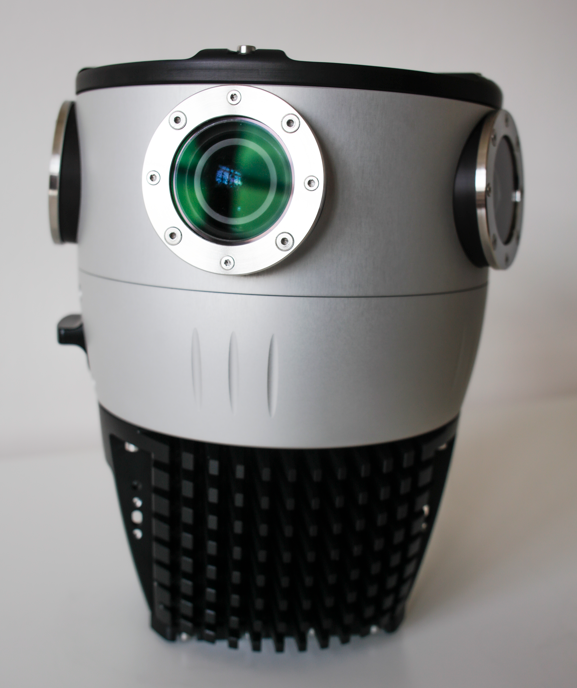
Marine Receiver
L-band corrections aid bathymetry, dredging
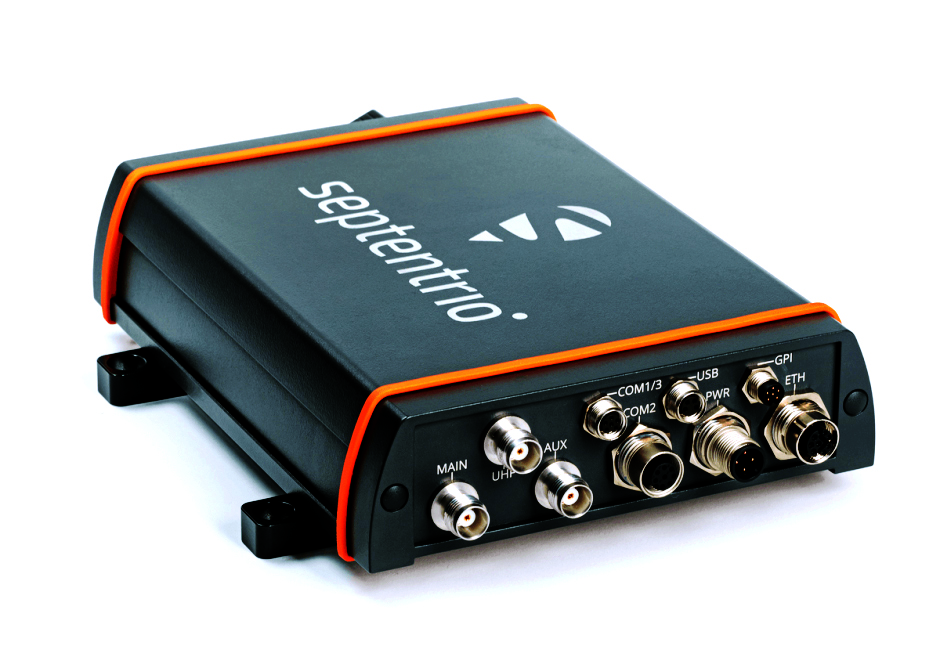
The AsteRx-U3 Marine GNSS receiver offers accurate positioning near shore and offshore via centimeter-level real-time kinematic (RTK) or the built-in Fugro precise point positioning (PPP) sub-decimeter subscription service, delivered either over NTRIP internet or L-band satellite. Corrections delivered over L-band allow dredging, bathymetry or marine construction projects even in areas where there is no internet service. The AsteRx-U3 Marine receiver, enclosed in an IP68-rated housing, offers a dedicated L-band demodulator with a separate L-band RF input, which allows for the use of dedicated antennas for excellent reception of L-band signals even at high latitudes.
Septentrio, septentrio.com
Navigation System
For air, land and sea vehicles and equipment
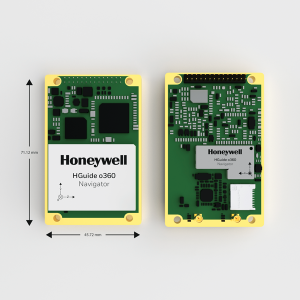
The HGuide o360 is a compact single-card, all-attitude GNSS/inertial navigation system (INS) that delivers accurate and robust position and attitude even in GNSS-challenged or denied environments to industrial and autonomous applications. The HGuide o360 contains a multi-frequency, multi-constellation, real-time kinematic (RTK) GNSS receiver with dual antennas, Honeywell’s i300 inertial measurement unit (IMU) technology, and a high-grade calibrated magnetometer. It is designed for platforms that require high-performance navigation data in an ultra-low size, weight and power (SWAP) package.
Honeywell, honeywell.com
Inertial Navigation System
Offers optimal heading performance and resistance to vibration
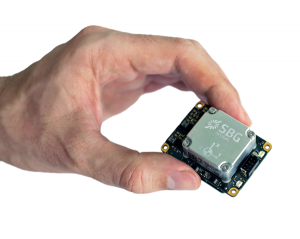
The Quanta Micro GNSS-aided inertial navigation system (INS) offers a high level of navigation performance despite its low size, weight, power and cost (SWAP-C). It brings direct georeferencing to UAV and land-based surveying. Quanta Micro leverages a survey-grade inertial measurement unit (IMU) for optimal heading performance in single-antenna applications, and high immunity to vibrating environments. An optional secondary antenna enables fast heading initialization in low dynamic applications.
SBG Systems, sbg-systems.com
Utility Time Server
Solution for power plants and substations
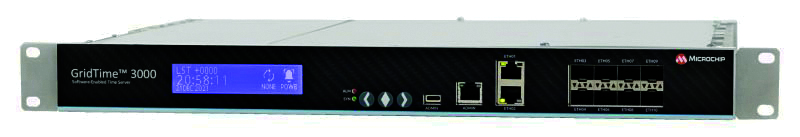
The GridTime 3000 GNSS time server is a software-configurable solution for utilities, providing redundancy, security and resiliency to protect against surges, adverse weather and cyberattacks. It generates precise time and frequency signals to synchronize analog and digital communication systems. The resilient timing platform incorporates multiple timing inputs for protection in the event of a GNSS signal disruption caused by severe weather, environmental disturbances or signal jamming or spoofing.
Microchip Technology, www.microchip.com
UAV
UAV Mapping Workflow
For high-precision mapping missions
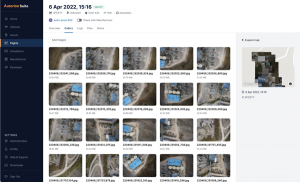
The Auterion OS serves enterprises that need component and payload flexibility, alongside a centralized and streamlined software workflow. Features include availability of precise mapping data in real time, automated processing for fast decision-making, standardization across Auterion-powered vehicles, connectivity that enables automated end-to-end workflows with no need for manual data transfer, and integration with third-party data-processing software such as Esri Site Scan or Propeller.
Auterion, auterion.com
Lidar Scanner
Designed to meet the need for highly accurate data
The YellowScan Vx20 lidar is the most accurate, fully integrated system of YellowScan’s product range. It can fly up to 330 feet (100 meters) while maintaining high accuracy throughout the point cloud. The Vx20 series is designed for applications that require sharp, accurate descriptions. Its Applanix APX-20UAV GNSS/inertial sensor provides precision of 1 cm and accuracy of 2.5 cm. With battery, the lidar scanner weighs 6.25 pounds (2.84 kg). It can be integrated with either multirotor or helicopter drones.
YellowScan, yellowscan-lidar.com
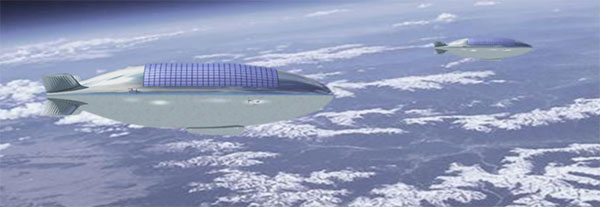
Expandable-wing drone
Stretches to seven feet and carries heavy loads
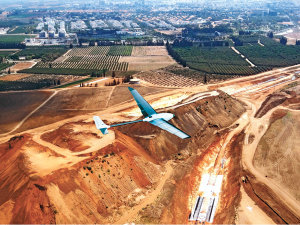
The WingXpand seven-foot expandable-wing drone folds to fit in a backpack. Its U.S.-made patented design combines the small size of a quadcopter with the horsepower of an airplane. The drone expands in less than 2 minutes and weighs less than 10 pounds. It can carry high-resolution cameras and other modular payloads such as a real-time pattern analysis system. More than 10 WingXpand UAS can fit in a public safety vehicle, more than 30 in a pickup, and 250 on a standard airlift pallet. WingXpand maximizes capability, efficiency and safety for the military and public safety officials. It also can be used by farmers, surveyors and inspectors.
WingXpand, wingxpand.com
Drone Package
Capable of centimeter-level positioning
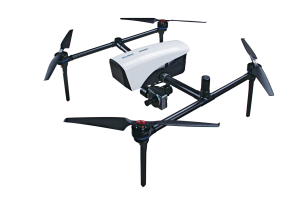
The E300 drone package includes the E300 real-time kinematic (RTK) drone, flight-control software and an optional camera. It is suitable for topographic survey, urban construction, forestry investigation, emergency rescue, 3D modeling, mining and surveying. The drone is embedded with a high-precision K8 GNSS module that supports GPS L1/L2/L5, BeiDou B1/B2/B3/B1C/B2a, GLONASS L1/L2, Galileo E1/E5-a/E5-b/AltBOC/E6 and QZSS L1/L2/L5. With its intelligent recognition algorithms, the E300 can capture high-resolution images consistently even in complex environments.
ComNav Technology, comnav.com
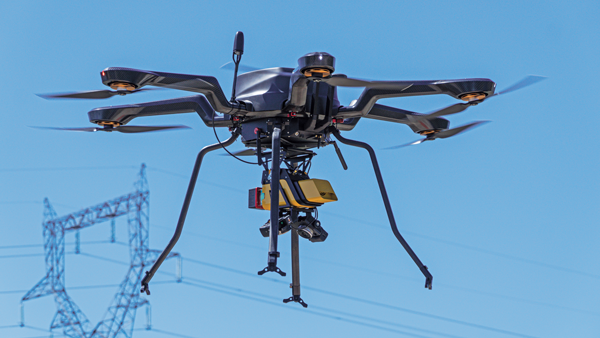
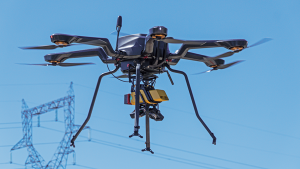
Adjustable Drone
Switches from horizontal to vertical takeoff
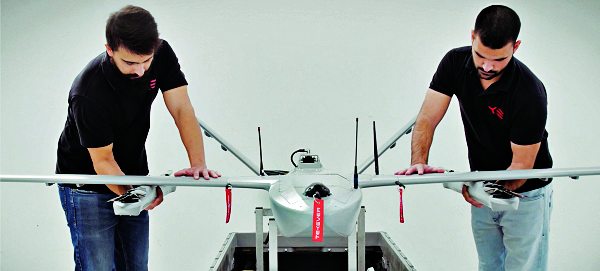
The AR3 unmanned aerial system (UAS) now has a “hot-swappable” vertical-takeoff-and-landing (VTOL) capability, able to switch from horizontal launch to vertical. It also now has integrated synthetic aperture radar (SAR). The AR3 is a shipborne UAS that supports multiple types of maritime and land-based missions up to 16 hours. With the upgrade, the AR3 becomes more operationally flexible. The newly added SAR provides the AR3 with a vastly greater operational range, and the ability to effectively detect, recognize and identify targets under any weather condition. Covering more than 20,000 square nautical miles per mission, the new AR3 is suitable for wide-area surveillance missions.
Tekever, tekever.com
SURVEYING
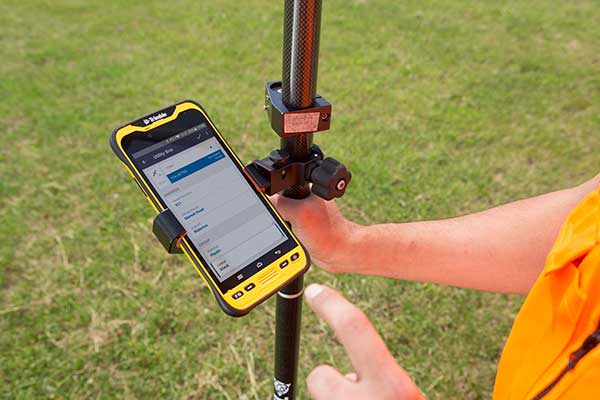
Rugged Tablet
Provides enhanced heading and positioning
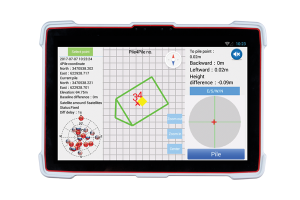
The P300 is a high-precision, in-cab Android tablet designed for precision agriculture, autonomous driving and machine control. Embedded with the K8 OEM module, the P300 tracks GPS, BeiDou, BeiDou-3, GLONASS, Galileo and QZSS signals to achieve centimeter-level accuracy. It provides enhanced heading and positioning performance for everyday field use. The P300 series is available as the P300 Plus (10.1-inch) and P300 Mini (8-inch).
ComNav Technology, comnav.com
Advanced GIS
Deployment option provides greater security, lower cost
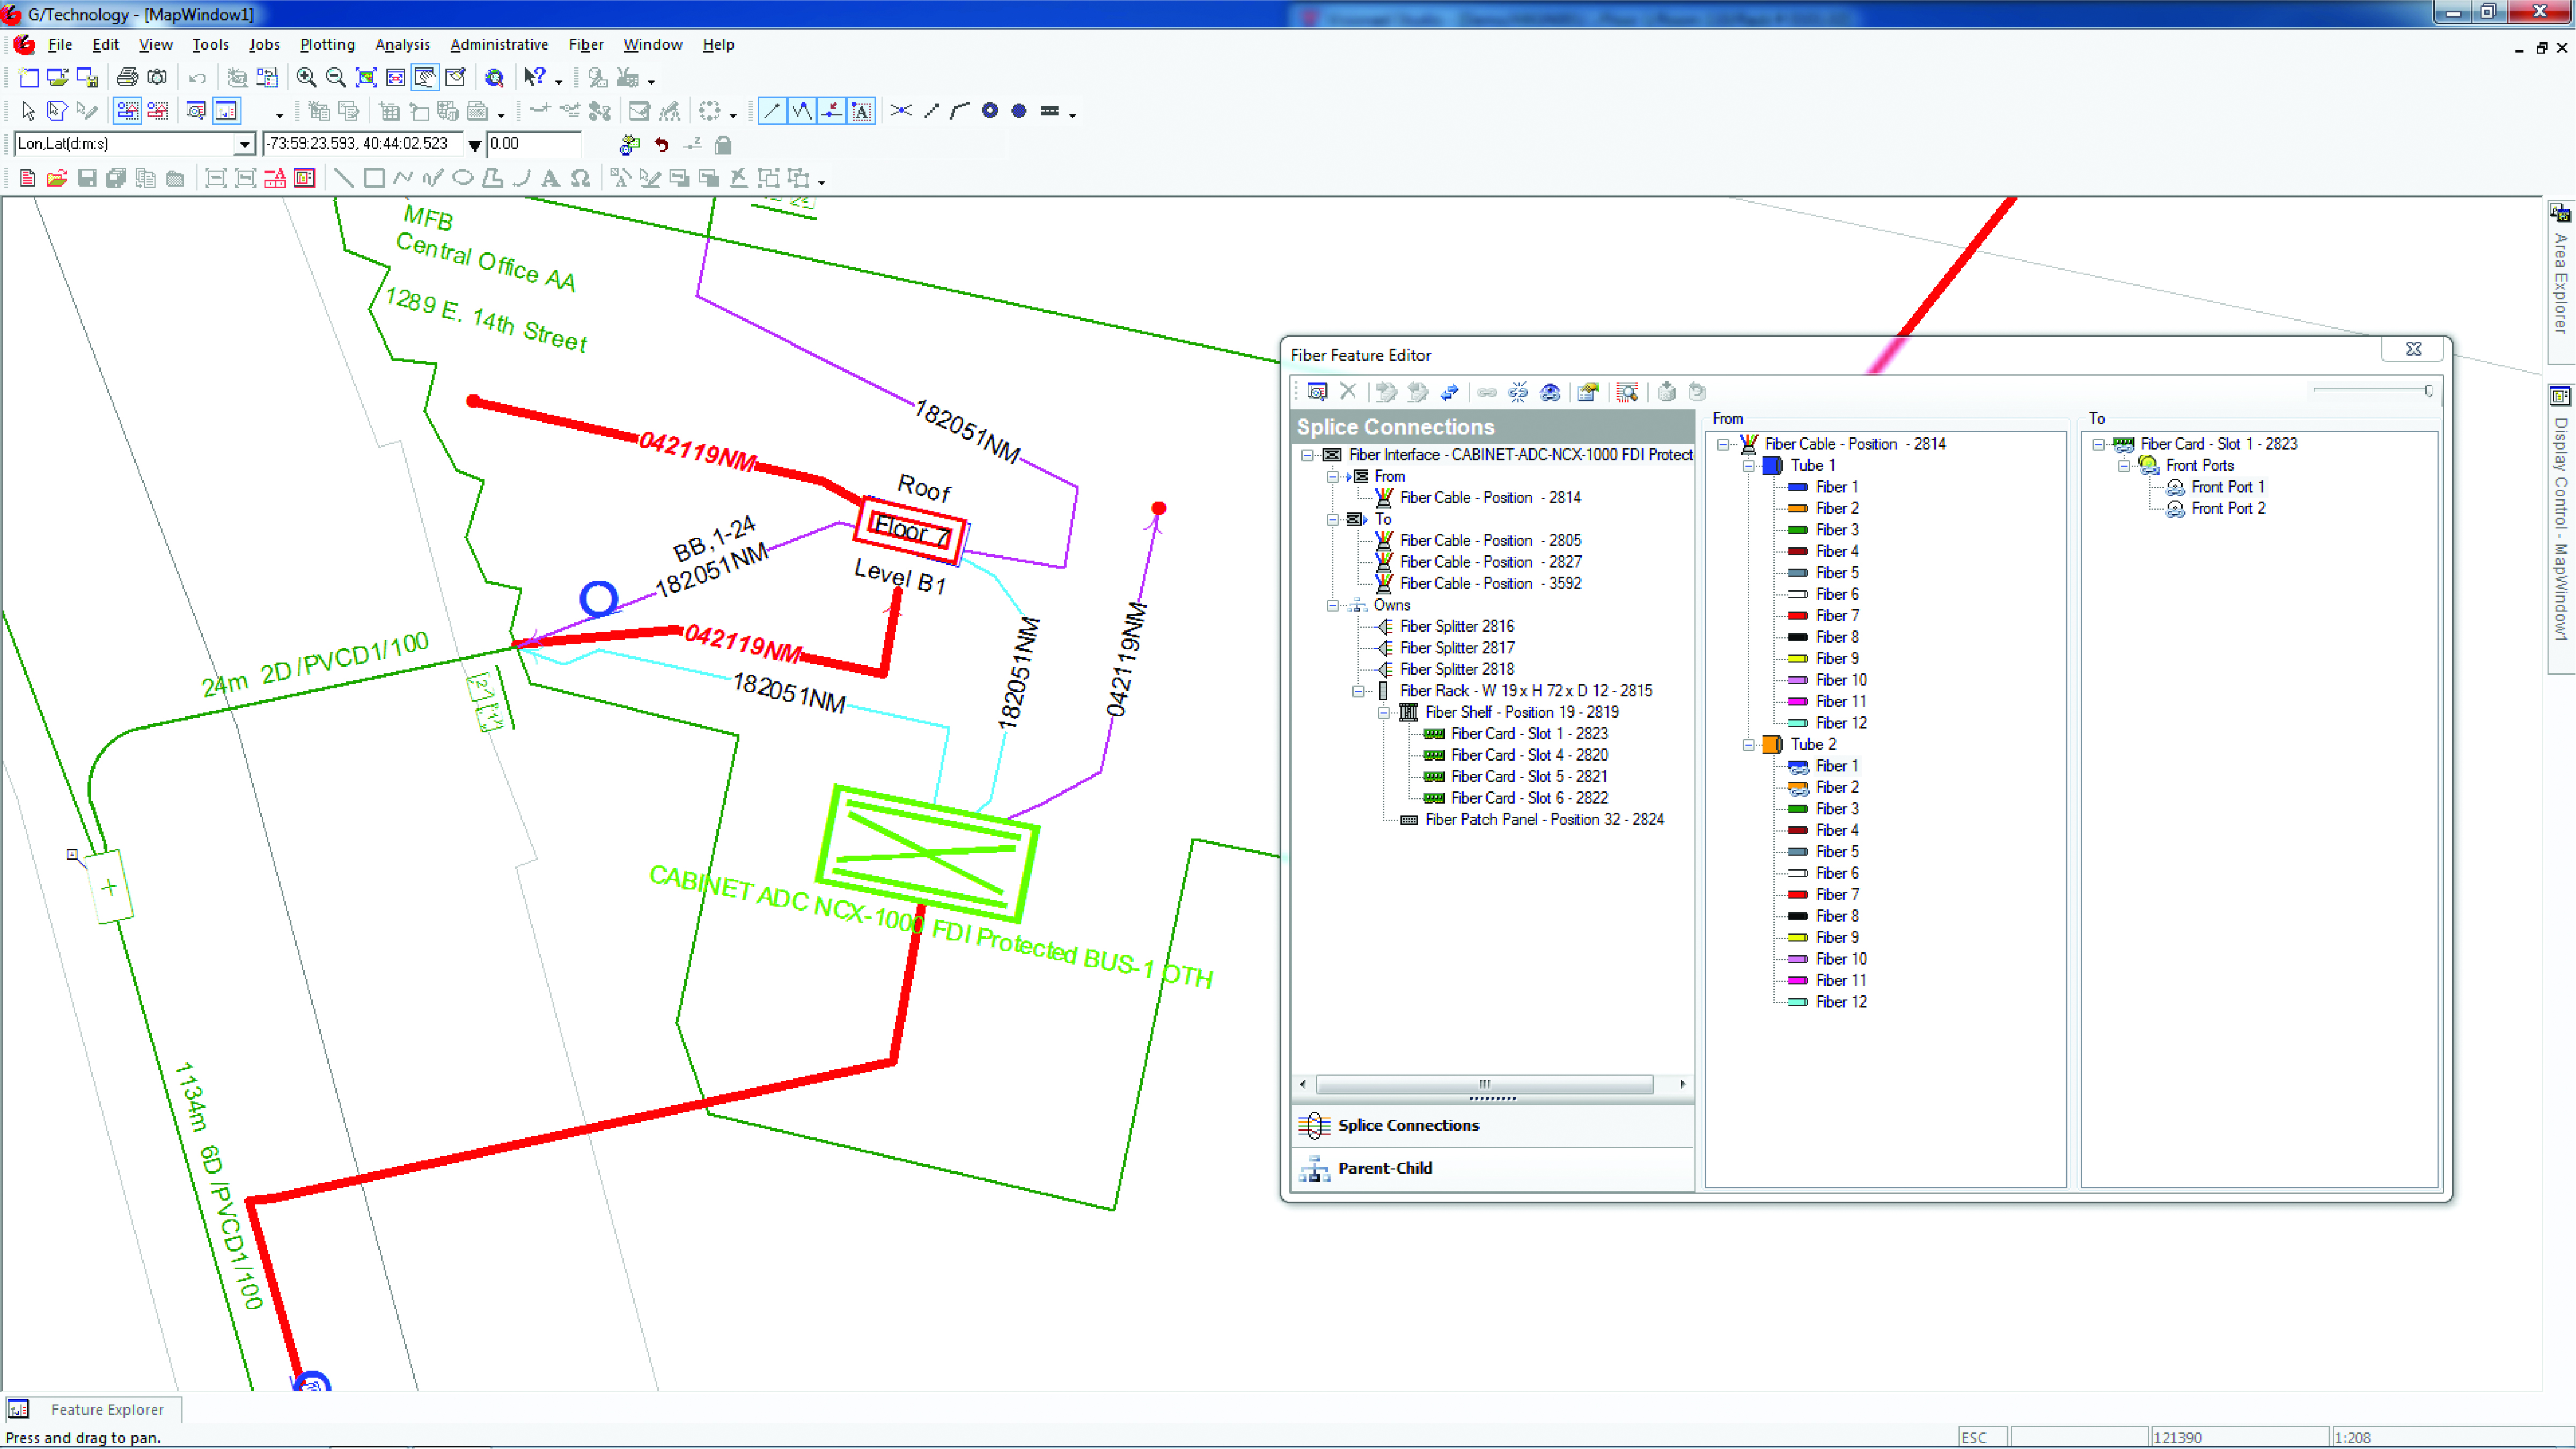
Intergraph G/Technology, an advanced utility geographic information system (GIS), enables utility companies to plan, design and document networks. It acts as a definitive source of reliable, location-based information that can be shared with users and systems across an organization. Available on the Oracle Cloud Marketplace, G/Technology provides utility operators with a scalable, secure and highly available GIS solution with reduced start-up costs and needed infrastructure. Running G/Technology on Oracle Cloud Infrastructure eases initial system deployment, enhances performance and automates scalability, availability and cybersecurity protection, ensuring the system is always up to date with the latest features and enhancements.
Hexagon, hexagon.com
Mobile Mapping Camera
Provides photogrammetry at highway speeds
The Mosaic X mobile mapping camera captures extremely accurate photos and 360° videos, while simultaneously creating photorealistic 3D photogrammetry models, without the use of lidar. It can achieve 1-cm accuracy on road surfaces. The built-in CPU and GPU allow users to operate the camera and capture data without the need for a computer within the vehicle. Meticulous mechanical engineering and design ensure reliable and dependable use in harsh conditions such as moisture, mechanical shock and extreme temperatures. It can create high-quality 3D models, 3D reconstructions, and dense point clouds without the use of lidar. It comes with an AUX port to connect with external GNSS devices or lidar.
Mosaic, mosaic51.com