Tag: geophysical drivers

  • What will the data delivery system of the modernized 2022 NSRS look like?

    What will the data delivery system of the modernized 2022 NSRS look like?

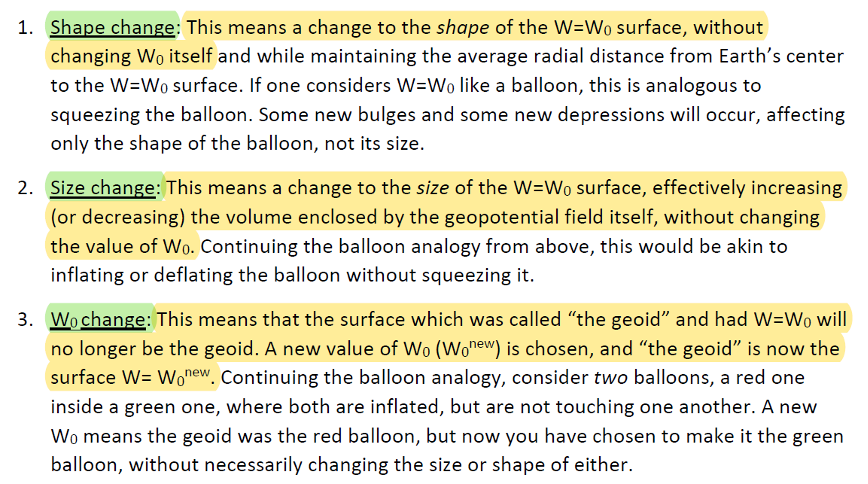
    My previous column highlighted that orthometric heights in NAPGD2022 will be defined through ellipsoid heights and a geoid model, such as GEOID2022. Therefore, changes in the geoid model will be very important to users estimating orthometric heights using GNSS. I briefly described the geophysical reasons for changes in the geoid that affect the orthometric height of a mark.

    For the past four years, I have discussed in my columns the tasks associated with the new, modernized 2022 reference frames. It’s now the middle of 2022, so where are the new reference frames? Well, on June 9, Dru Smith, NSRS modernization manager for the National Geodetic Survey (NGS), provided an update on the status of the modernization in a webinar. The Powerpoint slides and video of the presentation can be downloaded from the NGS website under the following title: It’s 2022…Are You Done Yet? I will highlight some of the items from the webinar, but I encourage everyone to download the video and listen to the webinar.

    First, Smith mentioned that NGS will be providing new types of coordinates. The NGS denotes this as a two-track approach to coordinates: Reference Epoch Coordinates (REC) and Survey Epoch Coordinates (SEC). See the box below.

    New Types of Coordinates (Image: NGS June 6th Webinar - It's 2022…are we done yet?)
    New types of coordinates (Image: NGS June 6 webinar)

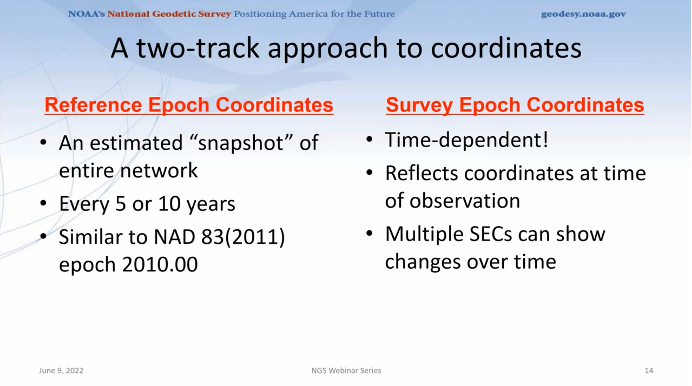
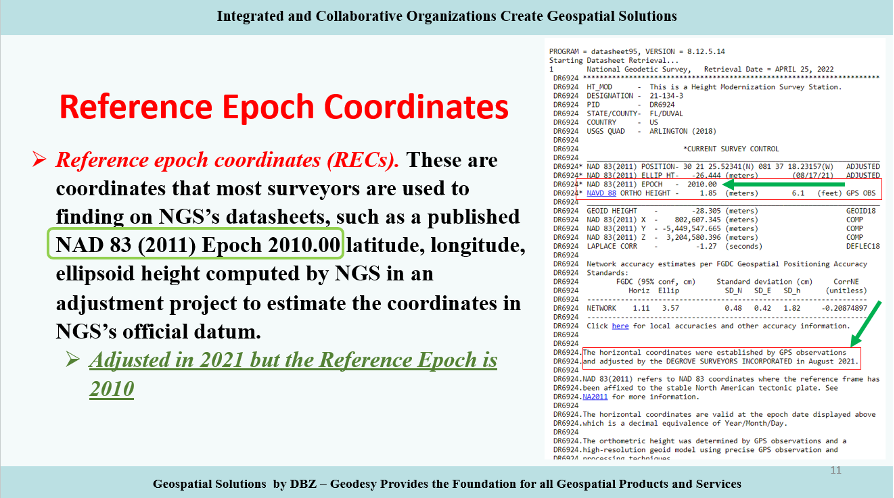
    Reference Epochs Coordinates (REC) are defined in NGS Blueprint for the Modernized NSRS, Part 3 as coordinates computed by NGS in an adjustment project to estimate the coordinates at one of the official reference epochs that NGS will define in 2025. RECs are similar to coordinates computed by NGS in a nationwide adjustment project such as the National Adjustment of 2011 (see the box below).

    NAD 83 (2011) Epoch 2010,00 Coordinates (Image: Dave Zilkoski)
    NAD 83 (2011) epoch 2010.00 coordinates (Image: NGS)

    NGS has not determined what data will be included in the first iteration of RECs. For the 2020.00 project, the current cutoff date for incorporating data is Dec. 31. Users can submit the data to NGS via OPUS projects and the OPUS-Share tool. To increase the submission of GNSS observations on marks, NGS has developed a beta OPUS-Projects 5.0 webtool that will allow real-time kinematic and real time network (RTK/RTN) observations to be submitted.

    As previously mentioned, at this time, the NGS has not determined the cutoff for the earliest data to be included in the determination of the 2020.00 RECs. The agency will be conducting experiments to determine the appropriate cutoff date. These coordinates will require an intra-frame velocity model (IFVM) to generate the RECs at the specific reference epoch.

    As of February 2021, based on NGS’ Blueprint for the Modernized NSRS, Part 3, version February 2021, the following is the agency’s policy with regard to RECs:

    • For a given mark and a given reference epoch, the REC will never be changed–except to correct a blunder.
    • This does not prevent NGS from adding new RECs
      • on points with new data that have not yet had an REC computed
      • for marks that do not have an REC in the most recently passed reference epoch, a new REC can be computed and added to the NSRS.
    • Per NGS’ Blueprint for the Modernized NSRS, Part 3, version February 2021, for simplicity, RECs may happen on the same schedule as SECs.

    Survey epoch coordinates (SECs) are defined as coordinates computed by NGS at a specific survey epoch. Users will submit their data and its metadata to NGS, and NGS will then check, adjust and define the coordinates at one “survey epoch.” These coordinates will be “part of the NSRS,” Smith said. NGS is computing coordinates in this manner to provide the best estimate of the coordinates at any mark at a specific moment in time, which is very important in areas influenced by crustal movement.

    So, how will NGS process and generate these SECs?

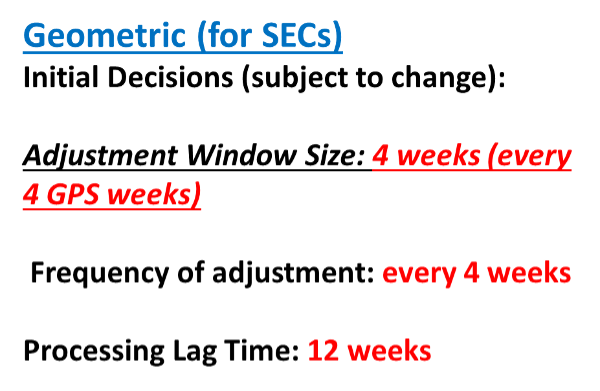
    Survey epoch coordinates (SECs) are designed to provide time-dependent geodetic coordinates. Therefore, NGS has to choose some time span in which all observations will be processed together to yield a single SEC of a mark. NGS denotes this time span as a “geometric adjustment window.” NGS wants the adjustment window to be short enough so that movement of a mark did not occur between repeat observations (or was small enough to be ignored) and long enough for users to efficiently and effectively collect redundant observations for submission to NGS (see the box below).

    Proposed SEC Geometric Adjustment Window
    Proposed SEC geometric adjustment window. (Image: NGS)

    As of February 2021, based on the NGS Blueprint for the Modernized NSRS, Part 3, the following is the policy with regard to SECs:

    • One or more GNSS occupation(s) over a single mark will be processed into one survey epoch coordinate when all occupations take place within one geometric adjustment window.
    • If a user submits two occupations on one mark, but they happen to fall in two consecutive geometric adjustment windows, NGS will use them to create two distinct survey epoch coordinates. Each SEC will be based on one occupation.

    Future columns will provide more explanation about this concept of a geometric adjustment window and how NGS will process the data to generate survey epoch coordinates.

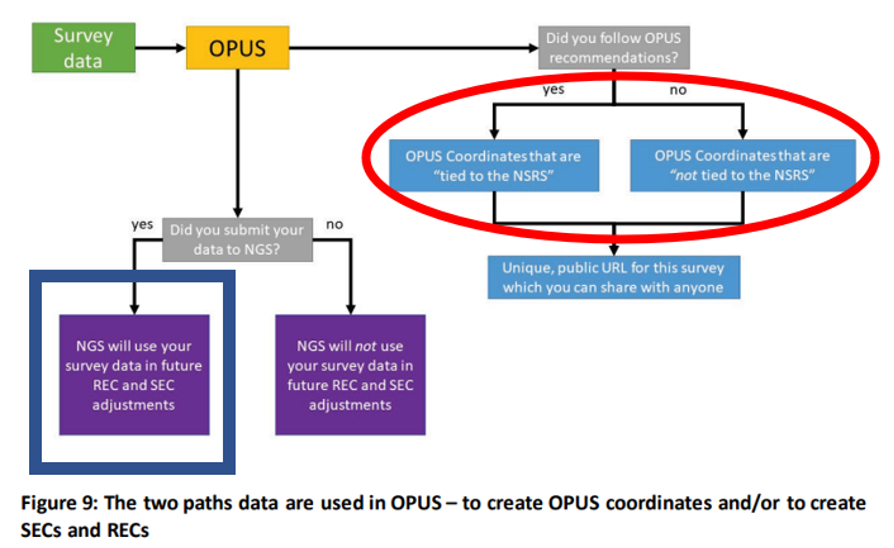
    NGS is developing models and tools for users to submit data to NGS to compute coordinates — including OPUS coordinates, reference epoch coordinates and survey epoch coordinates. Figure 9 from Blueprint for the Modernized NSRS, Part 3, version February 2021, is a schematic that shows the flexibility NGS is building into an OPUS-type webtool. Basically, if users follow NGS guidelines and rules, and submit their data to NGS, then NGS will compute and publish REC and SEC coordinates (see the blue outline in the box below). If users only want to compute OPUS coordinates, then they can use NGS’s webtool without submitting the data to NGS (see the red outline in the box below).

    Photo:
    Building flexibility into OPUS (Image: NGS)

    Dru Smith’s June 9 update on the status of the modernization provided a mockup of how users will be able to retrieve data using their web browsers — a prototype is being developed. The data will also be available in downloadable form such as an XML file for users to input the data and metadata into their programs or databases. I recently discussed some of this material at seminars I presented at the Florida Surveyors and Mapping Society’s 67th annual conference held in Palm Beach Gardens. The participants were very interested in the prototype, but really wanted to learn more about the format and process of the downloadable XML files. I’m sure future NGS webinars will address this topic. I emphasized to the group that they should watch the entire presentation and provide feedback to NGS. As mentioned above, Powerpoint slides and video can be downloaded from the NGS webinar website.

    The boxes below highlight a few of the options NGS is considering. The box “Data Delivery – Prototype” is an example provided by Smith during his webinar. It should be noted that the images of the prototype are not included in the downable slides, but they are part of the video. The images presented in this column are screen captures from the video.

    Data Delivery - Prototype (Image: NGS June 6th Webinar - It's 2022…are we done yet?)
    Data delivery prototype. (Image: NGS)

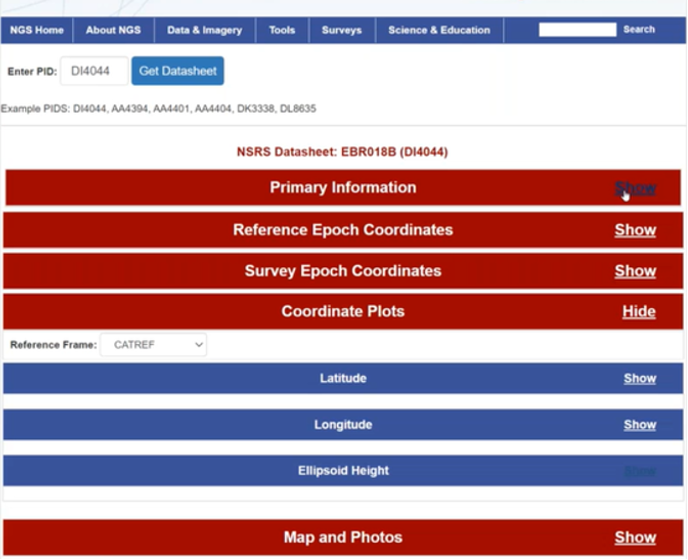
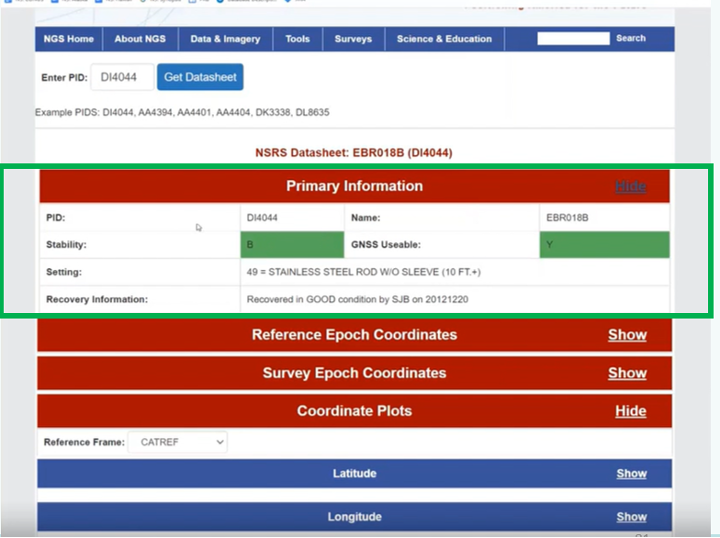
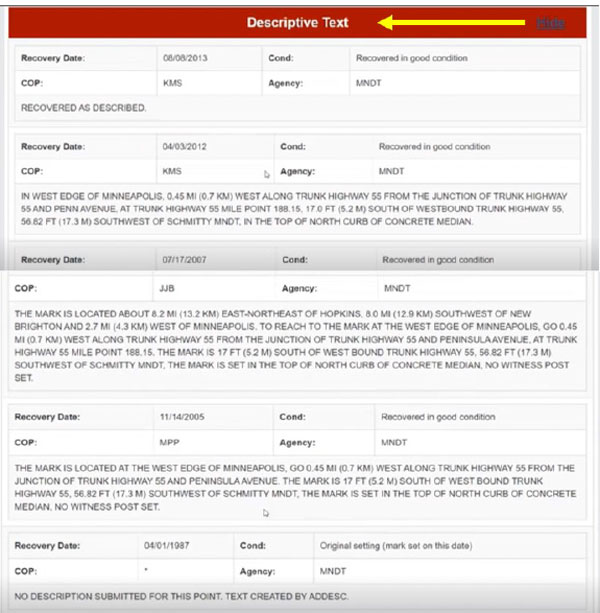
    The box below provides some of the basic information of a mark, such as its PID, name, stability, GNSS usable code, setting and the latest recovery information. Again, this is a prototype, so users should feel free to send feedback to NGS. NGS wants to generate a usable product, and is interested in user feedback.

    Primary Information – Prototype (Image: NGS June 6th Webinar - It's 2022…are we done yet?)
    Primary information prototype. (Image: NGS)

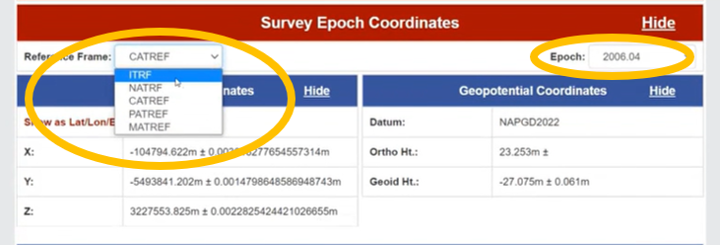
    As previously stated, NGS is implementing a two-track approach to coordinates: publishing REC and SEC. The box below provides the REC information of a mark when a user clicks the “Show” button. As shown in the diagram, the reference frame and epoch are provided, as well as the geometric coordinates (latitude, longitude, ellipsoid height) and geopotential coordinate information (NAPGD2022 orthometric height and geoid height).

    Reference Epoch Coordinates – Prototype (Image: NGS June 6th Webinar - It's 2022…are we done yet?)
    Reference epoch coordinates prototype. (Image: NGS)

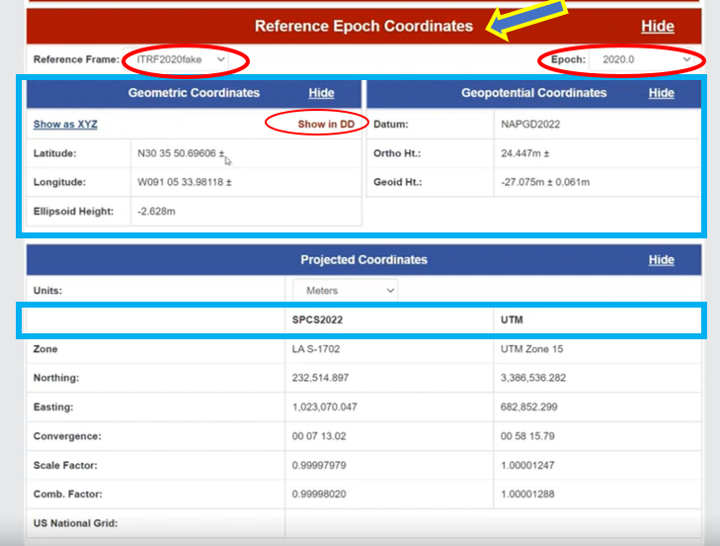
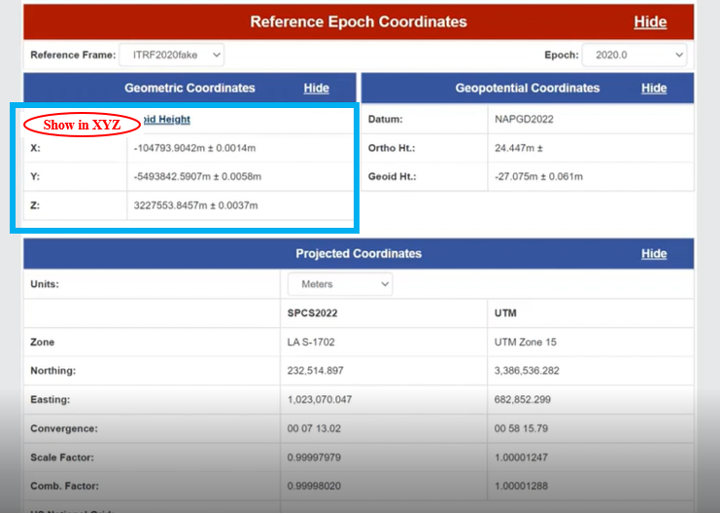
    NGS provides an option for individuals who want the geometric coordinates in the X, Y, Z format (see the box below). Remember, this is only a mockup of a prototype, to give us an idea of the direction NGS is going with its data delivery system in the new, modernized 2022 NSRS.

    REC Shown in X,Y,Z (Image: NGS June 6th Webinar - It's 2022…are we done yet?)
    REC Shown in X,Y,Z. (Image: NGS)

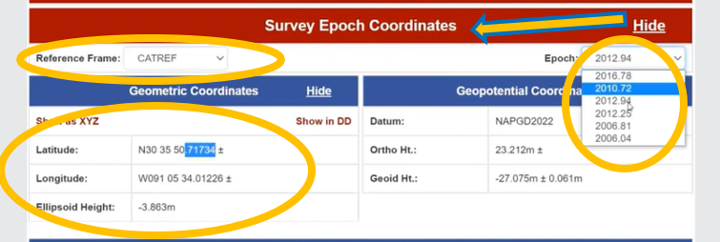
    Similar to the REC, the prototype includes SEC. For a mark, the latter are different from the former because SEC are computed at the epoch of the survey observations (see the box below).

    Survey Epoch Coordinates – Prototype (Image: NGS June 6th Webinar - It's 2022…are we done yet?)
    Survey epoch coordinates – prototype. (Image: NGS)

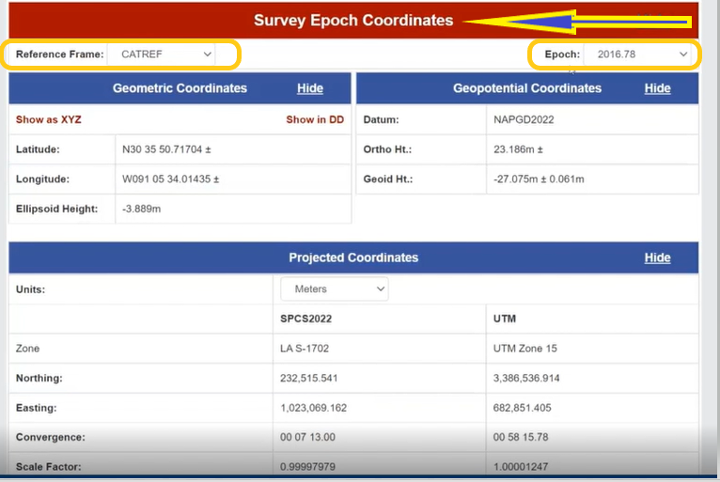
    The box titled “SEC in CATRF – Prototype” is an example of a mark in the CATRF reference frame and the survey epoch of 2012.94. As indicated in the diagrams, users will be able to select the reference frame (ITRF, NATRF, CATRF, PATRF and MATRF) and the survey epoch.

    SEC in CATRF – Prototype

     (Image from: NGS June 6th Webinar - It's 2022…are we done yet?)
    Option to Select Survey Epoch
    Photo:
    Options to select reference frame (Images: NGS)

    Another feature of the data delivery system is that it provides plots of a mark’s survey epoch coordinate values at different epochs. In the example shown in the box below, the plots provide values of a mark’s latitude, longitude and ellipsoid heights based on each survey epoch data. The user can select various reference frames of the mark to understand the change based on the reference frame.

    Coordinates Plots in ITRF – Prototype (Image: NGS June 6th Webinar - It's 2022…are we done yet?)
    Coordinate plots in ITRF prototype. (Image: NGS)

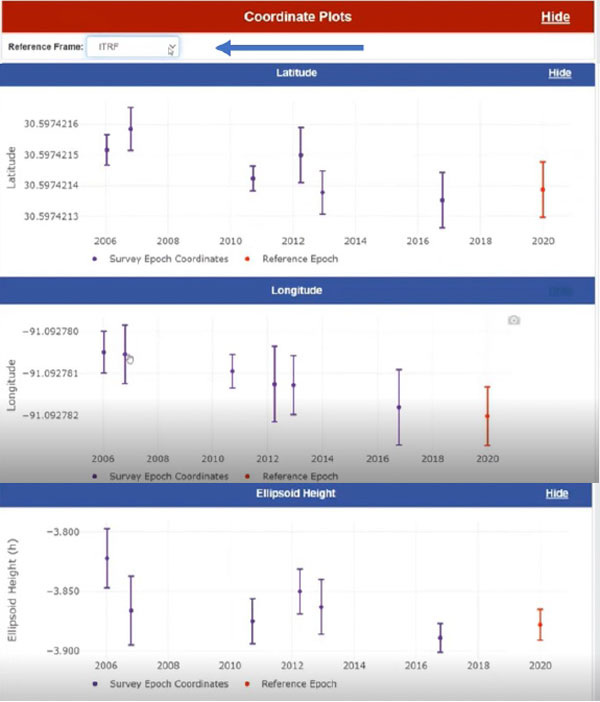
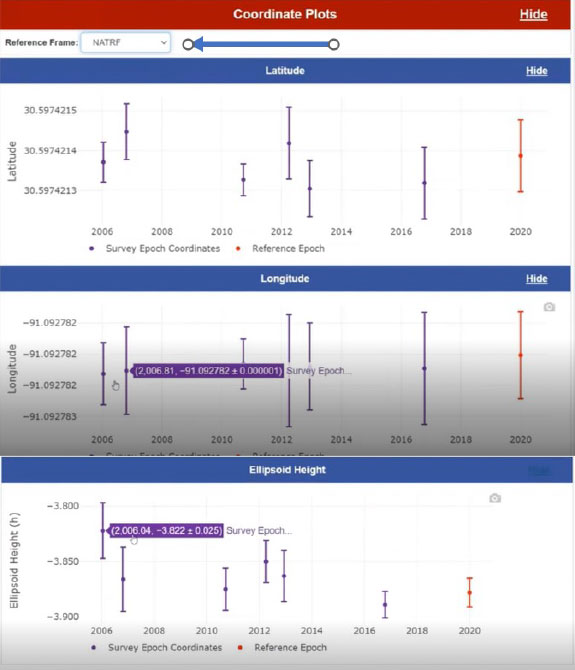
    The box below clearly shows a slope in the changes in coordinates based on survey epochs, especially in the longitude. This is the plate rotating in time. You can see the changes in latitude, longitude and ellipsoid height in the NATRF reference frame for the same mark. The latitude and longitude plots do not show a slope because the plate rotation is removed using a model to change from the ITRF reference frame to the NATRF reference frame. That said, the ellipsoid height plots look the same because the rotation model does not change the ellipsoid height.

    Coordinate Plots in NATRF – Prototype (Image: NGS June 6th Webinar - It's 2022…are we done yet?)
    Coordinate plots in NATRF prototype. (Image: NGS)

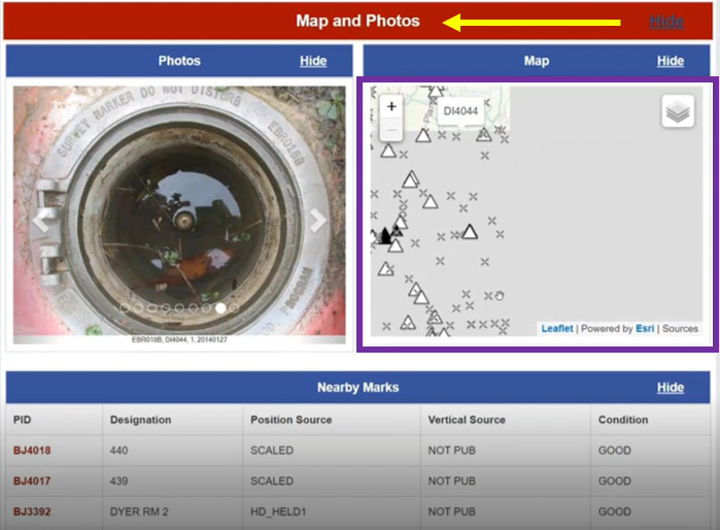
    The prototype also provides maps, photos and descriptive text of the mark.

    Map and Photos – Prototype (Image: NGS June 6th Webinar - It's 2022…are we done yet?)
    Map and photos of a mark in the prototype. (Image: NGS)
    Descriptive Text – Prototype (Image: NGS June 6th Webinar - It's 2022…are we done yet?)
    Descriptive text prototype (Image: NGS)

    Some of this data delivery output may seem familiar to users who have used the NGS beta routines (see the box below).

    Beta Routines

    NGS's Beta Routines (Images: NGS)
    Beta routines (Image: NGS)

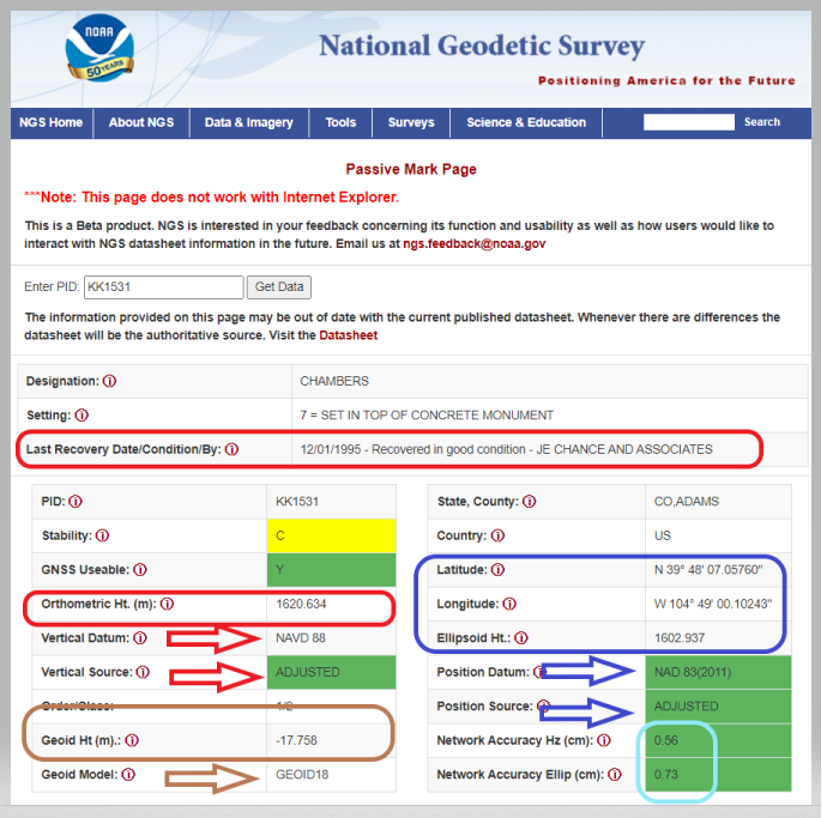
    For example, the Passive Mark Page Webtool provides the coordinate information for a mark. My October 2020 column described the tool is detail. See below for an example of the passive mark tool.

    Beta Passive Mark of KK1531 (Image: National Geodetic Survey)
    Beta Passive Mark of KK1531 (Image: NGS)

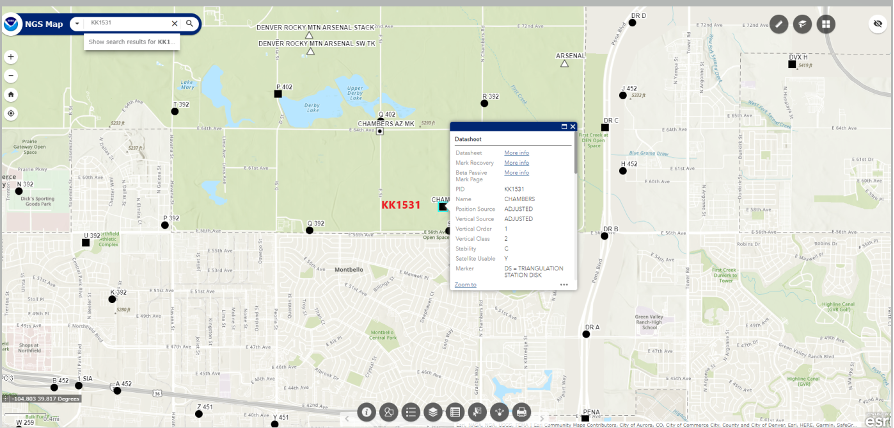
    The NGS Beta Map routine enables users to link to NGS datasheets, the passive mark tool and mark recovery, as well as connect to OPUS Shared Solutions and the NOAA CORS Network. See below for an example. It also provides a measuring tool, multiple basemaps and the ability to export data. My December 2021 column described the NGS Beta Map in detail.

    Example of NGS Beta Map Routine for KK1531 (Image: National Geodetic Survey)
    Example of NGS Beta Map Routine for KK1531 (Image: National Geodetic Survey)

    Only three years remain before the release of the new, modernized NSRS. I encourage everyone to try all of the beta products, and download Dru Smith’s June 6 webinar for a better understanding of the agency’s current thoughts on how it will provide data to users in the new, modernized NSRS. As for all the NGS beta products, the agency would like users to try the tools and provide feedback on what they liked and what they didn’t like, as well as any additional information you need or would like to see. The NGS is trying to develop tools useful to everyone, but that won’t be possible unless they hear from users.

    The following statement on NGS beta products explains how to provide feedback and why it is important:

    “This is a beta product. NGS is interested in your feedback concerning its function and usability as well as how users would like to interact with NGS datasheet information in the future. Email us at [email protected].”

  • The effects of geoid changes in NGS’s new, modernized 2022 NSRS

    The effects of geoid changes in NGS’s new, modernized 2022 NSRS

    My April column addressed the vertical movement at the NOAA CORS Network (NCN). The values at the sites indicate the potential movement of marks in the area of the CORS. The rates are based on GNSS data and have an estimate of error associated with them.

    As I mentioned in my previous column, I’m not sure how the National Geodetic Survey (NGS) will address the vertical movement effects in the new, modernized National Spatial Reference System (NSRS). That said, NGS will be monitoring the CORS and looking for trends to help describe the vertical movement at the CORS. These trends are an indication of what may be happening in that area.

    As stated in previous columns, orthometric heights in NAPGD2022 will be defined through ellipsoid heights and a geoid model, for example GEOID2022. In addition to the movement of individual marks due to crustal movement, there are geophysical reasons for changes in the geoid that affect the orthometric height of a mark. Therefore, changes in the geoid model will be very important to users estimating orthometric heights using GNSS.

    As stated in the NOS NGS 64 report, NGS has set a goal of maintaining geoid accuracy at 1 centimeter (1 standard deviation) in both absolute and differential geoid undulations. The box titled “Figure 13 from NOS NGS 64 Report” depicts an estimate of the secular change in the geoid. As indicated in the plot, the changes are very small, ranging from -1.25 mm/year to 1.5 mm/year.

    What I find interesting is the small negative change in the southeastern United States. There are other drivers for geoid changes. This column will address some of these changes and what they mean to users.

    Secular geoid change

    Photo: NGS
    Figure 13 from NOS NGS 64 Report (Image: NGS)

    As mentioned in many of my articles, the new, modernized NSRS has a time-dependent component. This includes the geoid modelTable 5-1 from NOS NGS 64 report are examples of some of the physical processes being investigated by NGS to account for changes in the geoid.  (See the box titled “Some of the geophysical drivers of geoid change.”) As mentioned in the NOS NGS 64 report, the magnitudes in red have already been determined to be too small for NGS to model. The examples highlighted in yellow have magnitudes that are significant and NGS will attempt to account for these changes to the geoid. 

    Table 5-1: Some of the geophysical drivers of geoid change
    Table 5-1: Some of the geophysical drivers of geoid change

    NGS classifies the changes in the geoid in three different groups: Shape Change, Size Change, and W0 Change. The box titled “The Groups of Geoid Change” provides NGS’s definition and explanation of the terms.

    The groups of geoid change

    Photo: Dave Zilkoski

    NGS’s report on their Geoid Monitoring Service (GeMS) program provides figures that depict an estimate of the secular geoid rate trend based on the NASA GSFC mascon model. See the boxes titled “Estimate of Geoid Rate Over CONUS” and “Estimate of Geoid Rate Over Alaska.” For more details on GeMS, download the report NOAA Technical Report NOS NGS 69: A Preliminary Investigation of the NGS’s Geoid Monitoring Service (GeMS), and read my December 2019 Survey Scene column. The secular geoid rate trend is an example of the geoid changing its shape, but not the W0 value. What this means is that the local geoid undulations will change, but the overall size of the geoid will not.

    Estimate of geoid rate over CONUS

    Figure 32: Geoid rate over CONUS based on the GSFC mascon model [mm/yr] (Image: NOAA)
    Figure 32: Geoid rate over CONUS based on the GSFC mascon model [mm/yr] (Image: NOAA)
    Estimate of geoid rate over Alaska

    Figure 33: Geoid rate over Alaska from GSFC mascon model [mm/yr] (Image: NOAA)
    Figure 33: Geoid rate over Alaska from GSFC mascon model [mm/yr] (Image: NOAA)
    These changes in the geoid are fairly small values (+/- 1.3 mm/year), but they will accumulate over a decade. As previously stated, NGS’s goal is to maintain geoid accuracy at the centimeter level (1 standard deviation) in both absolute and differential geoid undulations. In my February 2022 column, I discussed how coordinates change because Earth’s surface is moving due to the movement of major tectonic plates. It’s fairly obvious how the tectonic shift affects horizontal coordinates, but earthquakes and volcanic eruptions can also cause large shifts in vertical coordinates.

    In recent history, on May 18, 1980, geologists watched in awe as Mount St. Helens erupted in a gigantic explosion. After the eruption, the volcanic cone of Mount St. Helens had been completely blasted away; the peak, which was at an elevation of 9,677 feet (2,950meters) was changed to a horseshoe-shaped crater with an elevation of 8,363 feet (2,549 meters). Extreme crustal movements such as the Mount St. Helens eruption can change the shape of the geoid. As explained in my April 2022 newsletter, NGS understands this and is attempting to manage the changing coordinates by providing a time-dependent component to a mark’s ellipsoid height, but there is also a time-dependent component to the geoid that affects the mark’s orthometric height.

    Ring of Fire

    Image: National Ocean Service
    Image: National Ocean Service

    The “Ring of Fire” map highlights earthquake activities around the world. As indicated in Table 5.1, earthquake or volcanic eruptions can change the shape of the geoid. Of course, they also can change the height of a mark due to crustal movement, which would typically be larger than the change in the geoid height. The amount of movement would be due to the size and magnitude of the event, but even small earthquakes could cause a change in the height of a mark located near the event. Earthquakes are occurring all over the world every day. 

    Earthquakes with large magnitudes are highlighted by news media outlets, but ones with smaller magnitude typically are not highlighted. The four figures below provide examples of earthquakes that have occurred over 30 days. This information can be obtained from the United States Geological Survey (USGS).

    Earthquakes during the past 30 Days
    Date: May 20, 2022

    Image: USGS
    Image: USGS

    Earthquakes in the lower 48 during the past 30 days
    Date: May 20, 2022

    Image: USGS
    Image: USGS

    Earthquakes in eastern United States in the past 30 days
    Date: May 20, 2022

    Image: USGS
    Image: USGS

    I found the large number of earthquakes that occurred in Oklahoma in just 30 days to be very interesting.  This isn’t something that I thought occurred in the eastern region of the United States. 

    Earthquakes in Oklahoma during the past 30 days
    Date: May 20, 2022

    Image: USGS
    Image: USGS

    The image below depicts earthquakes that have occurred in Oklahoma in the past five years. They are fairly small in magnitude, but what is the cumulative effect on the geoid in the region, as well as changes to the orthometric heights of marks due to crustal moment in the region?  This is why it is important for the new, modernized NSRS to implement time-dependent coordinates. 

    Earthquakes in Oklahoma in the last 5 years
    Dates: 2017 to 2022

    Image: USGS
    Image: USGS

    To better understand the changes to the geoid, NGS performed a survey in Alaska to obtain geodetic data as part of its GeMS program.  On May 12, 2022, Kevin Ahlgren, a geodesist at NGS, described in a webinar the observations collected and some of the results. 

    The presentation provided an overview of a field campaign performed in support of the GeMS program and a time-dependent geoid model. The campaign included static GNSS, relative gravity, and deflection of the vertical techniques on 50 stations in Alaska. The webinar was can be downloaded.

    I encourage everyone to download the presentation.  The change in the geoid due to geophysical drivers is small, but if the new, modernized NSRS is going to include time-dependent coordinates, then changes in the geoid must be accounted for.  For demonstration purposes, NGS provides an example of the time-dependent geoid change in the xGEOID20 webtool.  The box below, “xGEOID20 interactive computation output,” is an example of using this tool. The two stations are located in Alaska. As indicated in the output from the tool, the change in the geoid is 8 mm in five years. Again, NGS’s goal is to maintain geoid accuracy at the centimeter level (1 standard deviation) in both absolute and differential geoid undulations.  These small changes can become significant over time. 

    xGEOID20 interactive computation output

    Note: DN is the time-dependent geoid change computed between user inputted epoch (t) and t.
    Note: DN is the time-dependent geoid change computed between user inputted epoch (t) and t. (Image: NGS)

    The last geoid change group that I’ll highlight has to do with the change in the gravity potential (W0) value that defines the model. The NOS NGS 64 Report states that the standing definition of the geoid, as adopted and used at NGS, is the following:  

    The geoid is the equipotential surface of the Earth’s gravity field which best fits, in a least squares sense, global mean sea level. 

    As stated in the NOS NGS 64 report, over a century of sea-level measurements imply that global mean sea level (GMSL) was rising at a rate of approximately 1.7 millimeters per year and was rising at a rate of 3.2 millimeters per year between 1993 and 2010 (IPCC, 2014). If NGS is going to define the geoid as the equipotential surface of the Earth’s gravity field that best fits, in a least squares sense, global mean sea level, then the geoid in the new, modernized NSRS must change when the GMSL exceeds a certain threshold. 

    Again, NGS’ goal is to maintain geoid accuracy at the centimeter level (1 standard deviation) in both absolute and differential geoid undulations.  What this means is that as GMSL rises, the value of gravity potential which best fits to GMSL (called W0) will also change.  In other words, the surface which was called “the geoid” and had W=W0 in 2022 will no longer be the geoid. A new value of W0 (W0new) is chosen, and “the geoid” would now be the surface W=W0new.   

    So, what does this really mean to users? The NOS NGS 64 Report states on page 37:

    “NGS and the Canadian Geodetic Survey have jointly adopted the value of 2.0 m^2/s^2 as the replacement threshold for a new geoid model (and new geopotential datum). This represents approximately 20 centimeters of GMSL (and thus geoid) rise. At the current rate of sea-level change of about +3 millimeters per year (IPCC, 2014), this means NGS expects to replace NAPGD2022 in approximately 60 to 70 years.” 

    Therefore, this should not be a major concern of users for a long time. 

    This column highlighted that orthometric heights in NAPGD2022 will be defined through ellipsoid heights and a geoid model, for instance GEOID2022; and therefore, changes in the geoid model will be very important to users estimating orthometric heights using GNSS.  It briefly described the geophysical reasons for changes in the geoid that affect the orthometric height of a mark. 

    If NGS is going to meet the goal of maintaining geoid accuracy at 1 centimeter (1 standard deviation) in both absolute and differential geoid undulations, they will have to address changes in the geoid. The secular changes in the geoid, as indicated in Figure 13 in the NOS NGS 64 report, are very small, ranging from -1.25 mm/year to 1.5 mm/year. Once again, these are small changes to the geoid, but they will accumulate over time, and that is why NGS is including time-dependent coordinates in the new, modernized NSRS.