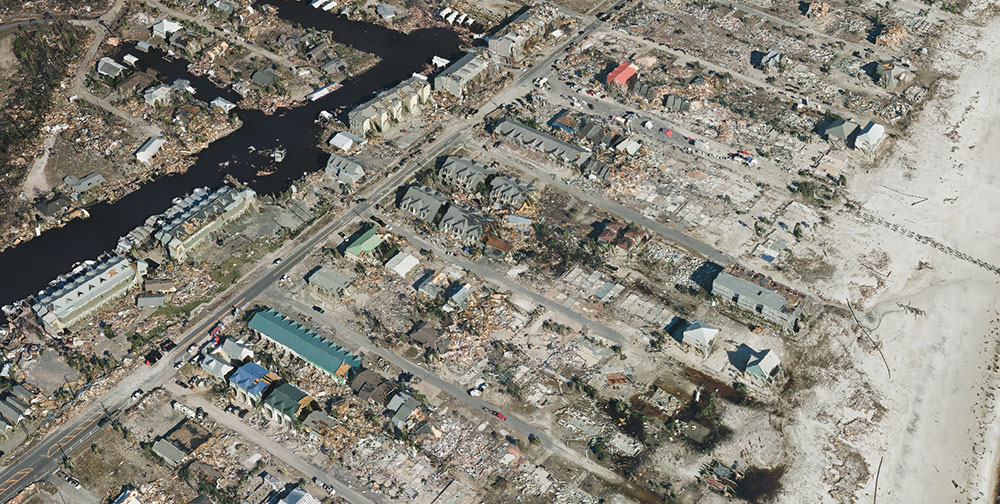
Correlator3D was used to process large format imagery collected by Midwest over Mexico Beach, Florida. (Image: SimActive)
SimActive Inc., developer of photogrammetry software Correlator3D, has partnered with Midwest Aerial to perform damage assessments of Hurricane Michael.
Correlator3D was used to process large format imagery collected by Midwest over Mexico Beach, Florida. The joint effort resulted in highly precise geospatial data, including a digital surface model (DSM), an orthomosaic and a 3D model, the company said.
“This is a terrible disaster for the people affected and we hope they can benefit from geospatial technologies available,” said Philippe Simard, president of SimActive.
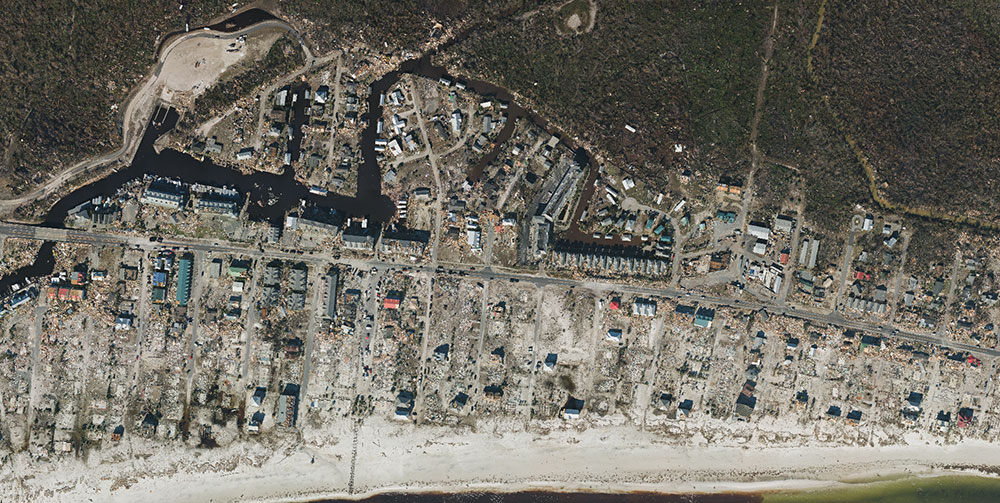
The gallery below shows samples of the imagery collected.
SimActive partnered with Midwest Aerial to perform damage assessment of Hurricane Michael. (Photo: SimActive)
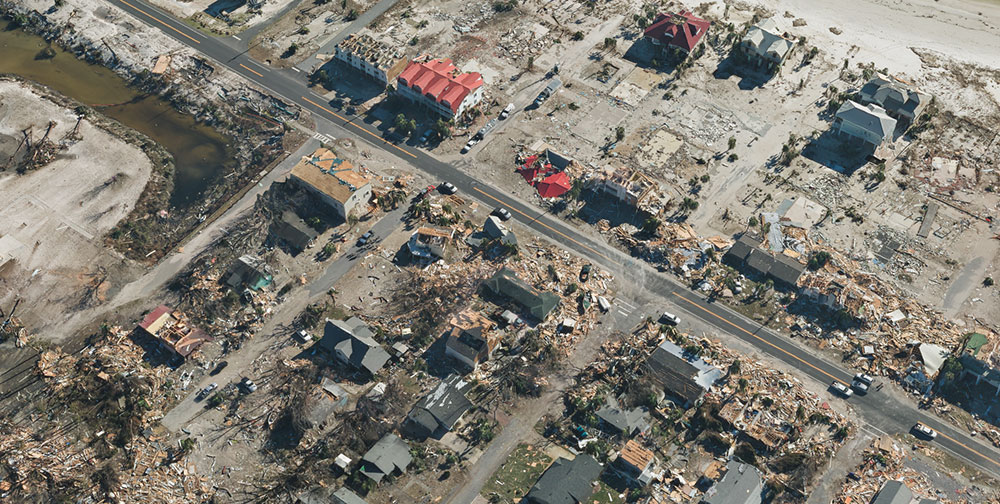
Correlator3D was used to process large format imagery collected by Midwest over Mexico Beach, Florida. (Image: SimActive)
Aerial imagery of the devastation from Hurricane Michael in Mexico Beach, Florida. (Image: SimActive)
SimActive’s Correlator3D is a patented end-to-end photogrammetry solution for the generation of high-quality geospatial data from satellite and aerial imagery, including UAVs. Correlator3D performs aerial triangulation and produces dense DSM, digital terrain models, point clouds, orthomosaics, 3D models and vectorized 3D features.
Powered by GPU technology and multi-core CPUs, Correlator3D ensures high processing speed to support rapid production of large datasets, the company added.
Midwest Aerial Photography focuses on acquiring high-quality aerial imagery and companion data in support of photogrammetric mapping projects across the United States and Canada. Midwest partners and clients include federal, state and local government agencies, as well as photogrammetric firms and architectural and engineering companies.
LizardTech, a provider of software solutions for managing and distributing geospatial data, will launch Version 10 of its GeoExpress data manipulation and compression software at the 2018 GEOINT Symposium. GeoExpress 10 includes significantly expanded lidar data handling capabilities and improved interface communication.
LizardTech will demonstrate GeoExpress 10 in booth #1245 at the GEOINT Symposium, which is being held April 22-25, 2018, at the Tampa Convention Center in Tampa, Florida.
GeoExpress is LizardTech’s flagship software product originally created to enable geospatial professionals to manipulate digital satellite, aerial and UAV images and losslessly compress them to industry-standard MrSID or JPEG2000 files for more efficient use.
The addition of lidar handling in 2015 and 2016 releases gave GeoExpress the ability to natively compress lidar data to MrSID and LAZ formats with no loss of data content, saving up to 75% on storage and processing time, as well as support for high-density BPF point clouds.
“Users can do a lot more with their lidar data in GeoExpress 10,” said Toby Martin, LizardTech vice president, Development and Strategy.
In past versions of the software, GeoExpress performed only basic compression and mosaicking of lidar point clouds. The new version enables users to reproject lidar files into different coordinate systems and crop the data to create smaller files.
Individual files or single tiles within a mosaic may be cropped to a desired area of interest for easier and faster processing. Additionally, GeoExpress 10 allows the user to crop by elevation, adding a third dimension to spatial image management.
“You can use the elevation cropping function to create point clouds of just the mountain peaks in an area, for example, if you are planning a high-elevation project,” said Martin.
In GeoExpress 10, users will also find the overall experience of interacting with their data sets is more intuitive thanks to enhanced information and communication from the software. Users may now select the data sets they want to mosaic together, and the software presents a selection of processing options which may be applied to those files.
Another general upgrade in the new version is the ability to pause and then re-start a processing task without losing any progress already achieved. In the past, a task could only be stopped and started again from the beginning once it had been initiated, which for extremely large processing jobs may take significant resources to complete.
Other enhancements to GeoExpress 10 include:
compatibility with LZW compressed TIFF files commonly output from Pix4D software.
addition of Esri projections to the Reprojection Manager.
addition of rectangular cropping around a center point.
shape cropping using Google Earth KML files.
In addition to GeoExpress 10, LizardTech will showcase its complete line of geospatial products at GEOINT 2018:
Express Server software for high-performance delivery and publication;
the recently updated GeoViewer software, which is the fastest way to view MrSID and JPEG 2000 imagery; and
the recently released Portfolio 2017 digital asset management solution, which makes it easy to organize, access and share geospatial imagery alongside associated graphic and digital files.
“The blockchain cannot be described just as a revolution. It is a tsunami-like phenomenon, slowly advancing and gradually enveloping everything along its way by the force of its progression.” — William Mougayar *
A kidnapping in Kiev
War-torn and ragged, the once glistening jewel on the Dnieper River adorned in Christmas lights bustled with Yuletide celebration. But further from the city center, the streets were quieter, more demure as the dark night settled in. A black Mercedes Benz pulled up and parked along a poorly lit street. In the car sat four men wearing facemasks and carrying Kalashnikovs. In the cold Kiev night, they waited.
Across the street a large, husky man pulled shut the security curtain, turned out the lights and locked the front door of his store. He turned, his briefcase hanging at his side, and walked a few steps toward his car.
The four men crossed the dim street, forming a semi-circle as they moved toward the man. He slowly raised his hands. He was Russian; his accent gave him away. One of the four men placed a thick black bag over the Russian’s head. With gun barrels pointed into his back, he followed their orders, climbing into the back of the Mercedes Benz.
The four men got into the car and sped away into the cold, dark Kiev night. The man was Pavel Lerner, a blockchain expert and owner of a digital currency exchange in the Ukrainian capital. His captors demanded a ransom of $1,000,000 paid in Bitcoins, the highest valued cryptocurrency.
Three days later, on Dec. 29, 2017, safe and unharmed, Pavel’s abductors released him along an unmarked road in the middle of nowhere.
Cryptocurrencies and crime. Crimes involving cryptocurrencies have been increasing; perhaps the most widespread is hackers using ransomware demanding payment in Bitcoins. The worldwide WannaCry virus is the most pernicious of these attacks, costing hundreds of billions of dollars.
Other crimes of the more traditional variety are also on the rise such as kidnapping, as in the case of Chloe Ayling, a British glamour model held for $500,000 payable in Bitcoin.
Blackmail and money laundering are also on the rise; all of them are using Bitcoin as the currency of choice, as are black markets lurking on the darknet.
The fall of the dark web marketplace Silk Road netted unexpected surprises, capturing two rogue FBI Agents and a DEA agent found to be peddling in the underworld’s vast enterprise. Silk Road’s net worth when it was shut down was 614,305 Bitcoins.
As December 2017 came to a close and Pavel Lerner paid his ransom, the value of one Bitcoin peaked at $19,843, making Silk Road worth $12.2 billion and the Dread Pirate Roberts the second wealthiest criminal in history. Ross Ulbricht, the creator of Silk Road, is serving a life sentence.
The 2015 documentary Deep Web describes the government’s takedown of Silk Road. View the trailer below.
When currencies fail
Governments have always been slow to act, or at least slow to comprehend. Such is the case with cryptocurrencies. The government sees the phenomenon as a mechanism supporting criminal enterprise, but the trending use in digital currencies represents a seismic shift in the way people think about money and where they are placing their trust.
There is a decline in the faith of fiat currencies as the countries backing them fall into mounting debt. Concern is fueled by the instability of national and international politics and the threat to the U.S. dollar by the unraveling of the petrodollar.
As well, the euro has been hit by wave after wave of bad news by the economies of Greece, Italy and Portugal and the so-called Brexit, as the United Kingdom withdraws from the European Union. What does that spell for the future of the euro?
Plus, with sanctions, Russia’s Ruble has lost 50% of its value since 2013. The farcical worthlessness of a Zimbabwe 50 trillion dollar note proves there is no limit to the loss in value a fiat currency can suffer when it implodes.
Photo: iStock
Venezuela’s currency collapse. And now, Venezuela is in a plummeting currency death spiral, officially falling in value from a par of 10 Bolivars to equal one U.S. dollar to 25,000 bolivars, all in the month of February. Unofficial reports are that the value has sunk to 230,000 bolivars to the U.S. dollar.
As of Tuesday, Feb. 27, in a desperate attempt to salvage itself, Venezuela announced an initial coin offering (ICO) for a national cryptocurrency called the petro. The irony in this is that the digital currency will probably survive because it’s on the blockchain, but Venezuela will not.
If anyone wants to learn about what happens when a nation’s currency collapses, Venezuela is a terrifying case study. It is no wonder people around the world seek refuge in an asset that promises freedom from government meddling. It is also no wonder governments are terrified of blockchain’s potential, yet fascinated at the same time, like so many other technologies holding great power for both good and evil.
There is a stalemate of sorts, a stand-off between those early adopters with the courage to invest and risk it all for the hope of great fortunes, and governments who hold the power to regulate, fine, confiscate and imprison. Tension separates both sides. Who will budge?
The United States and Europe have so far been measured in their response, while China and South Korea are cracking down on cryptocurrencies. Most people, curious and cautious, sit waiting it out. These stories represent the darker side of bitcoin, blockchain and the rise of cryptocurrencies, but there is another side, the more benevolent, useful and hopeful side.
What are cryptocurrencies?
Unlike gold, which has traditionally been considered a store of value, cryptocurrencies have no physical existence. They are digital assets held in a digital wallet. They are an asset with a finite number of tokens. They are driven purely by supply and demand. If there is a greater supply than there are traders, the value is next to nothing as there was in 2009 when Bitcoin first came into existence.
May 22, 2010, marks the milestone when a digital currency first purchased something in the physical world. Two pizzas sold for 10,000 Bitcoins. Now, there are more traders than tokens, and the demand has driven the value to unprecedented heights. One Bitcoin was worth $19,499 on Dec. 15, 2017.
Bitcoin is the most explosive financial instrument ever created. But Bitcoin is not the only digital currency. In all, there are more than 1,800 cryptocurrencies. The term “crypto” implies they are secretive and have a layer of anonymity, but there is an irony. Cryptocurrencies are based on blockchain technology.
Blockchains have an unalterable integrity system built into them, leading to the adage “What happens on the blockchain stays on the blockchain.” That creates a conundrum and begs the question, just how is it that what provides a veil of secrecy also holds the promise of open transparency?
Blockchains
Image: iStock
To answer that question, we need to explore blockchains. What exactly is a blockchain? A blockchain is a digital, decentralized, distributed, open and immutable ledger. Each transaction has a string of characters called a hash. Each hash includes a date/time stamp, a unique ID, a code linking it to the previous hash, and a private key identifying ownership, albeit anonymously.
Each transaction is another link in a chain that can be traced backwards to the previous link, all the way back to the origin of the entire chain, called the Genesis Block.
What makes the blockchain decentralized is no single computer or entity controls it. Hundreds and thousands of computers make up a blockchain network. Each computer is called a node. A blockchain is distributed because all the nodes work together in a peer-to-peer network. Nodes on a network record each transaction, and these transactions are mirrored on every other node throughout the network.
The transactions can be accessed and downloaded from any node on the network. This makes a blockchain an open and distributed ledger. When a node is out of sync with other nodes on the network, it is rejected until it is reset to match the other nodes. That makes it impossible to alter any records, making a blockchain immutable.
For these reasons integrity, is built into the blockchain. Anonymity is provided by a private key that ties it to a digital wallet that can only be accessed by the owner. The digital wallet connects to the owner, but not the blockchain itself. As a result, a blockchain identifies what, when and who about each transaction. A blockchain does not provide where the transaction occurred.
At this time, blockchains lack a geospatial capability.
“Anytime there’s some data that needs to maintain its integrity, blockchain is definitely there. Essentially, what you would do is get the hash and you would have a hash key and then any changes or alterations are made fully aware at all times.” — Reem El Seed **
Geospatial blockchain benefits
Image: FOAM
A company called FOAM is working to change that, creating a geospatially enabled blockchain using a crypto-spatial coordinate (CSC) system. Location in a FOAM blockchain doesn’t just record a specific time, it also validates proof of location and gives a spatial context that regular blockchains lack.
This functionality creates an immutable digital connection to the physical world. Kristoffer Josefsson, CTO of FOAM Inc., confirms this, saying, “We can securely connect offline spaces to online assets.”
If digital currencies based on blockchain technology are going to be considered a safe and viable medium for conducting business, they must include location. Blockchain’s abilities are what the world needs to curtail crime and corruption and be able to follow the money trail from whom and to where it flows.
“This is what we are working on at FOAM and believe that such a system is needed as a crucial infrastructure in our decentralized future and can open new marketplaces of privacy preserving location data.” — John Ryan King, CEO, FOAM Inc.
Adding a geotag to a blockchain is like adding ribonucleic acid to a cell bringing it to life. Something can’t exist until it exists in time and space. A blockchain with a geospatial tag makes that possible and allows mapping of events in a temporal sequence. This inhibits criminal activity.
If a crime were committed using a geotagged blockchain, the location of the crime would immediately be known. The hash code from the blockchain would be extracted with a date/time/location stamp and would be flagged on the network to all the nodes, making that hash code “hot.” A hot blockchain means that particular hash in the chain would be monitored. If it were involved in a transaction, an alert would be broadcast throughout the network, focusing on the location.
Security cameras and other assets would converge, putting eyes on the target, and the transaction would be rejected. Authorities would then be able to trace the digital wallet’s owner like running license-plate tags for a car, and, shortly thereafter, descend on and apprehend the offender.
Did George Orwell dream the dream we are now living, “Big Brother is watching you,” while he himself mocks us from his eternal sleep?
Empowerment with location. Mansour Raad, senior software engineer and Big Data advocate at Esri, sees location-enabled blockchain opening up opportunities for people to interact with their representatives. He is excited about the prospects saying, “We can envision dozens of potential use cases in geospatial contexts, from fine-grained citizen engagement in smart-city initiatives through to activity-based military intelligence applications.”
Certainly, this is a more empowering view. Some of the largest companies in the world are also exploring uses for blockchain and geospatially tagged ledgers. This mass effort and focus on innovation will have some magnificent results.
Mansour goes on to add, “The influx of companies like Boeing and Lockheed Martin and forward-thinking communities like Dubai are searching for blockchain-based solutions to their problems.” This will drive innovation. Both ends of the spectrum are there, from the frontline developers to the back-end buyers with large pockets.
Latitude and longitude has been the backbone of location and navigation for more than 2,000 years, when people navigated primarily by landmarks and the stars. That worked well for those not venturing beyond their familiar locales; but as knowledge of the world expanded and monarchs ruled larger and larger empires, and trade spread to further and further regions, and wars and conquest extended to unknown realms, maps were necessary. A grid system for maps was created by Hipparchus, another of those great Greeks upon whose shoulders the world still stands. That coordinate system, known as latitude and longitude, has served well for two millennia, but the digital age demands another solution.
And so it is with change. It happens over many years, but the transformation happens all at once. The change has been taking place for years with location-based formats such as the Military Grid Reference System (MGRS) and the more universal digital Degrees Minutes Seconds (DMS) supporting GPS-based systems, as well as the more novice friendly what3words (W3W), which is especially useful for disaster-relief operations. All of these serve their purpose, but fall short of providing a concise code that is critically important to make geotagging a blockchain possible. That is of great value considering blockchain’s potential in logistics and transportation, both of which are dependent upon precise location data.
Photo: Port of Rotterdam
Add the growth of IoT (the internet of things) and one gets a sense of the demand for a location-based blockchain and how enormous such a system would be. The Port of Rotterdam, Europe’s largest shipping facility, is testing blockchain for logistics. Companies like Ford, IBM and PwC also are looking at its potential.
Mansour Raad adds, “Some data scientists see a benefit to utilizing an addressed reference system such as the Open Geospatial Consortium Discrete Global Grid System (OGC DGGS), due to its holistic ability to fit into existing hashing algorithms. This also turns map algebra into map-set mathematics with drastic advantages to speed, computational resource usage and distribution.”
Get ready! Blockchain is a disruptive technology. It is so powerful that it is difficult to predict its impact, but it will touch everything.
“The old question ‘Is it in the database?’ will be replaced by ‘Is it on the blockchain?’” — William Mougaya
Governments will be more accountable to the people tracing where their expenses are actually going. The government could post an annual tax bill for each person online that could, in theory, show each taxpayer where each dollar was spent. This is an empowering new model for transparency.
A digital wallet is virtual, but it can be connected to the physical world through a smart key, like a SIM card. And, if the blockchain were geospatially enabled, it would create a layer of security preventing any use if the owner of the digital wallet were not nearby. That’s automatic two-step authentication.
A geospatially embedded blockchain could make that possible. Cash can transfer hands and no one is any wiser about where the money came from, but transfer a blockchain-based currency and the new owner is part of the permanent record.
Tough on crime. What would that do to crime? How would it affect blackmail, kidnapping, human trafficking? Perhaps the smart key is attached to the owner’s cellphone, or a smart watch, or a smart ring? Most likely it would be a smart chip implanted in the owner’s arm or thigh.
A smart chip implant. (Photo: Escape Alert, LLC)
The technology would also be useful for password tokens, building access security cards, passports, etc. It holds great promise for warding off theft and increasing security.
Uses for a blockchain extend beyond currency and are not necessarily associated with financial transactions. Transactions are events: a download is a transaction; clicks on a webpage are transactions; passing through a checkpoint is a transaction; an image capture is a transaction; IoT-triggered events are transactions; and electronically signing a document is a transaction. Blockchains can be coded into software to track downloads of digital copies such as songs, movies, audio, video, images, programs and documents. The obvious implications are copyright protection.
Blockchains can also provide information security for trade secrets, military secrets and even national secrets. Companies that contract to the government would be able to lock their trade secrets from hackers and spies by controlling digital copies with a blockchain. A geocoded blockchain could encrypt data outside of geospatially approved areas or if accessed by anyone other than approved private keys. The contents of secure packages could never fall into the wrong hands even if the package was intercepted. The encryption could not be unscrambled without being in the proximity of the smart key.
Additionally, every download would record what, when, who and where any attempts at access occurred. Blockchain technology also enables smart contracts such as medical records, land ownership records, shipping manifests and notaries. Blockchains can be made a part of physical inventory.
Geocoded-embedded blockchains make asset management more secure, restricting transactions to within specific locations. This would be beneficial in a store for controlling inventory, or at a facility for tracking movements of assets, whether the facility is a military installation, an industrial complex, a government facility, a school campus or a penitentiary. In the case of a penitentiary, the prisoners themselves can be tracked.
Closing Thoughts about Blockchain
“In a time of deceit, telling the truth is a revolutionary act.” ― George Orwell
Elections. In a free republic, the integrity of elections must be protected and made fully transparent. Geotagged blockchain election ballots would be an immutable record of the election. A little geospatial analysis could easily detect locations with multiple votes making it highly suspect for voter fraud. Add the requirement to have a private key associated with each voter and voter fraud would be eliminated.
One of the benefits would be eradicating the months of post-election bickering wasting time, tax dollars and sanity. It’s hard to argue with a transparent, decentralized, distributed and immutable ledger; so, no matter which side of the political divide someone is on, removing reasons for conflict should benefit everyone.
Immutable record. If you look at the non-stop news cycle about the government missing texts, missing emails, possible collusion, a dossier, possibly two, and who knew what, and when did they know it, all of that could be resolved with blockchain technology. An immutable record would make it nearly impossible for anything to come up missing, and a geospatially tagged blockchain would show exactly who knew, what they knew, and where they were when they learned it. Deception would be made much more difficult.
Blockchain has the potential to sterilize corruption in politics. The ideal for an open and transparent political system is worth holding on to.
Learn about blockchain, because it will become more and more prevalent in conversations, on television, in movies, and on the news. I hope this article helped shed some light on the technology and its future and the advantages of adding a geospatial component to a blockchain.
* William Mougayar is the Voltaire of the blockchain revolution. He applies his visionary intellect to the merits of a trust-based, information-sharing system prescribing it a cure against the ills of business, politics and society. Mougayar is stoking the coals of the digital transformation just as Voltaire helped light the torch of the French Revolution.
** Reem El Seed is the coordinator of the Blockchain Users Group for the Washington, DC Chapter. She is a prodigious and enthusiastic proponent of blockchain and cryptocurrencies and a well-known figure in the Washington, D.C., area.
The Open Geospatial Consortium (OGC) is considering start of a new work item for a Community Standard: Indexed 3D Scene Layers (I3S), and is seeking public comment on the work item proposal.
The I3S delivery format is used to stream 3D geospatial content to mobile, web and desktop clients.
I3S, initially designed by Esri, was publicly released in April 2015 as an open specification for streaming large, heterogeneous 3D geospatial data sets, including discrete 3D objects, large continuous meshes, 3D vector points, point clouds, and other content. I3S is designed from the ground up to be cloud, web and mobile friendly.
The I3S conceptual model is implemented using JSON. There is also an I3S Scene Service REST API specification for accessing I3S resources as endpoints. I3S is designed to stream very large 3D datasets and is designed for performance and scalability.
A document has been prepared that provides a justification to the OGC Technical Committee (TC) for consideration of I3S as a Community standard. This justification, along with the submitted candidate Community standard, will form the basis for TC review and vote to approve the start of the Community standard process.
Sponsored by: Hemisphere GNSS Broadcast Date: Thursday, June 20, 2013 Moderator:Eric Gakstatter, Survey Scene Newsletter Editor Speakers: Kevin Kelly, Geodesist, ESRI, Inc.; Craig Greenwald, Technical Director, GeoMobile Innovations; Michael L. Dennis, RLS, PE, Geodesist, NOAA Summary: A look at the challenge of dealing with horizontal datums in your GIS. We are moving into a new era in dealing with datum transformations. Geodata 2.0 is coming, and it can create big headaches when attempting to combine disparate geospatial databases. Sensors such as GPS receivers, remote sensing imagery, and 3D scanning provide much more accurate data, setting up a collision with outdated and mismatched legacy horizontal datums.
The Arctic SDI Pilot is sponsored by the United States Geological Survey (USGS) and Natural Resources Canada. The goal is to demonstrate to Arctic stakeholders the diversity, richness and value of a Spatial Data Infrastructure (SDI) based on web services and standardized exchange formats in helping address critical issues impacting the Arctic.
Stakeholders include national and pan-Arctic science and monitoring organizations and decision makers engaged in Arctic research, social and economic policy, and environmental management. The organizations participating in the ArcticSDI Pilot will document and publicize best practices that can support a rich network of web-accessible data and service resources for the Arctic.
The pilot has two phases.
Phase 1, an OGC Interoperability Program Concept Development study, began in December 2015. In Phase 1, project planners are building an inventory of currently available Arctic geospatial data layers and web services and defining the Arctic SDI architecture. This work will be supported by partners engaged in industry, research, and numerous jurisdictions. A Request for Information will be published in January 2016 to elicit further ideas, experiences, and projects in industry, research institutions and public administration to make maximal use of the ArcticSDI and to develop it further.
The Arctic SDI Pilot Phase 1 will also provide direct input into OGC’s major Testbed 12 Interoperability Program initiative. USGS has indicated that sponsor funding will be made available for Testbed 12 to test and further develop components identified in the Arctic SDI pilot. Through this collaboration, arctic stakeholders and the Arctic SDI will leverage and benefit from the leading-edge interoperability research, development and outreach that is ongoing in the OGC’s series of major testbeds.
All findings from Phase 1 will serve as input for Phase 2, which will be an OGC Interoperability Program Pilot Project. OGC pilot projects apply and test OGC Standards in operational applications using Standards Based Commercial Off-the-Shelf (SCOTS) products that implement OGC Standards. Pilot projects provide an operational implementation so that users and technology developers can collaborate and learn how to better address their requirements using standards-based architectures.
To articulate the value of interoperability via standards, technology provider participants will implement the recommended Arctic SDI architecture in support of Arctic policy scenarios. A video will be produced to engage policymakers on the benefits of integrating diverse data utilizing Arctic SDI standards and information management best practices.
The OGC is an international consortium of more than 515 companies, government agencies, research organizations, and universities participating in a consensus process to develop publicly available geospatial standards. OGC Standards support interoperable solutions that “geo-enable” the web, wireless and location-based services, and mainstream IT. OGC Standards empower technology developers to make geospatial information and services accessible and useful with any application that needs to be geospatially enabled.
The Capturing Reality Forum has issued a call or papers. The event will incorporate the best of SPAR Europe and European LiDAR Mapping Forum (ELMF). Taking place at the Salzburg Congress, Austria, November 23-25, the Capturing Reality Forum will focus on the technologies of laser scanning, LiDAR, 3D data capture and modeling to provide an inspiring platform for professionals to meet, learn and share ideas with industry’s best.
Industry leaders are invited to submit technical papers to be considered for presentation. Abstracts can be submitted online until August 11. “We welcome international papers which will address recent project examples and the key commercial and technical issues but most importantly those that highlight pioneering research and developments that will impact the future development of the industry. Each abstract will be peer reviewed and we will announce the final program in September,” said Conference Chairman Alastair MacDonald (director of TMS International).
Headed up by the Diversified UK team, the forum will include a conference featuring leaders from all sectors of the industry, with an international exhibition of the latest technologies running in parallel. The event management team headed by Versha Carter, group director, has previously managed the ELMF and ILMF events and successfully launched the GEO Business show. “We are excited to be involved with the rebranding of these two very established events, which has been received as a very positive next step for the industry,” Carter said. “SPAR Europe and ELMF co-located two years ago, but continued to have separate conference programs. By merging into one, the synergy between the two events and the shared interests, challenges and opportunities will be fully realized.”
“If you are interested in data capture and imaging on the inside or outside of facilities, the tracking of utilities and monitoring of transport, or modeling external effects on the national coastline or landmass, the Capturing Reality Forum has all the ingredients of a must-attend event,” MacDonald said. “Delegates will be in the company of colleagues from all sectors of the geospatial data capture, visualization and imaging industry. And this will all be happening over three days in the wonderful atmosphere of Salzburg.”
Papers could include reports on subjects such as: Building Information Modeling (BIM); 3D for asset and facilities management; 3D data capture for as-built conditions; point cloud processing; managing and sharing large data sets; 3D/intelligent modeling; augmented reality and visualization tools; airborne, terrestrial and bathymetric LiDAR; coastal zone, defense and flood plain LiDAR; corridor and utilities mapping; data classification, GIS, data modeling/management; mobile mapping; technology development and trends; and small Unmanned Aerial Systems (sUAS).
Running alongside the Capturing Reality forum conference will be an exhibition of more than 50 stands displaying manufacturers, software developers and service providers of 3D imaging, laser scanning and LiDAR products. As an extra benefit to delegates, many of the exhibiting companies will host workshops, providing an opportunity for more in-depth discussion.
Centrally located in mainland Europe, Salzburg is easily accessible from northern, southern, eastern and western European countries. Salzburg Congress is situated in the center of the city and provides a special dimension socially with its seasonal events and Christmas markets.
“This is an outstanding venue, which has always earned a flood of positive feedback,” Carter said. “The move to Salzburg has been welcomed by the industry and we look forward to hosting the Capturing Reality Forum in the heart of such a beautiful historic city.”
Editor’s Note: Learn more about how the TerraGo Edge replaces single-use GPS handheld devices and enables mobile workers and field crews to easily collect and share field data. Attend GPS World’s May webinar, Say Goodbye Proprietary GPS Devices, Hello TerraGo Edge.
TerraGo, a geospatial collaboration and enterprise mobility software company, is offering a new version of its OpenGeoPDF software, now available with TerraGo Publisher for ArcGIS, TerraGo Composer and TerraGo Toolbar. The latest release gives end users powerful new spatial database features, including the ability to search and update feature attributes, with an interactive OpenGeoPDF map accessible to any end user without requiring them to purchase any software.
“TerraGo’s OpenGeoPDF lets people turn static maps into interactive GIS-lite applications by letting ArcMap users share a free portable client application,” said Kevin Coles, manager of Enterprise GIS at Lumos Networks. “With OpenGeoPDF, end users can do more than view maps and imagery. They can interact with maps in ways previously only available with GIS software including the ability to control layers, measure distances, query, update and extract feature data in a universal format.”
OpenGeoPDF produces a measurable return on investment by enabling organizations to leverage their GIS investment to create free GIS-Lite solutions for non-GIS users. One of the many benefits of the OpenGeoPDF approach is that GeoPDF maps with embedded feature attributes can be accessed, searched, updated and extracted as an OGC (Open Geospatial Consortium) GeoPackage.
“The incredible value of geospatial data and an organization’s investment in GIS should result in more than a paper map or flat image in a PowerPoint,” said TerraGo Chief Technology Officer George Demmy. “OpenGeoPDF offers limitless, new possibilities for geospatial data interchange and creates much richer analytical applications for end users.”
To start a trial of TerraGo Publisher for ArcGIS, download here.
To start a trial of TerraGo Toolbar for Adobe Reader, download here.
United States Senators Orrin Hatch, R-UT, and John Warner, D-VA, have introduced the bipartisan Geospatial Data Act in the U.S. Congress.
“The federal government wastes vast amounts of taxpayer dollars by not properly managing and coordinating our federal investments in geospatial data,” Sen. Hatch said in a press release. “This common-sense legislation will improve coordination, reduce duplication and promote data transparency.”
“Geospatial data has endless possibilities for transforming both the private and public sectors — from helping local governments develop emergency preparedness plans to fueling the creation of apps that let you find parking spots, restaurants, and even homes for sale based on where you’re standing,” said Sen. Warner. “The federal government is the largest purchaser of geospatial data but some very basic questions about how and where agencies are already investing in this data can’t be answered. Our bill would bring transparency and accountability to the collection of this data and ensure that taxpayer dollars are not being wasted on duplicative efforts.”
The federal government has recognized the need to organize and coordinate the collection and management of geospatial data since at least 1990, when the Office of Management and Budget (OMB) most recently revised Circular A-16 to establish the Federal Geographic Data Committee (FGDC) and to promote the coordinated use, sharing, and dissemination of geospatial data nationwide. Unfortunately, the progress made over the last two decades has been inadequate, according to a statement by Sen. Hatch. “The federal government needs to improve management of geospatial data across the board,” the statement said.
The Geospatial Data Act is designed to codify and strengthen OMB Circular A-16 and require federal agencies to implement international consensus standards, assist in eliminating duplication, avoid redundant expenditures, accelerate the development of electronic government to meet the needs and expectations of citizens and agency programmatic mandates, and improve the efficiency and effectiveness of public management.
Additionally, the bill is intended to provide a clear definition for geospatial data and metadata, will require an accounting of the costs associated with the acquisition or creation of geospatial data, and will improve government transparency and availability to public information.
The leaders of national geospatial organizations applauded the bill. “People believe that the United States of America has a robust system of maps and digital data. We don’t, but we should,” said Shelby D. Johnson, president of the National States Geographic Information Council (NSGIC). “The federal government was never given the tools to do the job right. This act is a good step toward solving the problems, and our members strongly support it. We also applaud Senator Hatch and Senator Warner for their foresight in dealing with this problem.”
“GIS data is an important tool for counties when it comes to making land use decisions, maintaining infrastructure, and responding to emergencies,” said Matthew Chase, executive director of the National Association of Counties. “We support this bill because counties need accurate, modern mapping data to perform key duties and deliver services to their residents. We commend Senators Hatch and Warner for introducing this legislation and urge their colleagues to join them in supporting it.”
EuroGeographics and EuroSDR have announced that they will work together to provide a framework for European spatial data research and development.
The cooperation agreement will further the development of the EuroSDR Research Plan and the activities of the EuroGeographics Knowledge Exchange Networks. As a result, members of both not-for-profit organizations will benefit from greater opportunities for professional development. They will also be able to take part in joint projects and hand over tasks more appropriate to the other organisation’s expertise.
“We have a common interest in carrying out and applying relevant research and developments in the field of geographic information and spatial data infrastructures,” said Ingrid Vanden Berghe, president of EuroGeographics, the membership association of the European National Mapping, Land Registry and Cadastral Authorities.
“With rapid technological advances generated by a digital information society, the time from research via development to operation has never been faster. This agreement will ensure our members remain up to date with and understand the possibilities presented by new technologies and methodologies so they can react more quickly to user demands.”
Martin Salzmann, president of EuroSDR, which links national mapping, land registry and cadastral authorities with research institutes and universities in Europe, added: “Achieving synergy in our activities benefits both our members and society by strengthening research and development, sharing results of common interest and making these operational. At the same time, we will foster and stimulate a vibrant research community with which to capitalise on future technologies and to be responsive to user demands. By working together we also avoid the risks of duplication of work between us and our member organisations.”
EuroGeographics and EuroSDR are both committed to supporting wide range of initiatives that will benefit people across Europe, the companies said. These include the European Spatial Data Infrastructure, Copernicus, Galileo, Horizon2020, European Location Framework and the European Digital Single Market.
DigitalGlobe, a global provider of high-resolution satellite imagery and geospatial solutions, has signed of a Memorandum of Understanding with the United Nations.
Under the agreement, DigitalGlobe and the United Nations Office for Outer Space Affairs (UNOOSA) will take stock of their combined expertise in the use of earth observation technologies for economic, social, and scientific development and improved decision-making, particularly in developing countries.
UNOOSA and DigitalGlobe will work to develop an online platform to provide easy access to imagery catalogues as well as data and analytical services specifically tailored for the needs of the United Nations. Under the agreement, DigitalGlobe will provide advisory services on remote-sensing imagery and geospatial analytics, working with UNOOSA to advance and accelerate adoption of geospatial and satellite imagery-based analytics across the entire United Nations System.
The cooperation will also extend to DigitalGlobe’s participation in relevant UNOOSA-supported events and activities, including those of the United Nations Platform for Space-based Information for Disaster Management and Emergency Response (UN-SPIDER) and of the United Nations Geographic Information Working Group (UNGIWG).
“Cooperation and collaboration in the area of geospatial information and analytics will improve how the United Nations, including its member states and its system of organizations, can address global economic, environmental, geopolitical, and societal issues,” said Simonetta Di Pippo, director of UNOOSA.
“DigitalGlobe is thrilled to partner with UNOOSA, the United Nations body that promotes international cooperation in the peaceful uses of outer space,” said Jeffrey R. Tarr, DigitalGlobe president and CEO. “The arrangement provides an ideal platform to explore how high-resolution satellite imagery and geospatial analytics can be more efficiently and effectively shared across the entire United Nations System, thus propelling us toward our purpose of ‘Seeing a Better World.”
Even if you aren’t a basketball fan, you’ve likely heard the term “March Madness” over the years. It refers to a time when the best U.S. college basketball teams compete for the championship title. Demonstrating the diversity of GIS, a Harvard University professor has introduced an interesting method of analyzing basketball team and player performance using GIS spatial analysis techniques.
At the MIT (Massachussets Insitute of Technology) Sloan Sports Analytics Conference 2012 (March 2-3, 2012), Harvard Professor Dr. Kirk Goldsberry presented Court Vision, “a new esemble of analytical techniques designed to quantify, visualize, and communicate spatial aspects of NBA performance and unprecedented precision and clarity.”
Dr. Goldsberry argues that conventional performance metrics, such as shooting percentage, ignore spatial information. This is odd, Dr. Goldsberry explains, because basketball is a spatial sport. For example, the NBA players with the top shooting percentages are all forwards or centers, who typically shoot from shorter distances than players in the guard position. Without analyzing the spatial shooting tendencies, key scoring phenenom remain misunderstood and coaches and players are missing out on an opportunity to accurately analyze and refine their strategies.
Who’s the Best NBA Shooter?
“Data: Using game data sets for every NBA game played between 2006 and 2011, we compiled a spatial field goal database that included Cartesian coordinates (x,y) for every field goal attempted in this 5-year period. This data set includes player name, shot location, and shot outcome for over 700,000 field goal attempts. We mapped the shot data atop a base map of a NBA basketball court (Figure 1). Although a regulation NBA court is 4,700 ft2, (50ft x 94ft), almost all (>98%) field goal attempts occur within a 1,284 ft2 area in between the baseline and a relatively thin buffer around the 3-point arc; we call this area the “scoring area.” We divided the scoring area into a grid consisting of 1,284 unique “shooting cells,” each 1 ft2 (Figure 1). To quantify shooting range, we applied spatial analyses to evaluate shooting performance across the grid and within each shooting cell.”
NBA field goal attempts 2006-2011 (Source: Dr. Kirk Goldsberry).NBA field goal attempts (Source: Dr. Kirk Goldsberry)
“Our composite shot maps from 2006-2011 NBA game data. The first map summarizes the density of all field goal attempts during the study period. The second map reveals league-wide tendencies in both shot attempts and points per attempt. Larger squares indicate areas where many field goals were attempted; smaller squares indicate fewer attempts. The color of the squares is determined by a spectral color scheme and indicates the average points per attempt for each location. Orange areas indicate areas where more points result from an average attempt, and blue areas indicate fewer points per attempt.”
“We derived metrics that described spatial aspects of shooting performance throughout the scoring area. The most basic metric is called “Spread,” which is simply a count of the unique shooting cells in which a player has attempted at least one field goal. The raw result is a number between 0 and 1,284 and summarizes the spatial diversity of a player’s shooting attempts. By dividing this count by 1,284 and multiplying by 100, we generated Spread%, which indicates the percentage of the scoring area in which a player has attempted at least one field goal.”
“Spread describes the overall size of a player’s shooting territory. League leaders in FG% generally have a small Spread value since they tend to only shoot near the basket. For example, since centers generally thrive in limited areas near the hoop they tend to have lower Spread values than shooting guards. Kobe Bryant has the highest spread value in the NBA (table 1); Bryant’s value of 1,071 indicates he has attempted field goals in 1,071 of the 1,284 shooting cells or 83.4% of the scoring area. In contrast, Dwight Howard has attempted field goals in only 23.8% of the shooting cells. Although Spread% favors players who simply shoot frequently, it also reveals that some players like Dwight Howard who do shoot a lot, only do so in limited court spaces. For example, Al Jefferson attempted 400 more field goals than Ray Allen during the study period, yet his Spread value is only 595 (46.3%), while Ray Allen’s is 952 (74.1%). Visual depictions of the spread variable expose the stark differences in individual players’ spatial shooting behaviors. Via the graduated symbol cartographic technique, figure 2 reveals the spatial structure of Al Jefferson and Ray Allen’s field goal attempts during the study period. Jefferson is highly active in the central areas near the basket, and clearly favors posting up defenders on the right side of the court. Meanwhile, Ray Allen is highly active behind the 3-point arc; he attempts many 3-point field goals, but is relatively inactive from mid-range areas.”
Spread variable for Al Jefferson (Source: Dr. Kirk Goldsberry)Spread variable for Ray Allen (Source: Dr. Kirk Goldsberry)
“These Spread visualizations reveal a player’s basic shooting tendencies, but tell us nothing about potency. Shooting skill requires more than just attempts; the best shooters in the league are able to make baskets at effective rates from many court locations. To describe the spatial potency of players we created a metric called “Range,” which is a count of the number of unique shooting cells in which a player averages at least 1 point per attempt (PPA). PPA varies considerably around the court. As anyone who has ever shot a basketball knows, the probability of a shot attempt resulting in a made basket is spatially dependent; some shots are easier than others, and some players are unable to shot effectively from most court locations. Range accounts for spatial influences on shooting effectiveness. It is essentially a count of the number of shooting cells in which a player averages more than 1 PPA; we chose PPA over FG% because it inherently accounts for the differences between 2-point and 3-point field goal attempts.”
“By dividing this count by 1,284 and multiplying by 100, we generated Range%, which indicates the percentage of the scoring area in which a player averages more than 1 PPA. Steve Nash is ranked first. He has a Range value of 406, indicating that he averages over 1 PPA from 406 unique shooting cells, or 31.6% of the scoring area. Ray Allen was ranked second (30.1%), Kobe Bryant (29.8%) was third, and Dirk Nowitzki (29.0%) was fourth (table 2). Figure 3 visualizes the shooting range of these four players.”
“Steve Nash has the highest Range% in our case study, but does this mean he is the best shooter in the NBA? That obviously remains debatable; however it is certain that over the last few NBA seasons, Nash and Ray Allen are the most effective shooters from the most diverse court locations. The average shooter in the NBA has a Range% of 18.5, meaning they score efficiently from 18.5% of the scoring area. Nash and Allen are the only two players in the league whose Range% values exceed 30%; only a handful of players in the league average more than 1 PPA from at least 25% of the scoring zone (table 2), and unsurprisingly, despite being among the leaders in FG%, Dwight Howard (Range% = 6.5) and Nene Hilario (Range% = 3.7) are not on that list. Whether the Range% metric is the best way of quantifying shooting range or not, it seems to capture pure shooting ability better than FG% or eFG%.”
The following images depict the shooting ranges of Steve Nash, Ray Allen, Dirk Nowitzki, and Kobe Bryant. According to Dr. Goldsbery, “these four players had the highest range values, but these graphics reveal that they achieve them in much different ways. For example, when compared to the three others, Dirk Nowitzki shoots relatively few 3-point shots and performs much better in the mid-range areas on the left side of the court, while Ray Allen excels in the corners of the court where Steve Nash rarely shoots.”
Steve Nash shooting range (Source: Dr. Kirk Goldsberry)Ray Allen shooting range (Source: Dr. Kirk Goldsberry)Dirk Nowitzky shooting range (Source: Dr. Kirk Goldsberry)Kobe Bryant shooting range (Source: Dr. Kirk Goldsberry)
“Steve Nash has the highest Range% in our case study, but does this mean he is the best shooter in the NBA? That obviously remains debatable; however it is certain that over the last few NBA seasons, Nash and Ray Allen are the most effective shooters from the most diverse court locations. The average shooter in the NBA has a Range% of 18.5, meaning they score efficiently from 18.5% of the scoring area. Nash and Allen are the only two players in the league whose Range% values exceed 30%; only a handful of players in the league average more than 1 PPA from at least 25% of the scoring zone (table 2), and unsurprisingly, despite being among the leaders in FG%, Dwight Howard (Range% = 6.5) and Nene Hilario (Range% = 3.7) are not on that list. Whether the Range% metric is the best way of quantifying shooting range or not, it seems to capture pure shooting ability better than FG% or eFG%.”
To view Dr. Goldsberry’s complete paper, click here.