Geo Connect Asia (GCA) 2023, Asia’s leading international geospatial industry event, will take place March 15-16 at Marina Bay Sands Expo and Convention Centre, Singapore.
GCA 2023 will be held alongside Digital Construction Asia (DCA) 2023, and co-located with the launch of Drones Asia 2023. The three-in-one event, held fully in person, is expected to bring together more than 2,500 delegates and attendees from around the world.
With the theme “Advancing sustainable and resilient geospatial solutions for an interconnected world”, a key focus of GCA 2023 will be the use of advancements in geospatial technology and data interoperability to address regional challenges.
Supported by the Singapore Land Authority (SLA), the event will feature more than 70 exhibiting companies and demonstrate the role played by the mix of geospatial, location intelligence, remote sensing and drone-based solutions.
The two-day in-person conference comprises ten main sessions featuring more than 50 prominent industry speakers, panelists and moderators.
Shining light on opportunities for enhancing productivity in the construction world, DCA 2023 will focus on showcasing digitalized processes and improved workflows. By enhancing ground-based equipment with aerial capabilities and implementing technology — such as artificial intelligence (AI), building information modeling and internet of things — current challenges in construction can now be targeted via novel and more efficient approaches.
Drones Asia 2023 will address the commercial UAV industry. The newly launched and co-located show aims to create a focused platform for the complete drone ecosystem.
Drones Asia 2023 plays a critical role in enabling AI in today’s geospatial marketplace, broadening the conversation as industry experts investigate the application of UAVs in the commercial and industrial world, exploring industrial adoption to improve productivity and efficiency.
For the full programme and registration, visit the GCA 2023 website.
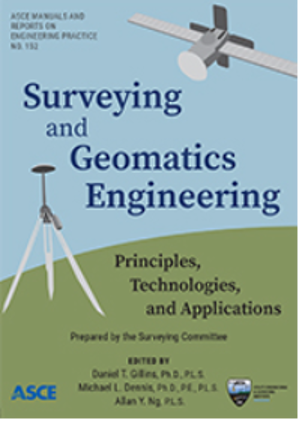
Last year I was privileged to be part of a Blue-Ribbon Review Panel for an American Society of Civil Engineers (ASCE) surveying publication. The book is Surveying and Geomatics Engineering: Principles, Technologies, and Applications. I recently received my copy of the published book in the mail and decided to highlight some sections. While preparing this column, the chapters reminded me of how geodesy has expanded into so many different disciplines.
I first mentioned this in my July 2020 article for the “First Fix” column of GPS World, where I stated that the shortage of American trained geodesists poses a significant economic risk for the United States. In that column, I mentioned how geodetic science and technology now underpin many sciences, large areas of engineering (such as driverless vehicles and drones), navigation, precision agriculture, smart cities and location-based services. That is why I believe understanding geodesy is more critical today than ever. In January 2022, Mike Bevis, collaborating with others, prepared a white paper titled “The Geodesy Crisis,” documenting the concern about the lack of trained geodesists in the United States.
Image: Dana Caccamise II
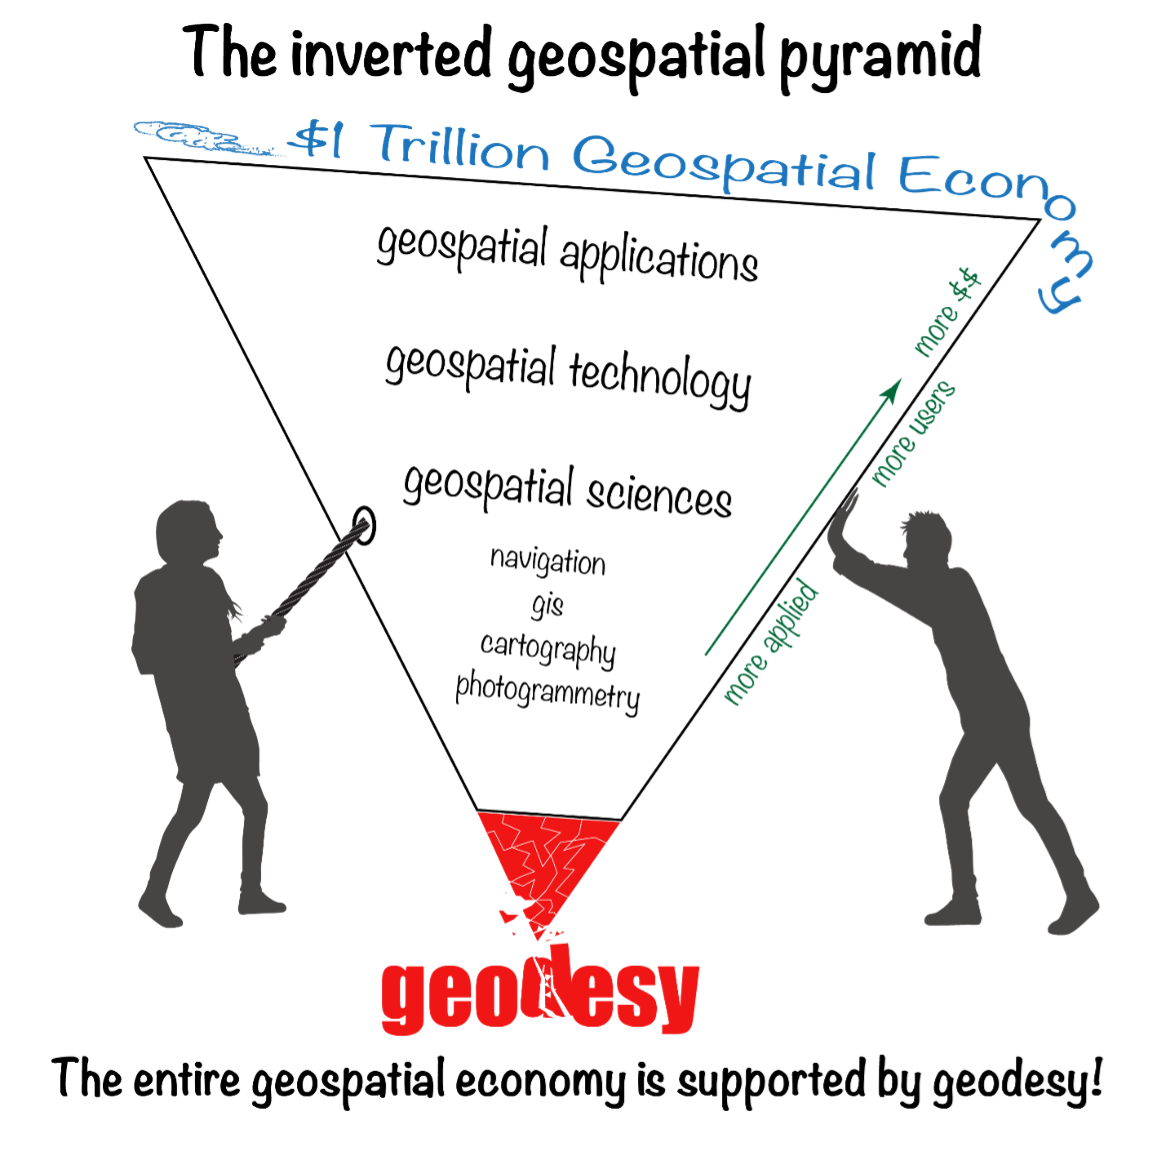
“The inverted geospatial pyramid” graphic depicts how the entire $1 trillion geospatial economy is supported and dependent on geodesy, and how it’s close to collapsing without an increase of support for geodesy. A lack of geodetic expertise in the United States presents a significant challenge, with future impacts on positioning, navigation, mapping and dependent geospatial technologies.
In my opinion, without investment in geodesy, the United States will not have the available skills and knowledge to develop new geodetic technologies and improve models to address challenges to society, such as
how the Earth’s surface is changing as sea level rises and the Earth’s glaciers and ice sheets change on timescales of months
how the tectonic plates are deforming and what physical processes control earthquakes, and
the ability to monitor the temporal changes in Earth’s water reservoirs by measuring changes in Earth’s gravitational field as it responds to the moving water mass and the deformation of the solid Earth caused by moving water.
These challenges need a well-maintained, stable terrestrial reference frame (TRF) with sub-1 mm/year vertical accuracy. Errors in TRF heights can propagate systematically into estimates of atmospheric water vapor, sea level, satellite orbits and other parameters. An accurate TRF can lead to important observations and discoveries because it enables revelations from coherent global motions. (My previous column described the latest International Reference Frame of 2020 [ITRF2020].)
Geodesy has been a significant part of my life for 50 years. I’ve seen a lot, and unless we address the Geodesy Crisis, the innovations in geodetic science of the past will not continue in the future. At least not in the United States.
The Geodesy Crisis paper was mentioned in the Fall 2022 ION Quarterly Newsletter by Everett Hinkley (see the box below). Hinkley noted, “The geospatial community relies on geodesists, though few in the community are fully aware of this connection nor understand the importance of geodesy to their work.” I encourage everyone to download the white paper and the ION Quarterly Newsletter to understand the importance of the need for more trained geodesists.
Excerpt from Everett Hinkley’s Article
“In January 2022, a white paper entitled America’s loss of capacity and international competitiveness in geodesy, the economic and military implications, and some modes of corrective action was released (Bevis et al.). This collaborative paper paints an alarming picture of the dwindling pool of trained geodesists within the United States. The report highlights America’s loss of capacity and international competitiveness in geodesy and states: ‘The U.S. is on the verge of being permanently eclipsed in geodesy and the downstream geospatial technologies. This decline in capability threatens our national security and poses major risks to an economy strongly tied to the geospatial revolution, on Earth and, eventually, in space.’ Though the word crisis correctly describes the dire predicament well, it didn’t occur overnight. Due to several converging trends, the geodesy crisis has been decades in the making. A national lack of geodetic expertise presents a significant challenge with downstream impacts on positioning, navigation, mapping, and dependent geospatial technologies. The Department of Defense, intelligence community, and federal civil agencies’ mapping entities rely on accurate and precise maps for a broad range of purposes, and reliable maps depend on an accurate geodetic underpinning. The geospatial community relies on geodesists, though few in the community are fully aware of this connection nor understand the importance of geodesy to their work.” (Reproduced with permission from ION.)
In my “First Fix” column, I mentioned that I attended The Ohio State University (OSU) to obtain my graduate degree in Geodetic Science in 1979. Therefore, I admitted that I am a little biased — once a geodesist, always a geodesist. That said, in OSU’s geodesy heyday (1960–1990s), many Americans trained were sent there by federal agencies: National Geospatial-Intelligence Agency (NGA), NOAA/National Geodetic Survey (NGS), USGS, Army, Navy and Air Force. During the 1970s, NGS sent two employees back to school every year. These agencies needed geodesists because they were undertaking significant projects, such as the NGS projects to readjust the U.S. national horizontal (NAD83) and vertical geodetic (NAVD88) networks. I was one of the employees NGS sent to OSU to be trained to support the NAD83 and NAVD88.
Today, the environment is different. U.S. federal agencies still need geodesists to develop enhanced and refined geodetic models and tools. However, major U.S. companies, such as Google and FedEx, the automobile industry, the construction industry (automated machine guidance), precision farming companies and mining companies also need more accurate geodetic models, tools and algorithms. Therefore, these companies also need trained geodesists to perform essential research on topics that address their geodetic requirements. As indicated in “the inverted geospatial pyramid” graphic, the entire $1 trillion geospatial economy is supported by geodesy.
As implied in Hinkley’s article, geodesy has played a role in developing geospatial products but most users didn’t realize that it was their foundation. Since it’s been in the background, everyone assumes it will always be there. A participant at one of my workshops stated that “GPS has made geodesists out of all of us.” In my opinion, the advancements in GNSS equipment and processing software provided some users with a “false sense of knowledge or security” that they understood what was happening within the “black box.” One of my colleagues at NGS said that the new equipment and software programs were creating a field force of “buttonologists.”
These statements concerned me at the time and concern me today. With the last generation of trained geodesists either retired or getting ready to retire, we are at a critical stage of not being able to meet the geospatial needs of the future. As indicated in the white paper, there are significant challenges in rebuilding programs that support the training of geodesists.
Hinkley’s article summarized several action items that could help improve the lack of trained geodesists in the United States. I’ve provided his list in the box below. I’ve highlighted several items the surveying and mapping community can help achieve.
So how do we build and educate the next generation of geodesists?
Make the White House and Congress aware of this crisis, particularly its national security implications; seek direct support in the federal budget to correct this issue. It has become clear that, without engagement at the highest echelons of the U.S. government, averting this current crisis and its eventual outcome is unlikely.
Teach rigorous math in our public schools; follow the scholastic math approach used in many Asian and European countries.
Encourage creative thinking!
Actively market geodesy in high schools as a rewarding career for the math stars before college entry.
Build back, support and sponsor geodesy programs at select universities. This support needs to be strategic, with backing from the highest levels of the U.S. government.
Break our cultural trend of reactions to crises and seize the opportunity to be proactive and prevent the foreseen consequences of this crisis.
Encourage U.S. government support in the form of grants, professional development of staff, and research collaborations/affiliations. There are early efforts underway to bring new talent into the pipeline:
the National Geospatial-Intelligence Agency (NGA) is forming an emerging scientist consortium (ESCON) with partnerships that exist with Ohio State, UT-Austin, and other industry/academic/government partners
a pilot Ph.D. geodesy educational program with three NGA and one NGS employee is in place; the NGA expects to continue growing this program.
the NGA’s new western headquarters in St. Louis will bring 350 companies and organizations into the regional GEOINT ecosystem.
If we answer this call to action collectively, there is hope that a new cadre of U.S. geodesists can be cultivated before it’s too late to recover.
(Reproduced with permission from ION.)
With all that said about the need for more geodesists, one thing that this ASCE publication may do is make some readers realize how much they don’t know about the roots of the technology that they’re using to create geospatial products and services. This knowledge gap is not just correctly using GNSS and other geospatial technology to perform a survey, but also integrating various instruments to create an accurate mapping system, such as mobile mapping and terrestrial laser systems. My intent is not to criticize the expertise or knowledge of anyone, and I only mean to point out that in today’s use of computers and programs, many technical concepts are hidden in “black boxes.” I learned many things about some topics by reviewing this book.
The book is 556 pages and has 15 chapters. As part of my responsibilities as a Blue-Ribbon Panel member, I read every word in the book, and not many people will read the entire book. Still, I would encourage surveyors, engineers, geodesists, photogrammetrists and GIS and remote-sensing practitioners to obtain a copy of the book for reference and to understand the limitations of geospatial technology.
Now to the book’s content. I want to highlight that the forward is written by Juliana Blackwell, director of the National Geodetic Survey (NGS). She states that “A common thread running through the manual is the importance of the National Spatial Reference System (NSRS) to modern geospatial applications.”
Most of my columns highlight something relevant to the NSRS. That’s because the NSRS is the foundation layer for United States federal geospatial products, and geodesy provides the foundation for all geospatial products and services as indicated in the “The inverted geospatial pyramid” figure.
I would also like to highlight a statement by Gene Roe in the preface. He states, “Because entire books could be devoted to each of these topics, this manual only provides a summary, and it points the readers to important references where they can find more details. The manual is meant to provide a comprehensive but general overview to help support education and inform practicing engineers on the important role of the surveying engineer. It is too important for this not to occur.”
I agree with Roe’s statement that the book is important for surveying engineers. Still, I would add that this book is important to anyone working with GNSS and other geospatial data, especially geodesists, surveyors and GIS practitioners.
This publication is edited by three individuals that are licensed surveyors; two of them are geodesists who work for NGS. These individuals have performed a fantastic job of ensuring that all chapters have been reviewed for correctness and that the information provided is current and essential for users of geospatial data.
Readers can download copies of the book and specific chapters here. You can buy it as an e-book or in print. The “Abstract” box summarizes the book from the ASCE Library website.
Abstract
Sponsored by the Surveying Committee of the Surveying and Geomatics Division of the Utility Engineering and Surveying Institute of ASCE and the National Geodetic Survey of the US National Oceanic and Atmospheric Administration
Surveying and Geomatics Engineering: Principles, Technologies, and Applications, MOP 152, is a comprehensive yet general overview to help support education and inform practicing engineers on the important role of the surveying engineer. It provides a much-needed update on the modern practice of surveying and geomatics engineering.
Topics include:
• geodesy
• coordinate systems and transformations
• least squares adjustments and error propagation
• modern surveying and remote sensing technology
• analysis and establishment of control
• geographic and building information systems
• construction surveying, and
• best practices.
MOP 152 can be used as a summary and a reference for practicing engineers, surveying and otherwise, to help provide a solid understanding of the state of the surveying and geomatics engineering field.
Below is a list of the chapters and their authors. This column cannot highlight everything important in this book, but I will select a few items to which I believe users of geospatial data should pay attention.
Chapter Titles
Chapter Number
Chapter Title
Author(s)
Forward
Juliana P. Blackwell
Preface
Gene V. Roe
Acknowledgments
Daniel T. Gillins
1
Engineering Surveying Within ASCE
Gene V. Roe
2
Geodesy and Geodetic Computations
Earl F. Burkholder
3
Map Projections and Local Coordinates Systems
Michael L. Dennis
4
Local, Regional, and Global Coordinates Transformations
Michael L. Dennis
5
Analysis and Adjustment of Observational Errors
Charles D. Ghilani
6
Satellite-Based Surveying Technology
Jan Van Sickle
7
Leveling and Total Stations
N.W.J. Hazelton
8
Terrestrial Laser Scanning
Michael J. Olsen
9
Mobile Terrestrial Laser Scanning and Mapping
Michael j. Olsen, Jaehoon Jung, Erzhuo Che, Chris Parrish
10
Aerial Surveying Technology
Michael J. Starek, Benjamin E. Wilkinson
11
Survey Control
Daniel T. Gillins
12
Construction Surveys
Marlee A. Walton
13
Survey Records
Andrew C. Kellie
14
Information Systems in Civil Engineering
Yelda Turkan, Dimitrios Bolkas, Jaehoon Jung, Matthew S. O’banion, Michael Bunn
15
Professional Services and Design Professionals Agreements
David E. Woolley, Lisa D. Herzog
As a geodesist, I usually focus on topics relevant to geodetic science. This book has a lot of topics that use geodesy concepts to create an engineering product or service. For example, chapter 2, “Geodesy and Geodetic Computation” by Earl Burkholder, provides a good summary of geodetic concepts that anyone using or generating geospatial products should know and understand. It gives basic equations without lengthy derivations of how they were developed.
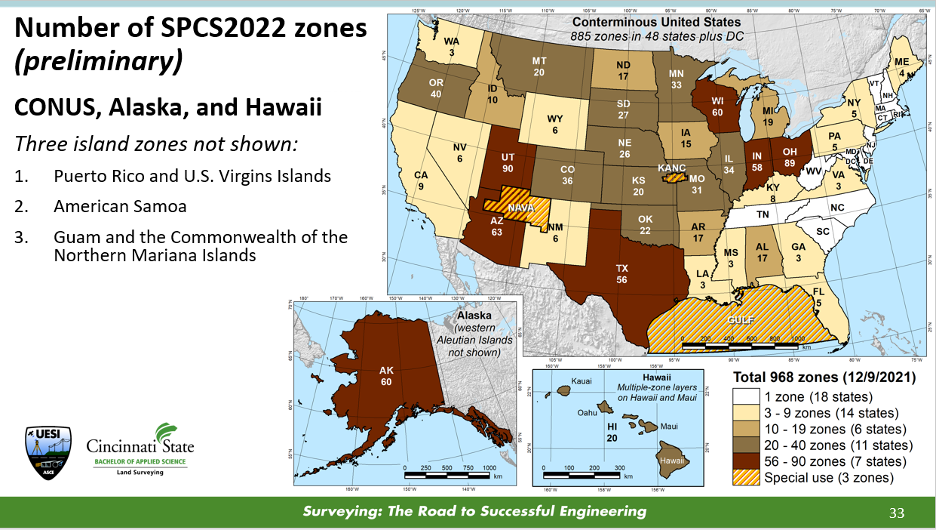
In my opinion, chapter 3, “Map Projections and Local Coordinates Systems” by Michael Dennis, does the best job of explaining the concepts of map projections that are relevant to the surveying and mapping community. Many GIS practitioners use map projections in their software but don’t have a working knowledge of what’s happening to their original data. This chapter describes the current United States State Plane Coordinate System of 1983 (SPCS83) and the future State Plane Coordinate System of 2022 (SPCS2022) that is scheduled to be adopted in 2025. Dennis uses figures and diagrams to describe map projections, angular and linear distortion, and methods for reducing map projection distortion to make it easier for readers to understand the concepts. One section of interest to many surveyors after SPCS2022 is adopted is the Low-Distortion Projection (LDP) Coordinate Systems section. This is useful because, in SPCS2022, many states have designed LDP systems for their state’s SPCS2022. The box below provides a diagram with the number of zones for each state.
Image: NGS Presentations Webpage “Grids for the Future: A New Approach for Designing State Plane Coordinate System Zones” by Michael Dennis.
One purpose of an LDP is to reduce linear distortion; it is not a new concept. Many surveyors have performed a simplified form of it for decades. It’s known by many as a “modified” or “scaled” State Plane. The American Congress on Surveying and Mapping (ACSM) taught a workshop for decades describing how to compute a “modified” State Plane Coordinate. I was an instructor of this class in the 1980s and 1990s. “Modified” State Plane Coordinates had several issues, but they worked reasonably well in small areal extents. Today, with the advancements in computers and computer software, there are better ways to accomplish an LDP. Dennis’ section does a great job explaining the new SPCS2022 and the design of LDPs in the SPCS2022. The use-case examples provide a simplified description of understanding the linear distortion behavior in an area.
Chapter 4, “Local, Regional, and Global Coordinate Transformation” by Michael Dennis, is one that every surveyor and GIS practitioner should read. Dennis highlighted the differences between “equation-based” transformations and “grid-based” transformations, as well as combined equation-based transformations with grid-based transformations. Understanding the information provided in chapter 4 will be important when NGS replaces the NAD 83 (2011) and NAVD 88 datums with the new, modernized NSRS in 2025. NGS will provide models and tools for users to perform coordinate transformations, but hopefully, some users will want to understand what’s happening behind the scenes.
Chapters 8 and 9 discuss laser scanning systems. In chapter 8, “Terrestrial Laser Scanning,” the “Data Quality Considerations” section highlights common artifacts or limitations encountered with terrestrial lidar system data. The authors provide many examples of these artifacts, making the concept easy to understand. At the end of this chapter, there are 14 pages of references that will be very helpful to users involved with terrestrial laser scanning systems.
Chapter 9, “Mobile Terrestrial Laser Scanning and Mapping,” is very informative, especially the section on georeferencing. This section is not just the description of properly using GNSS to perform a survey, but also the integration of various instruments to create an accurate mobile mapping system. I like how the authors discussed the error sources in georeferencing the system, listed the source, and provided an explanation of the error.
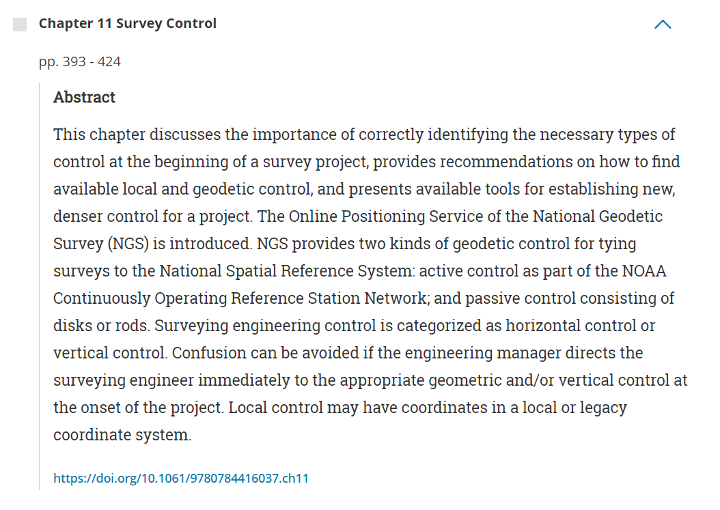
Anyone performing a GNSS survey project that meets NGS’s requirements needs to read chapter 11. I like the section describing how users should evaluate CORSs before using them as control. Evaluating CORS is something all users should do before using any CORS in their project, because not all CORS are created equal. See the excerpt from chapter 11 below for the recommended steps from the author.
Excerpt from Chapter 11 – Steps for Evaluation of CORS
The author recommends the following steps:
1. Choose stations that are within 100-300 km of a project site. It is well known that errors in GNSS baseline processing are directly correlated with baseline length (Chapter 6). Tropospheric delay is reduced when baselines are shorter and atmospheric conditions at each end of the line are similar. In addition, mutual satellite visibility at each end of the line for differencing diminishes as baselines grow longer. That said, errors in GNSS processing are more occupation time-dependent than baseline length-dependent (Eckl et al. 2001). Therefore, for short GNSS sessions (i.e., < 2 hours), choose CORS within approximately 100 km as control; for moderate GNSS sessions (i.e., 2 to 8 h), choose CORS within approximately 300 km. Note that even longer baselines can be successfully processed when GNSS sessions are very long in duration (e.g., up to 2,000 km for 24 h sessions).
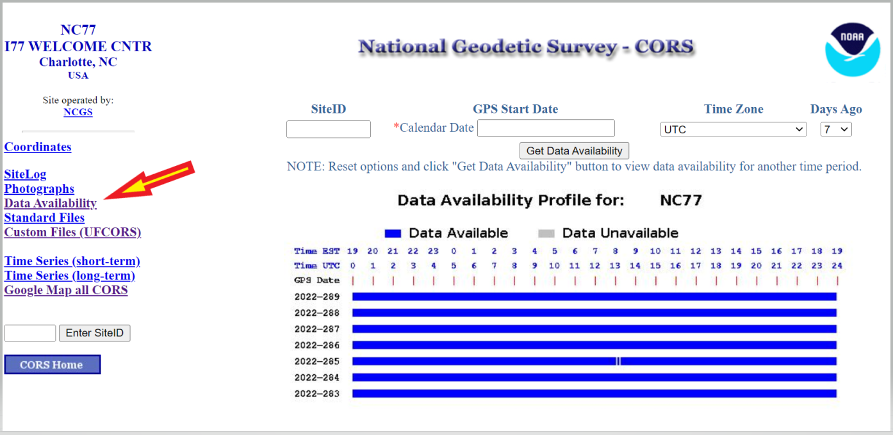
2. Determine if GNSS data are available at a given CORS during the time of your survey. Of course, if data are unavailable, then the station simply cannot be used as control. NGS provides a tool known as “User Friendly CORS (UFCORS)” for entering a date and time range to view available data at a given station (NGS 2021c). This tool can also be used to download the raw GNSS data for processing and adding a station to the survey network.
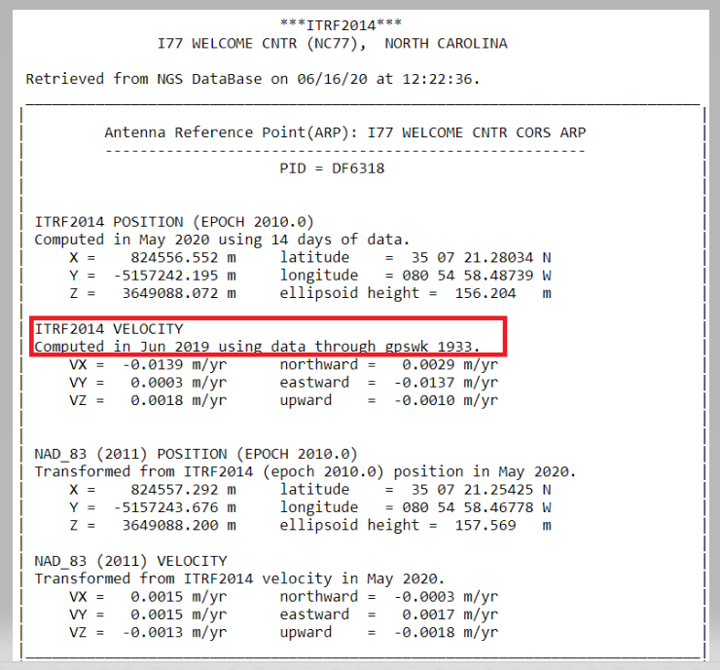
3. As discussed previously and when possible, choose a CORS with computed velocities rather than modeled velocities from HTDP. NGS provides tables of official coordinates with “computed” versus “htdp” coordinates and velocities on the website for CORS.
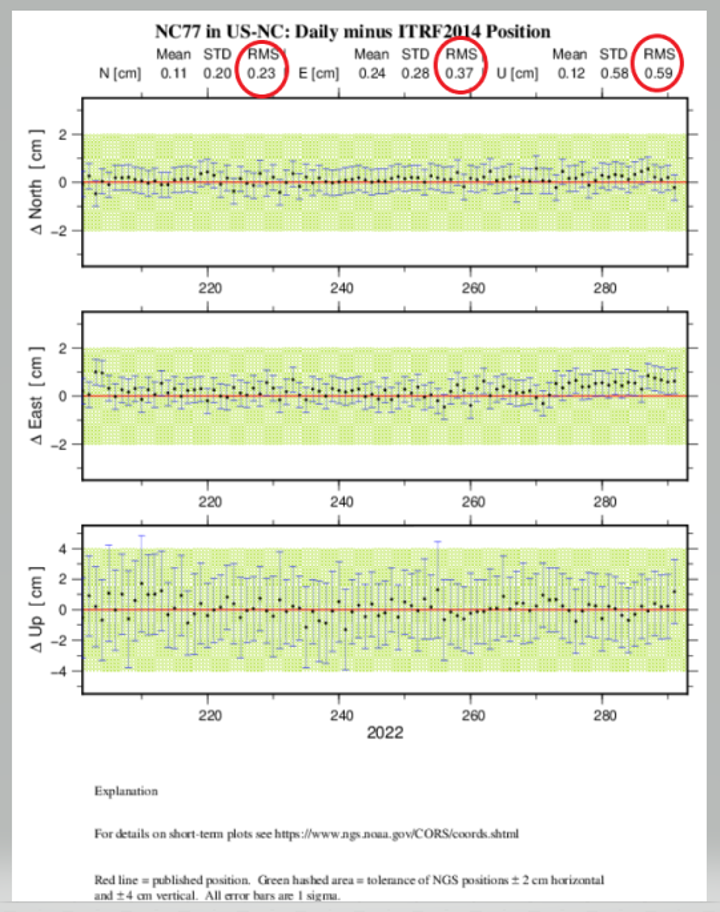
4. Review the aforementioned short-term time-series plot for the station, ideally at the time of the project. Stations with large spikes, data gaps, bias from the published “red” line, or large standard deviations should be avoided. A good rule-of-thumb is for the RMS in the short-term time-series plot (Figure 11-2) to be less than 1.0 cm in north and east and 2.0 cm in the up direction in a local geodetic horizon frame at the station.
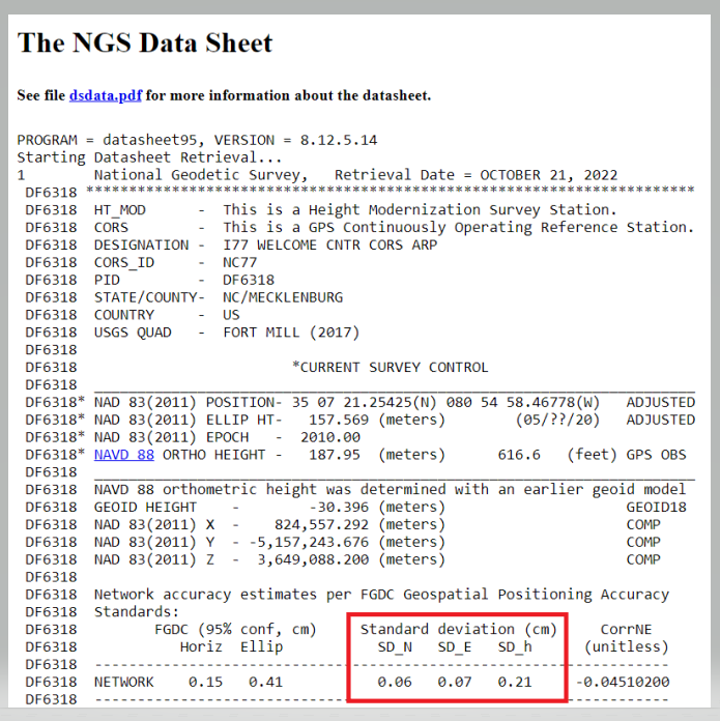
5. Examine the formal uncertainties for the official coordinates of the CORS. Standard deviations in north, east, and up are provided on the station’s datasheet, accessible from the webpage for the CORS (more on datasheets are discussed in the following under Passive Control). Stations with unusually large standard deviations (> 3 cm) should be avoided. Note that standard deviations are not available for CORSs with modeled velocities.
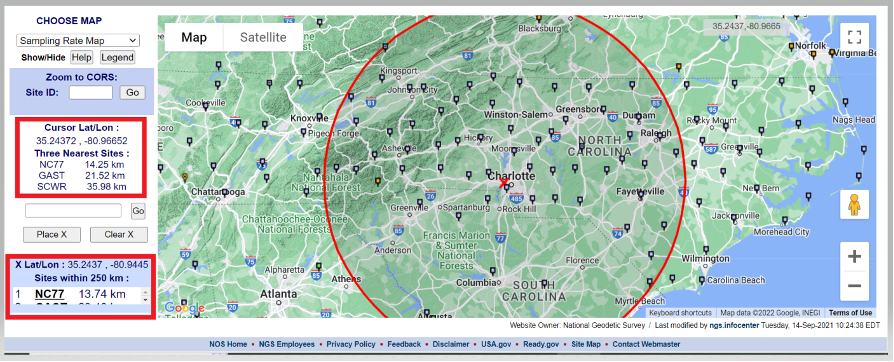
I believe that the evaluation of NOAA CORS is critical, so I’ve described Dan Gillins’ “Steps for Evaluation of CORS” below. First, users can access the NOAA CORS using the NGS CORS Map utility. After the map appears, users can move the cursor over the center of the project area, where it provides the location of the cursor and the three closest CORS. Users can click on a CORS icon and get coordinates and other information about the CORS. Also, they can place an X on the map, and the utility will draw a 250-km circle around the point. The box in the lower left-hand side of the map provides a list of the sites within 250 km of the marked location.
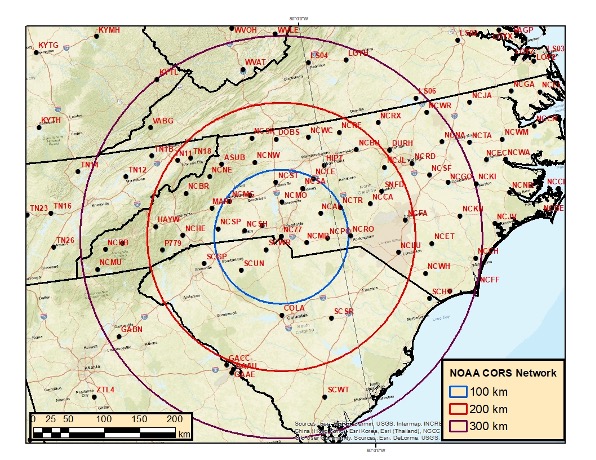
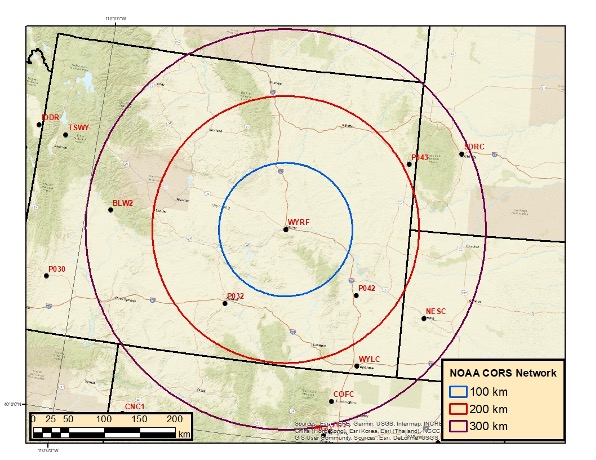
Users can download the NOAA CORS coordinates and velocities (computed and modeled). I downloaded the files and plotted three circles (with radii of 100, 200, and 300 km) around CORS NC77 in Charlotte, North Carolina. I only plotted CORS that are operational and have computed velocities. North Carolina has a lot of CORS to select from. In contrast, I’ve plotted three circles (also with radii of 100, 200 and 300 km) around CORS WYRF in Casper, Wyoming.
Buffer Zones around Charlotte, NC
Image: Dave Zilkoski
The plot depicting the buffer zones around Casper indicates that there are no CORS within the 100-km circle and only a few between 100 and 200 km.
Buffer Zones around Casper
Image: Dave Zilkoski
The data availability of the CORS site can be obtained by clicking on the CORS icon, selecting “Get Site Information,” and then selecting “Data Availability.”
There are too many chapters to describe each one, but I encourage users to check each chapter’s abstract on the ASCE website and decide which ones would be the most beneficial to them (see the box titled “Abstract for Chapter 11 Survey Control”). The manual provides numerous references and can serve as a helpful resource for finding further details on the fields of geodesy and surveying.
A goal of mine is for some readers of this column to obtain enough knowledge to “whet their appetite” and encourage them to pursue an education in geodesy and surveying. Others who are influential in federal government programs and those responsible for geospatial research for industries will recognize the need for more trained geodesists in the United States and help by doing the following:
actively market geodesy in high schools as a rewarding career for the math stars before college entry
build back, support, and sponsor geodesy programs at select universities; this support needs to be strategic with backing from the highest levels of the U.S. government
encourage U.S. government support in the form of grants, professional development of staff, and research collaborations/affiliations.
Advances in geospatial technology have opened up many new possibilities in areas such as national security, urban planning and emergency preparedness. When I was embedded with the U.S. Army as a scientist in Afghanistan, I got to experience firsthand the exceptional value of 3D data. The military used nation-scale imagery and lidar to generate 3D maps that then informed their safety-critical operations. However, since lidar—like most three-dimensional unstructured data—contains incredible complexity and detail, it was painfully slow to analyze manually.
As a result, the impact of this technology was severely restricted by speed and cost due to the significant manual effort required to extract actionable insights. As we looked to the future, where lidar would become commonplace in consumer electronics and automobiles, it became clear that there was an opportunity to combine computer vision/AI with large-scale cloud computing to rapidly and automatically generate actionable insights from 3D data.
Screenshot: Enview
After returning from Afghanistan, I reconnected with Krassimir Piperkov, a former colleague from ICON Aircraft, and fellow Stanford alum, to launch Enview. Our objective was to automate 3D geospatial analytics and create a living 3D model of the world to help organizations to protect their critical infrastructure and communities.
Powering geospatial data with AI can take the limits off 3D data analytics, prevent threats from becoming incidents, and protect critical infrastructure. What used to take days or months to process can now be done in minutes, enabling analysts, operators, and decision-makers across the public sector to make timely and accurate decisions. By enhancing our understanding of the physical world, this technology empowers us to tackle pressing challenges like wildfire prevention, humanitarian assistance, disaster response, and more.
Let’s take a look at how AI-powered 3D modeling is being put to use.
Digital twins
A living 3D model of the world, or a digital twin, can be used for many purposes. Enview’s software fuses many different data sets together to create digital twins that are global in scale but have high-resolution to enable local decision-making. These digital twins include 3D terrain, vegetation, buildings, and infrastructure such as power lines, roads, and water works. Enview also fuses real-time and forecasted conditions, such as wind, temperature, humidity, traffic, and IoT (internet of things).
This sort of rich representation of the physical world is an incredibly complex big data challenge. Data comes from radically different sensor modalities, with different resolutions, formats, time-domains, and accuracy. AI plays a critical role in automating the fusion of these datasets, by helping to intelligently align and then fuse them into a cohesive entity. 3D geospatial data is particularly challenging, as it is unstructured data, which requires a new generation of deep learning frameworks whose convolutional kernels are specifically developed from the ground up to work on unstructured data. Further, the datasets are massive in scale. A square-mile of 3D lidar data can have hundreds of millions of points; the magnitude of the data easily passes the petabyte scale when one considers applications that span nation-scale areas. In order to process this volume of data, modern geospatial AI architectures must be containerized and dynamically deployable across cloud compute resources to generate timely insights.
AI is essential to help human experts to extract meaningful insight from this overabundance of data. The application of automated workflows allows experts to look at larger areas, with more speed and higher frequencies. This machine-assisted cognition draws upon the respective strengths of people and computers to do what neither could do on their own.
Humanitarian aid and disaster relief
3D models can be built to monitor hurricane hotspots, such as the Gulf Coast, before major storms strike. By layering in real-time weather information such as rainfall, winds, and flooding, these models can help with planning, emergency response, and relief efforts.
This data also provides life-saving insight that can assess damage to buildings, transportation, and downed power lines, in addition to determining where to send medical and relief supplies, and how to best get them there. 3D data can help to lessen the impact of future weather events by updating the baseline understanding of how storms impact coastal communities so they can plan for the future.
Screenshot: Enview
Infrastructure protection
Inadequate clearances between vegetation and power lines can result in wildfires and unplanned power outages. Many federal, state, and local regulations are in place to mandate clearances, and power line operators monitor their networks continuously to ensure that they abide by these regulations and prevent incidents and outages. However, doing so by walking or flying the lines and judging distances with the human eye is challenging and inaccurate.
The ability to identify the exact location and clearances of high-risk vegetation early, and at scale, lets operators identify, prioritize, and address problem areas proactively. Lidar-driven programs have helped with risk-reduction, but are constrained by the massive levels of manual data manipulation required to derive insights from this 3D data. The automation of 3D geospatial analytics through AI, machine vision, and parallel computing enables the accurate and rapid identification of at-risk areas, protecting critical infrastructure and communities.
Screenshot: Enview
Fighting wildfires
Devastating wildfires resulting in the loss of life and property have become commonplace in the western U.S. and other parts of the world. The tools and methods previously relied on to keep communities and infrastructure safe are now struggling to keep up with this increased threat.
Geospatial information, including 3D data, provides a digital view of the physical world and, when paired with AI, gives stakeholders the informational edge they need to minimize wildfire damage, injuries, and deaths. This technology can be used to automatically build and update real-time, high-resolution wildfire risk maps that give firefighters and communities more notice when threats are imminent, and provide firefighters with real-time situational awareness when they’re fighting the blazes.
Change detection
According to the Pipeline and Hazardous Materials Safety Administration (PHSMA), third-party excavations are one of the leading causes of pipeline incidents in the U.S. These incidents can lead to service disruptions, expensive repairs, and sometimes serious injuries or deaths.
Detecting signs of excavation or earth movement via aerial patrolling is challenging and costly, while resource limitations make it difficult for pipeline operators to continuously monitor remote areas such as farms. AI-powered 3D maps can be used to monitor topography and accurately detect changes that threaten pipelines in real time.
3D data provides remarkable value when it comes to decision-making as it relates to many different applications—from military defense to protecting neighborhoods from wildfires. However, its success hinges on one thing: speed. The ability to process 3D geospatial data rapidly, and at scale, is made possible through advances in AI and cloud computing. In the future, we can expect to see more exciting and innovative use cases for AI-powered geospatial technology.
San Gunawardana is co-founder and CEO of Enview, a geospatial analytics company. After finishing a Ph.D. in aerospace engineering at Stanford, Gunawardana went to Afghanistan, where he combined data analytics and remote sensing to detect threats and prevent incidents. He is excited to apply those insights to help the energy sector solve problems. He has done computer vision at NASA, built imaging satellites with the Air Force, and was an early employee at ICON Aircraft.
The development of augmented reality as a tool to manage and visualize hidden infrastructure assets has taken a major step forward following the announcement of a partnership between two technology companies.
MGISS, a U.K. geospatial specialist, has partnered with Canada-based vGIS to transform traditional GIS, BIM and CAD data into stunning augmented-reality visualizations.
Augmented reality provides an interactive experience of an environment where objects that reside in the real world, such as underground pipes, are displayed and enhanced with additional intelligence such as attribute information and maintenance records.
A specialist in the use of geospatial technology in the utility, infrastructure and environment sectors, MGISS said it understands the demands for improved spatial data quality and the requirement to communicate complex, asset dense, 3D environments in an easy-to-consume way.
Photo: MGISS
By combining authoritative survey-grade positions and associated data with consumer-grade hardware MGISS enables users of vGIS to access augmented reality visualizations from any suitable smart device.
vGIS is the leading augmented and mixed reality visualization technology for GIS data. Using the vGIS system, field personnel can see an augmented view that includes holographic infrastructure objects, improving environmental assessments and increasing situational awareness.
“Initiatives such as digital twinning and the expectation of ‘business as usual’ operations require the capture and representation of increasing complex real-world environments. Asset owners and operators face a number of challenges and opportunities including the need to improve safety, reduce risk and ensure what lies beneath our feet meets future infrastructure needs,” said Mike Darracott, managing director and founder of MGISS.
“vGIS truly understand the needs and the challenges facing these sectors. In fact, vGIS goes further than any other Augmented Reality solution by providing a full range of 3D spatial data capabilities; all within a platform that works with existing enterprise systems and data structures,” added Darracott.
“Value is often hidden deep within the structure of data. By helping people ‘see’ data in more intuitive ways, they gain new insights and can subsequently do more with that information. That’s been the core operating philosophy of vGIS,” said Alec Pestov, founder and CEO of Canada based vGIS. “To achieve this we are building an ecosystem bringing together top experts to work jointly towards a common goal. MGISS possesses deep expertise in the spatial services and solutions sector and we are looking forward to joining forces to deliver augmented and mixed reality visualizations in the UK.”
Australian geospatial startup Spookfish has won a major Asia Pacific industry award for exporting imaging technology to the North American market.
Spookfish has partnered with U.S.-based EagleView Technology Corporation, a North America provider of aerial imagery, and the two companies have collaborated to develop new technologies to meet the demands of the North American market.
In mid-2017, EagleView placed its first large order for multiple Spookfish platforms following an extensive flight-test program. Spookfish is now building the platform in significant volumes to meet EagleView’s demands.
Meanwhile, rollout of the Spookfish imaging technology for Australian customers is underway. Perth-based Spookfish offers high-resolution imagery of Perth, Melbourne and Adelaide online, with Sydney and Brisbane in the works.
Spookfish’s technology enables rapid imaging of vast areas in high resolution from a multitude of angles at a fraction of the cost of contemporary systems, the company claims. Spookfish aims to use these capabilities to make it easy for organizations of all sizes to gain access to premium imagery content and pervasive 3D models allowing concise, accurate and cost effective decision-making.
The Asia Pacific Spatial Excellence Awards (APSEA) showcase excellence within the spatial industry. Presented at Locate & GeoSmart Asia Conference in Adelaide, Australia, the APSEA award recognizes Spookfish’s success in innovating, commercializing and exporting its imagery capture and processing technology. Spookfish took home the APSEA Export Award after competition from companies around the Asia Pacific region.
“This is an exciting achievement for Spookfish and the beginning of a substantial export opportunity for Australia,” said Spookfish CEO Jason Waller. “The award is a testament to the entire Spookfish team and their ability to research, innovate and successfully bring new technology into operation.
“Spookfish has begun delivering multiple systems to our strategic partner, EagleView Technologies, with the export program generating significant revenue from capture systems and expected future royalty payments.
“More importantly, the partnership with EagleView delivers extensive benefits to our Australian customers because as our world-leading technology continues to develop, it immediately becomes available in the domestic market.”
The event, which will take place at the Calgary Telus Convention Centre in Calgary, Alberta, Canada, incorporates elements from the past Tecterra Geomatics Showcase event and continues to add to the Canadian technology landscape, the company says.
It will focus primarily on technology, innovation and commercialization, as well as capitalize on Canada’s position in geospatial technology.
Tecterra is a technology innovation support center focused on enabling the development and commercialization of innovative geospatial technologies.
In coordination with Google, Esri is providing replacement software and training to customers and partners using Google’s enterprise geospatial technology.
NT Concepts, an experienced Google integrator, is announcing a new partnership with Esri to help customers that have implemented Google Earth Enterprise and Google Maps Engine make a smooth transition to the ArcGIS platform with minimal interruptions to their operations.
Esri is a longtime provider of geospatial solutions to the defense and intelligence communities and has developed more than 40 specialized applications for their use.
“NT Concepts has mapped the functionality of Google to Esri’s ArcGIS platform. The current users of Google’s enterprise geospatial products will find the Esri platform to be a key option for meeting their geospatial requirements,” said Chris Powell, chief technology officer at NT Concepts.
For Google Earth customers that would like to transition to the ArcGIS platform, Esri is offering the new ArcGIS 10.3.1 for Server and related client/app technology. In addition to other advanced functionality, these will allow users to publish 2D data, 3D buildings, and KML files throughout the enterprise.
“Esri is delighted to have NT Concepts as our trusted partner for this important work,” said Patty Mims, Esri director for intelligence. “The company provides key skills needed to work with both Esri and Google technology.”