Tag: ITRF2014

  • The effects of vertical movement on NGS’s modernized 2022 NSRS

    The effects of vertical movement on NGS’s modernized 2022 NSRS

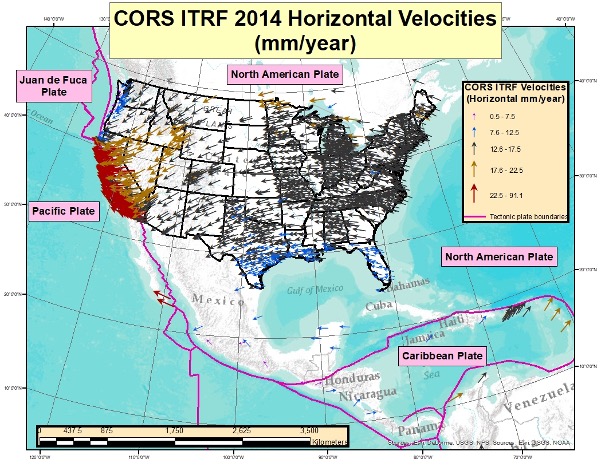
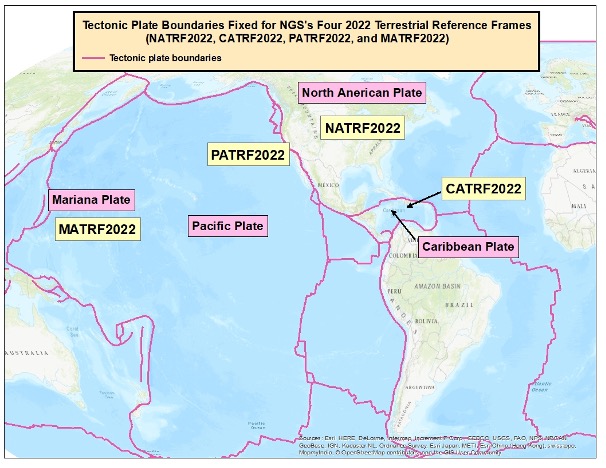
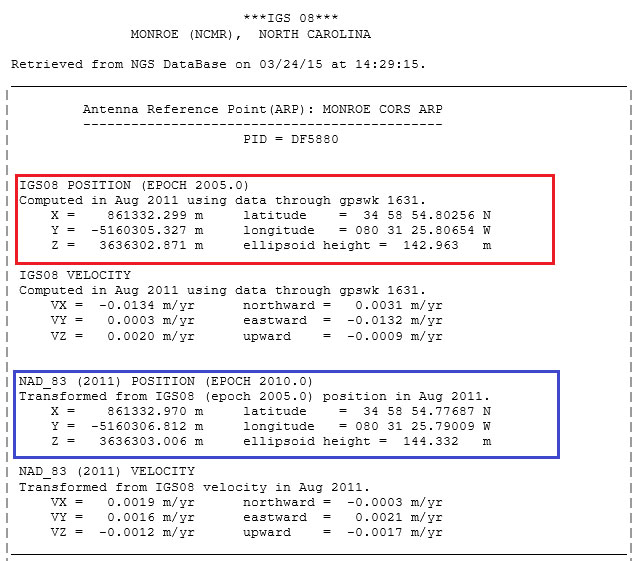
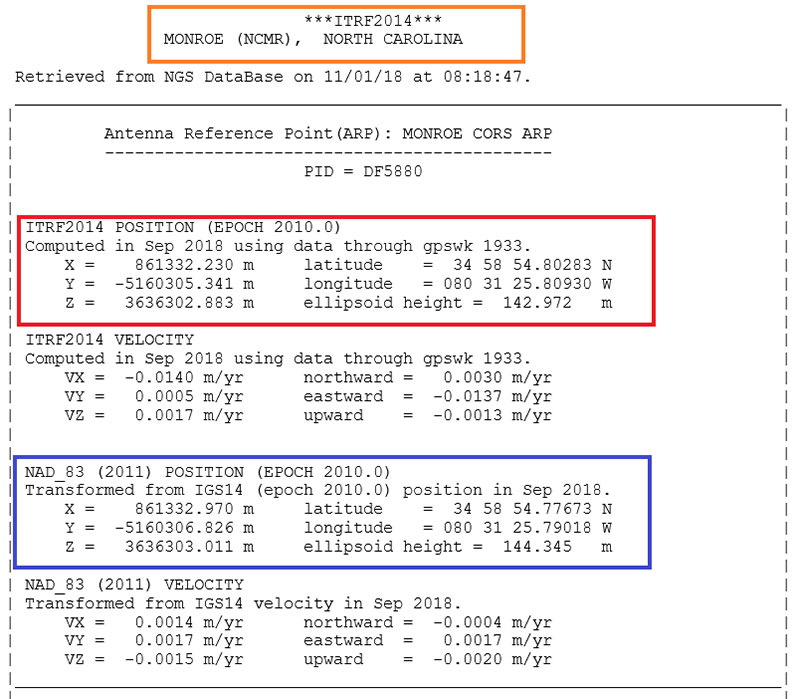
    My February column explained why it is important to account for horizontal movement of marks everywhere, and not just in areas influenced by active crustal movement due to earthquakes such as Southern California.

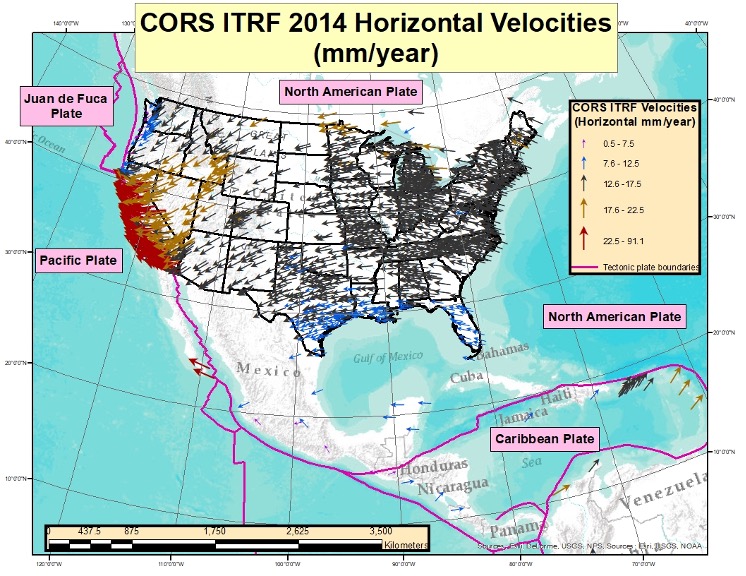
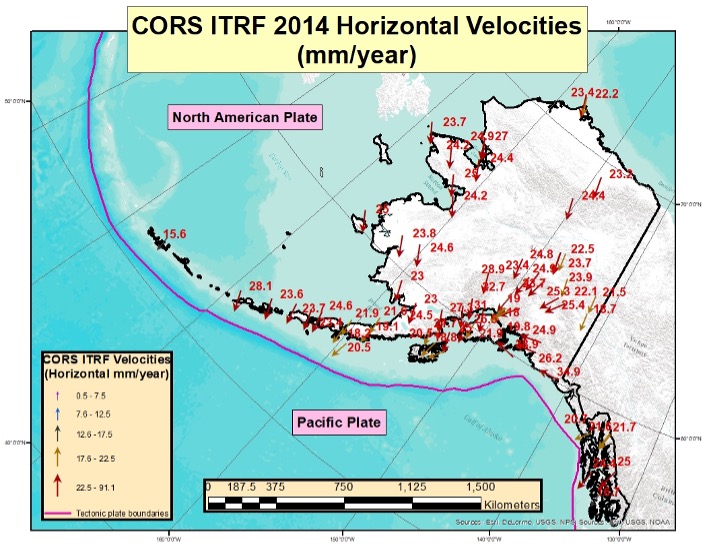
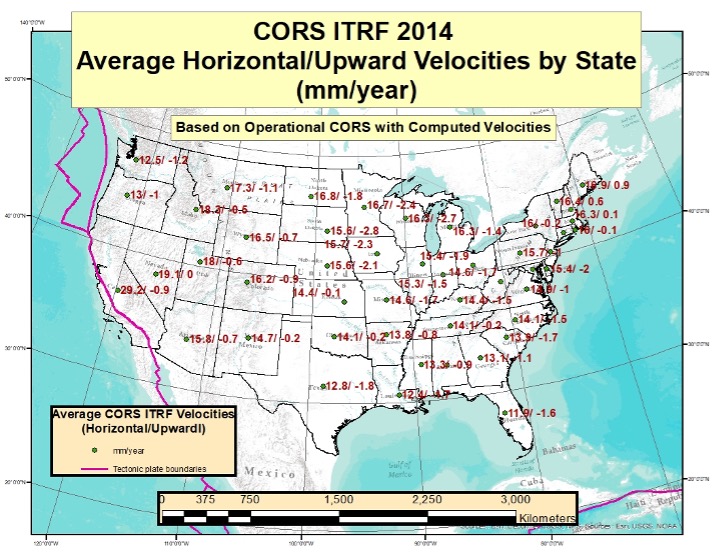
    It provided information about the NOAA CORS Network (NCN) rates of movement based on International Reference Frame of 2014 (ITRF2014) coordinates and horizontal velocity information.  It highlighted reports from the National Geodetic Survey (NGS) that describe models that will facilitate users transferring coordinates between reference frames and dealing with intra-frame movement between marks based on surveys performed at different epochs.


    NAPGD2022 orthometric heights will primarily be accessed through GNSS technology.


    As I stated in my February column, this is not just a horizontal positioning issue. In this month’s column, I address estimates of vertical movement that will have to be accounted for in the new, modernized National Spatial Reference System (NSRS).

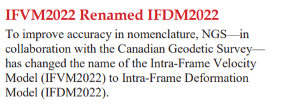
    The NGS 2021 revised Blueprint 2, NOAA Technical Report NOS NGS 64 Blueprint for the Modernized NSRS, Part 2: Geopotential Coordinates and Geopotential Datum, addresses the geopotential aspects of the new, modernized NSRS.  The modernized Geopotential Datum will be called the North American-Pacific Geopotential Datum of 2022 (NAPGD2022).  There will be four primary, interrelated time-dependent products of NAPGD2022:

    • a global model of Earth’s geopotential field (GM2022)
    • regional gridded geoid undulation models (GEOID2022)
    • regional gridded deflection of the vertical models (DEFLEC2022)
    • regional gridded surface gravity models (GRAV2022).

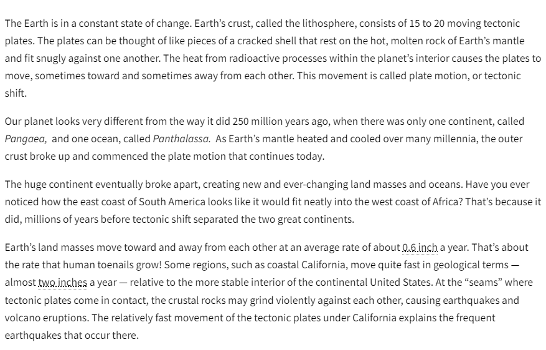
    NAPGD2022 will provide gridded models for North America (that includes CONUS, Alaska, Hawaii, the Caribbean, Canada, Mexico, Central America and Greenland), American Samoa and Guam/Commonwealth of Northern Mariana Islands (CNMI). My previous columns have described the NAPGD2022 in detail.  The revised NOS NGS 64 report mentioned that NAPGD2022 will be built upon ITRF2020.  It states that NAPGD2022 will operate equally well in any of the four new terrestrial reference frames developed as part of the new, modernized NSRS in 2022.

    As I stated in previous columns, orthometric heights in NAPGD2022 will be defined through GNSS ellipsoid heights and GEOID2022. This means NAPGD2022 orthometric heights will primarily be accessed through GNSS technology. GEOID2022 will be defined in a manner that best fits global mean sea level at the epoch of NAPGD2022.

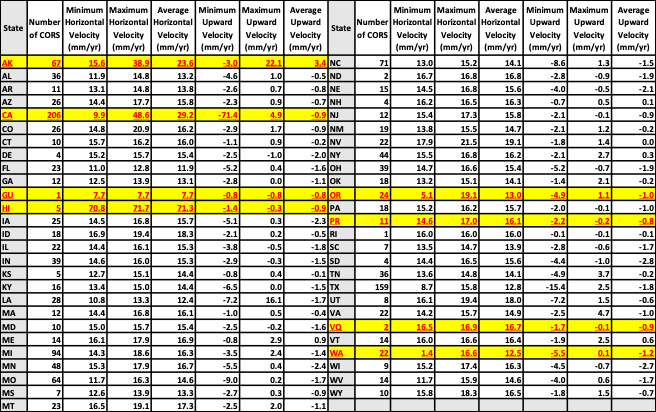
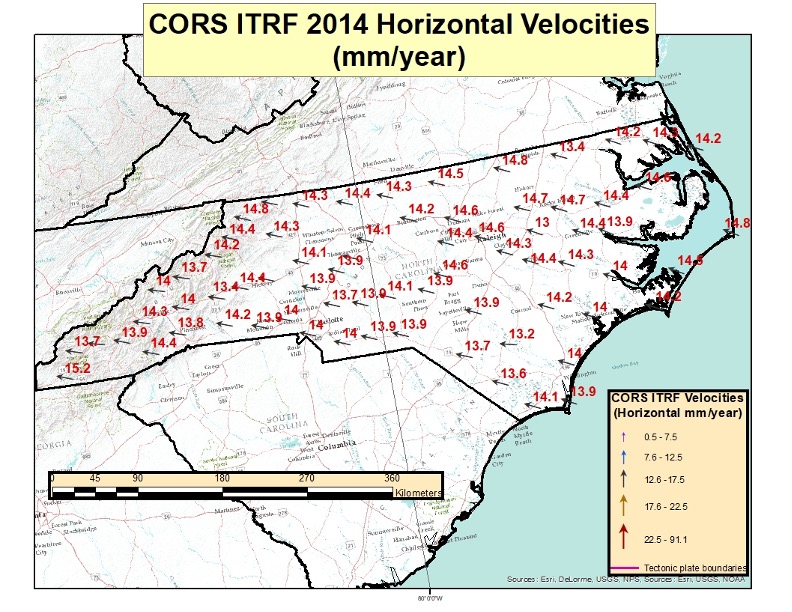
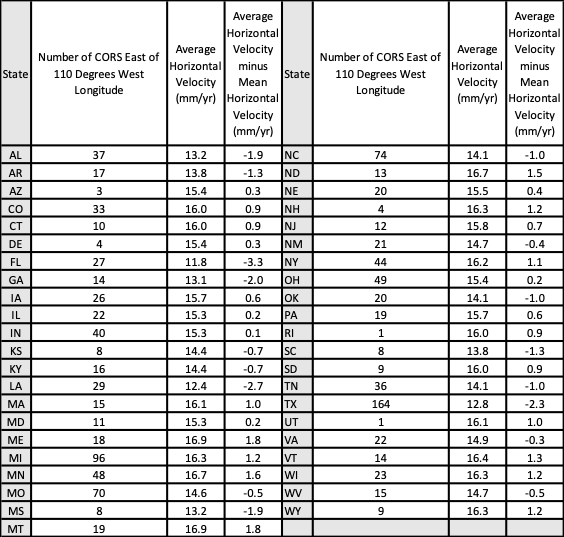
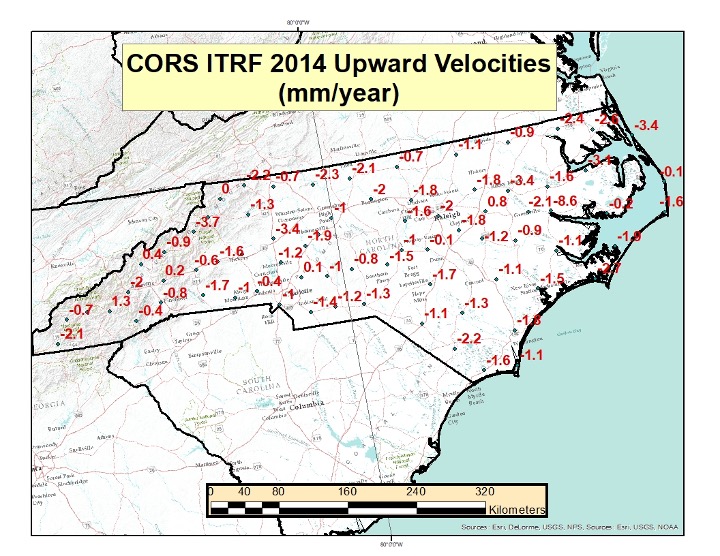
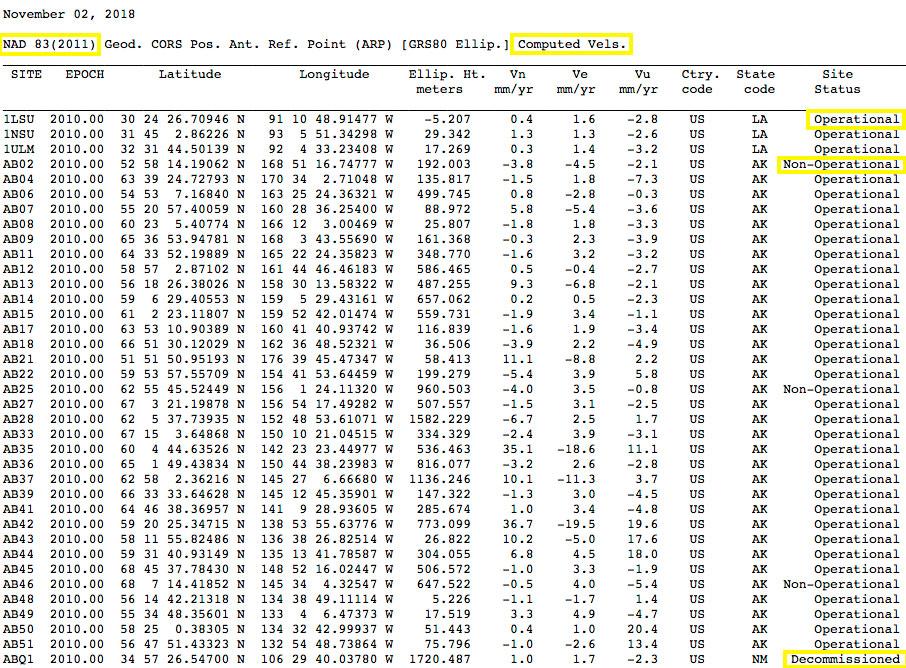
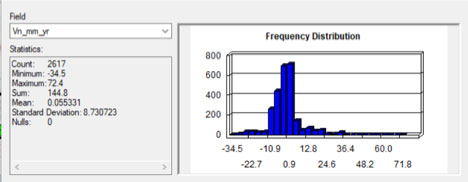
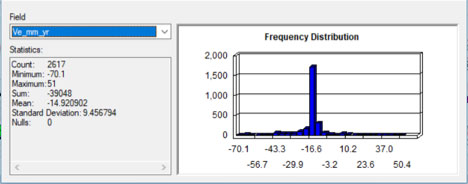
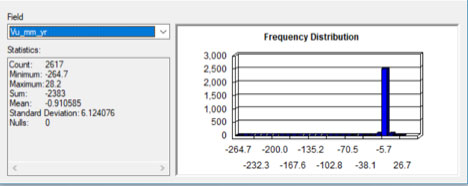
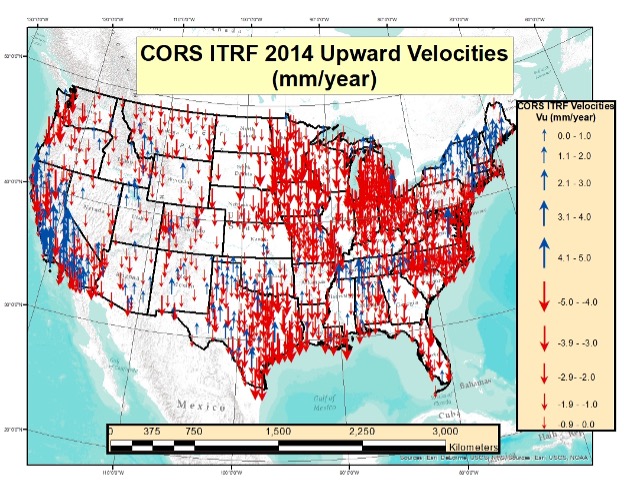
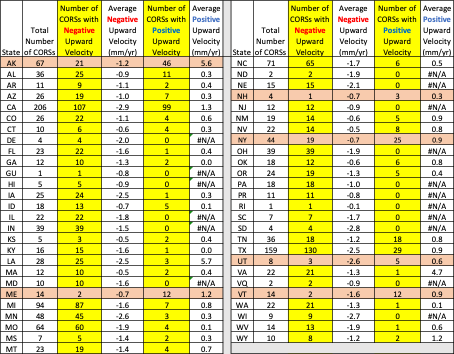
    As in my previous column, to better visualize the potential size of the vertical movement, I used the CORS ITRF2014 coordinates and velocities from the NGS website to create plots depicting the upward velocity (Vu) values for CORS that are designated as operational and have computed velocities. [Note: I use the term upward because that is how it is reported on the NGS CORS website under the tab labeled “position and velocity.”  The term upward velocity means movement in both directions — negative is downward and positive is upward.] The box below shows maximum, minimum, average and standard deviations of upward velocity values for each state and territory of the United States.

    Table of ITRF 2014 Upward Velocities of US CORSs

    Photo:

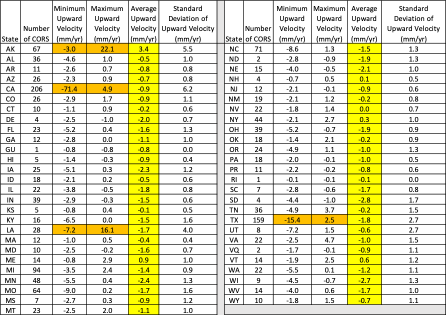
    The upward velocity values are not as systematic as the horizontal velocity values, and they are significantly smaller.  I have highlighted the average value velocity column.  As indicated in the table, the values vary from state to state, but they are all small relative to the horizontal movement values. (See my previous column for plots depicting the horizontal values.)

    What is interesting is the range of values in some states. For example, Alaska and California have a very large range — understandable because of the active earthquakes and other movement that occur in these states. Also, Louisiana and Texas have a very large range due to local subsidence.

    I decided to highlight the values for the conterminous United States (CONUS) in two separate plots.  The box “Upward Velocities (Vu) Between +/–5 mm/year in CONUS” depicts upward velocities (Vu) between +/–5 mm/year in CONUS. The box “Upward Velocities Greater than Absolute Values of 5 mm/year in CONUS” depicts upward velocity values greater than +/–5 mm/year.

    Upward Velocities (Vu) between +/- 5 mm/year in CONUS

    Image: Dave Zilkoski
    Image: Dave Zilkoski

    It’s obvious that most of the vertical movement values are between +/–5 mm/year in CONUS.  There are some large values in California, Louisiana and Texas.  This is highlighted in both plots.

    Upward Velocities (Vu) Greater than Absolute Values of 5 mm/year in CONUS

    (Image: Dave Zilkoski)
    (Image: Dave Zilkoski)

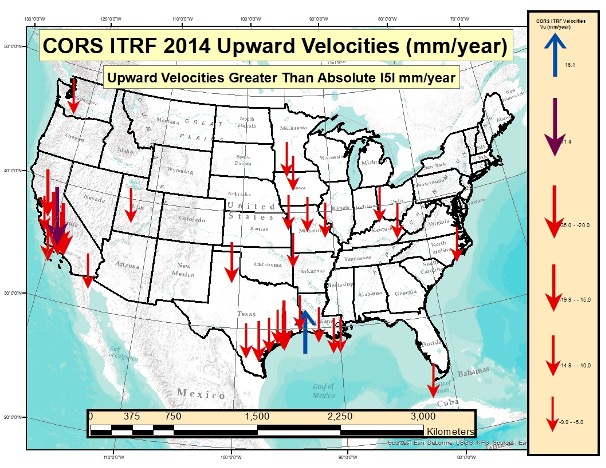
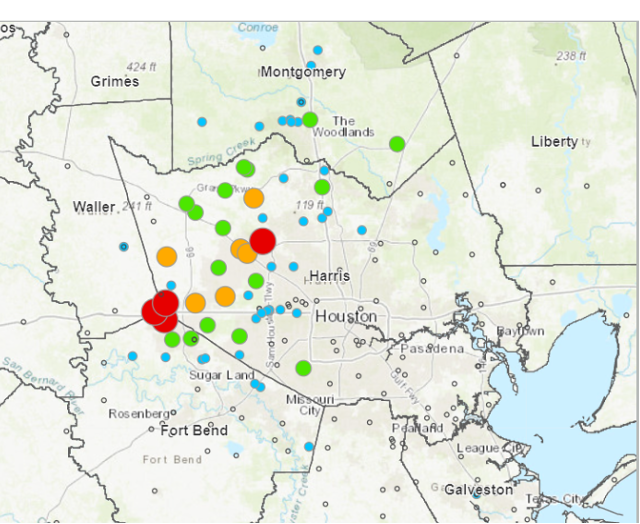
    As indicated in the plots, some of the values exceed 10 mm/year. In five years, the heights of marks in these regions could potentially change by 5 cm.  An example of the potential subsidence in the Houston-Galveston, Texas, region is depicted in the box below. As indicated in the plot, some marks are subsiding greater than 2 cm/year.  That means in five years the marks in that region could have subsided more than 10 centimeters.

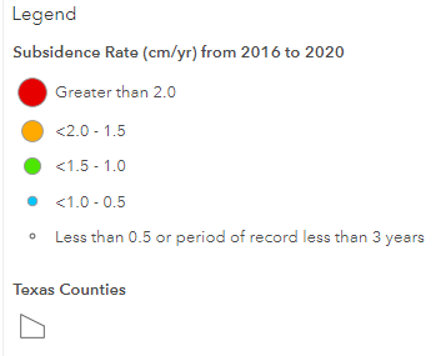
    Estimate of Subsidence in the Houston-Galveston, Texas, Region

    Photo: HGSD WebsitePhoto: HGSD Website

    Harris-Galveston Subsidence District Website

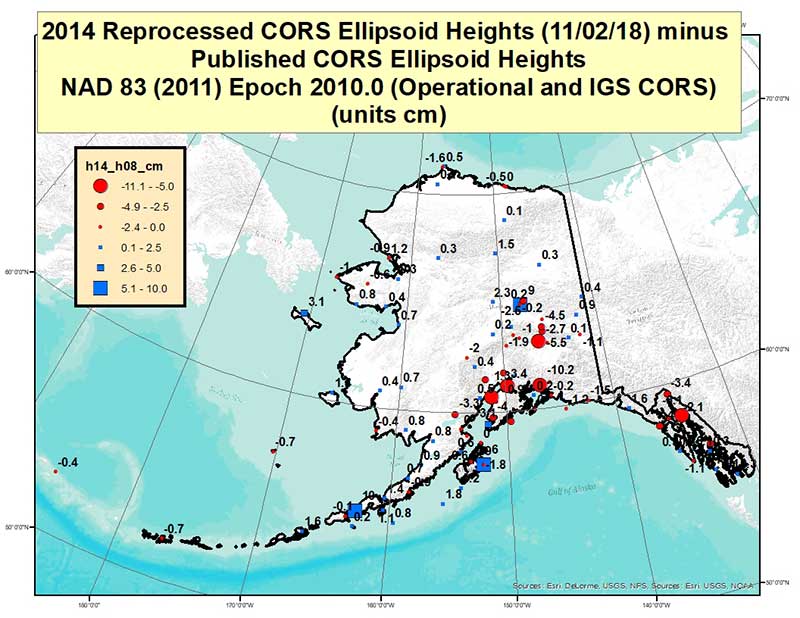
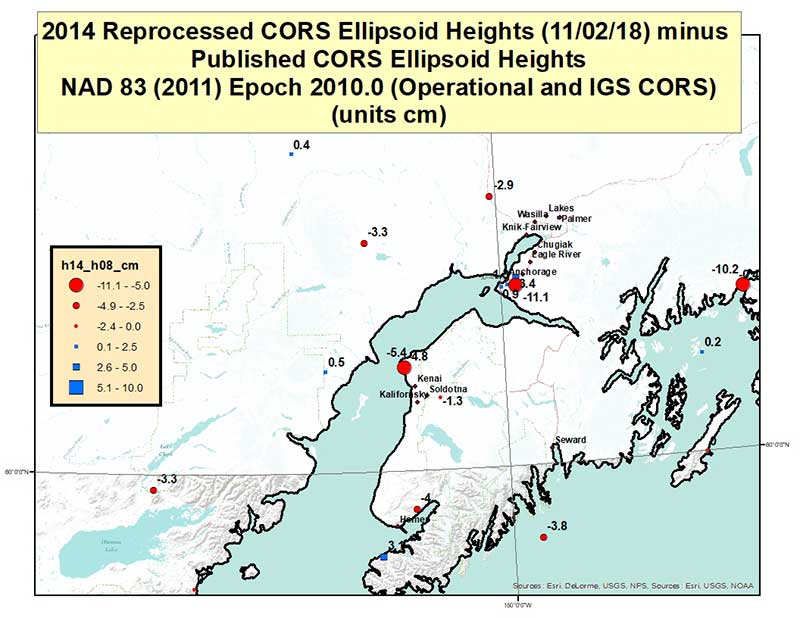
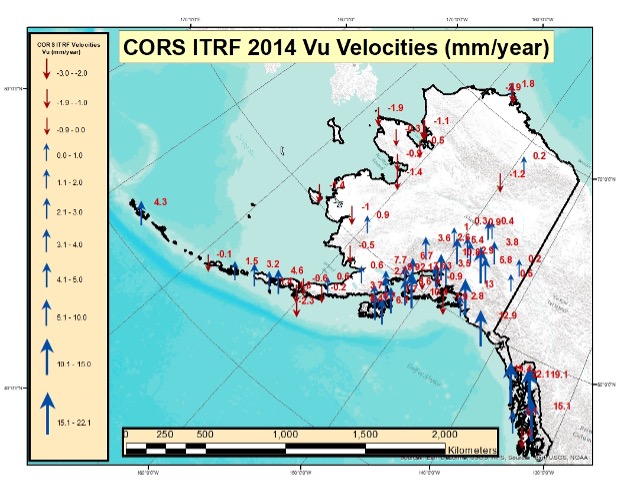
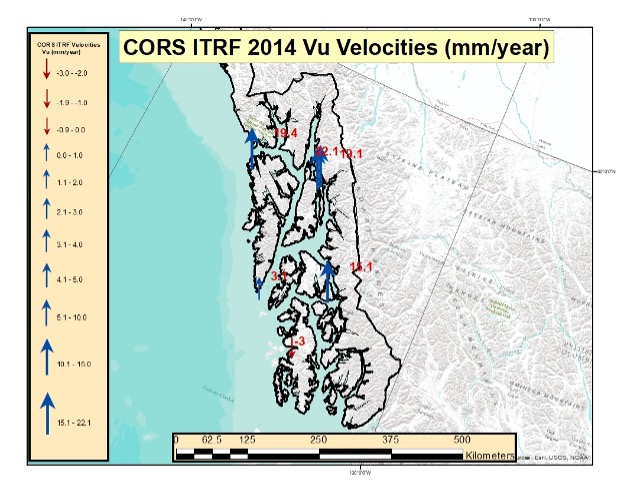
    The box below depicts the values in Alaska. Most of these values indicate that the marks are uplifting. Some of these values exceed 10 mm/year. Once again, height coordinates in some regions will potentially change 5 cm in five years. I generated a separate plot for the southeastern region of Alaska. (See the box titled “Upward Velocities (Vu) in Southeastern Alaska.”)

    Upward Velocities (Vu) in Alaska [All Values]

    (Image: Dave Zilkoski)
    Image: Dave Zilkoski


    Upward Velocities (Vu) in Southeastern Alaska [All Values]

    (Image: Dave Zilkoski)
    Image: Dave Zilkoski

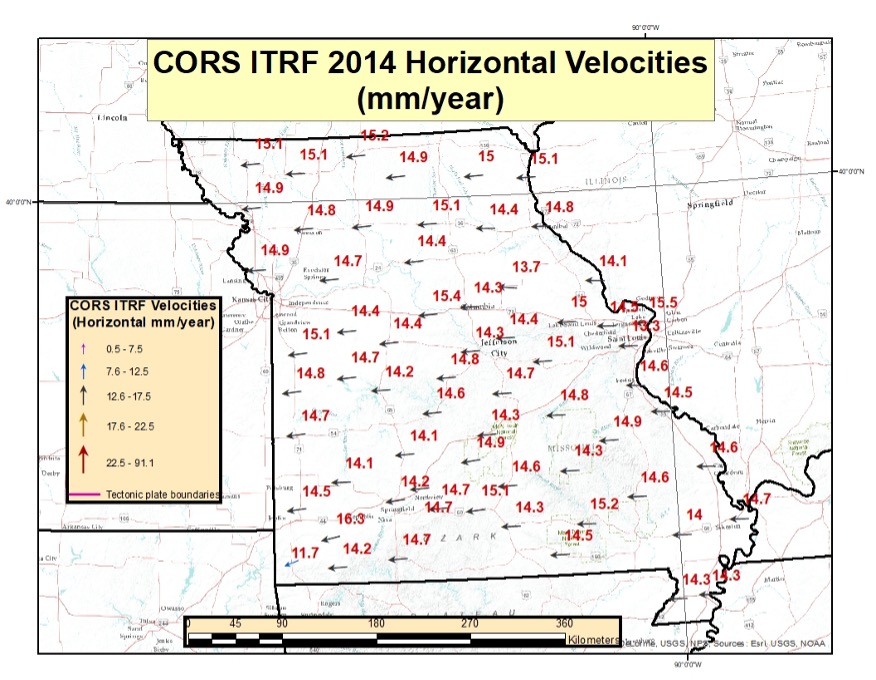
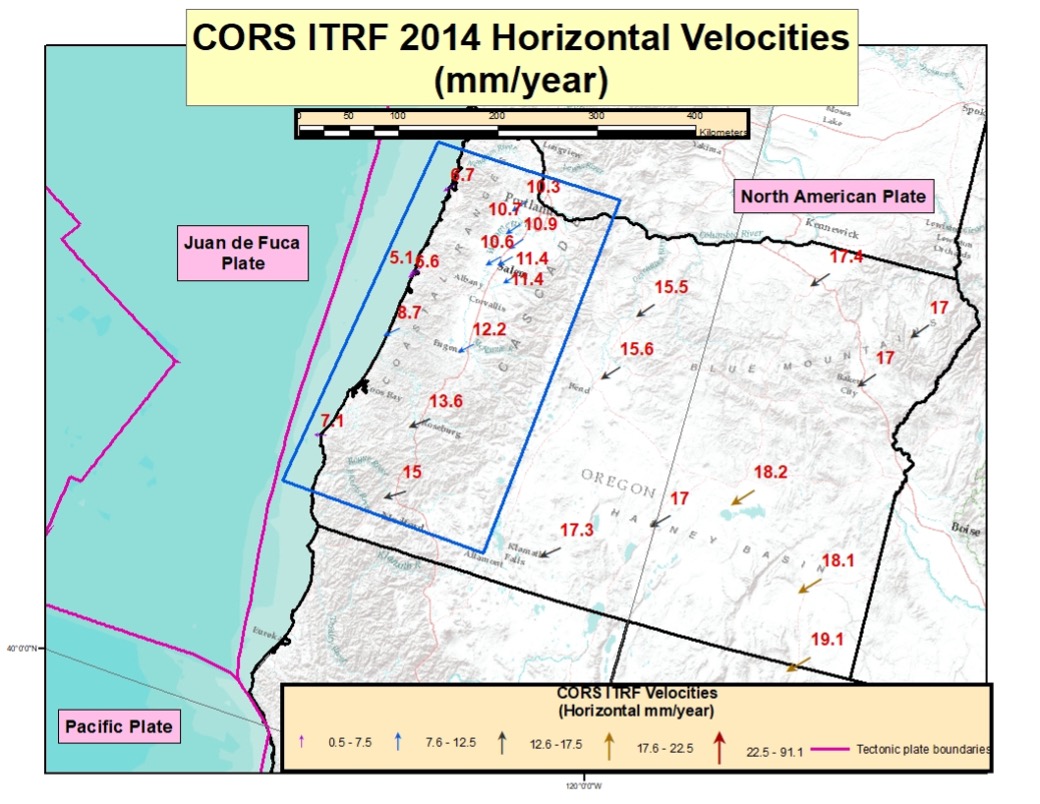
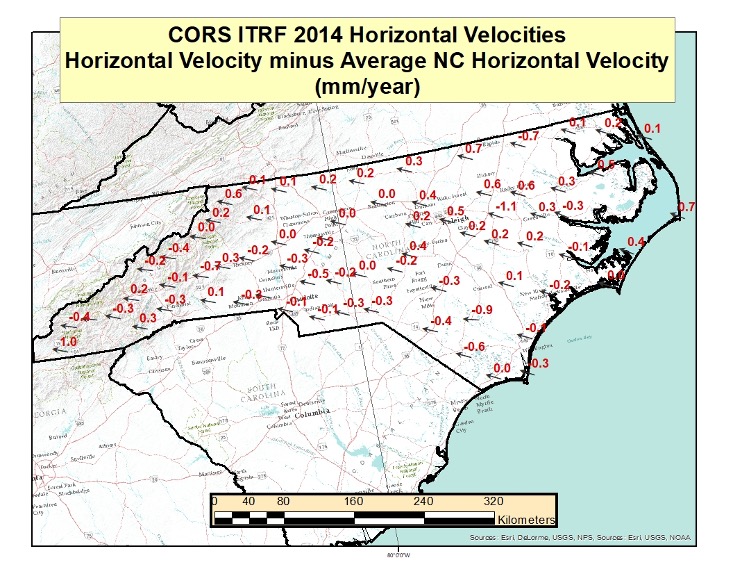
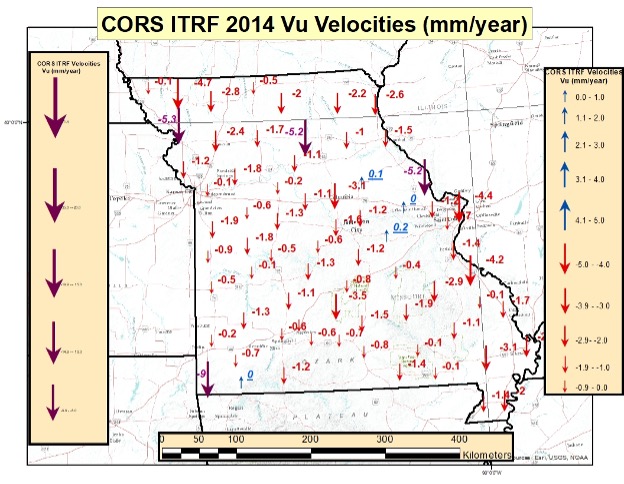
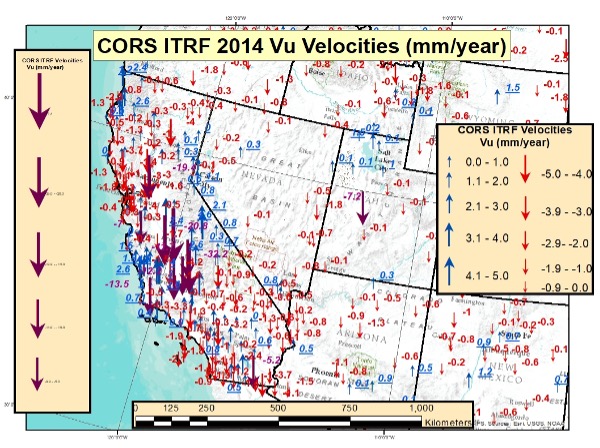
    As I did in my previous columns, I prepared several plots that depict the upward velocities in various regions of the United States. See the boxes below for North Carolina, Missouri Southwest U.S. The plots indicate that the magnitude of the vertical movement varies from state to state, as well as within the states.

    CORS ITRF 2014 Upward Velocities (Vu) in Missouri [All Values]

    (Image: Dave Zilkoski)
    Image: Dave Zilkoski


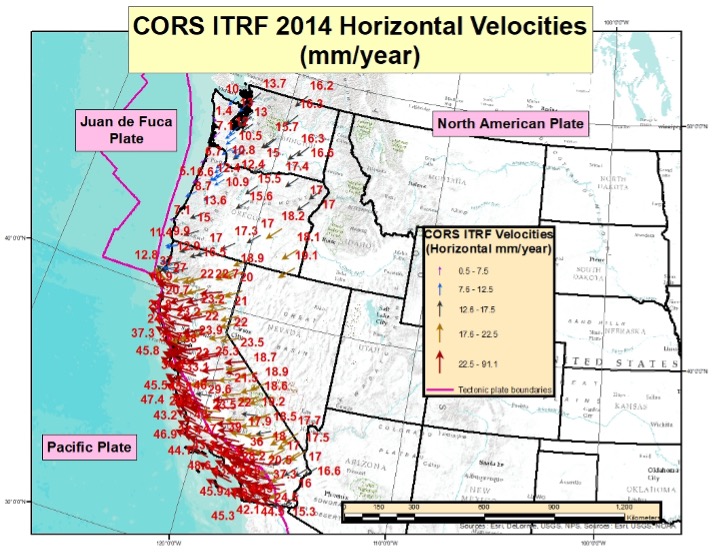
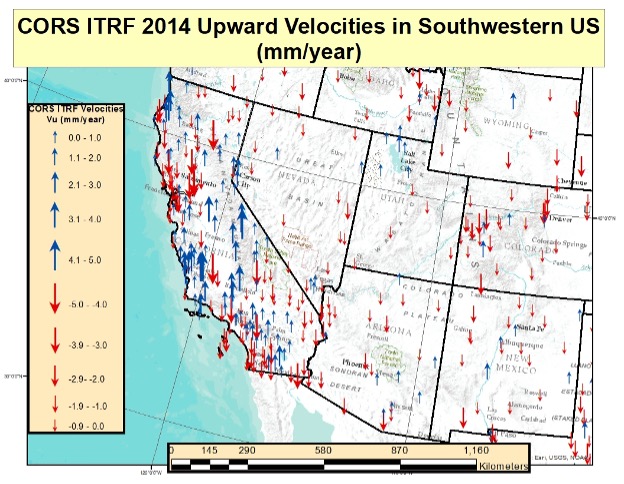
    CORS ITRF 2014 Upward Velocities (Vu) in Southwest U.S. [All Values]

    (Image: Dave Zilkoski)
    Image: Dave Zilkoski


    CORS ITRF 2014 Upward Velocities (Vu) in Southwest U.S. [Values Between +/- 5 mm/year]

    (Image: Dave Zilkoski)
    Image: Dave Zilkoski

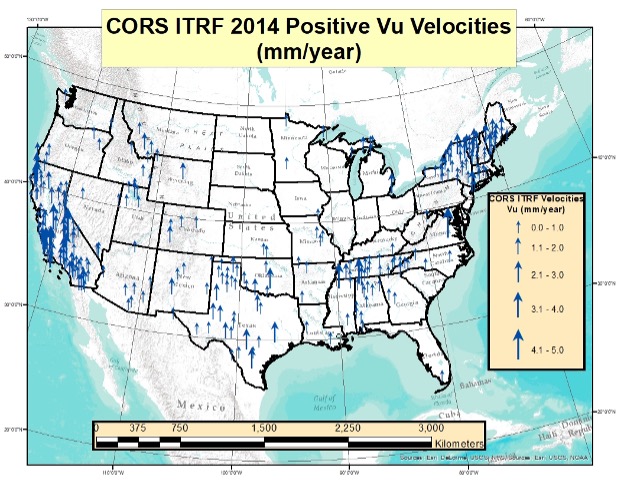
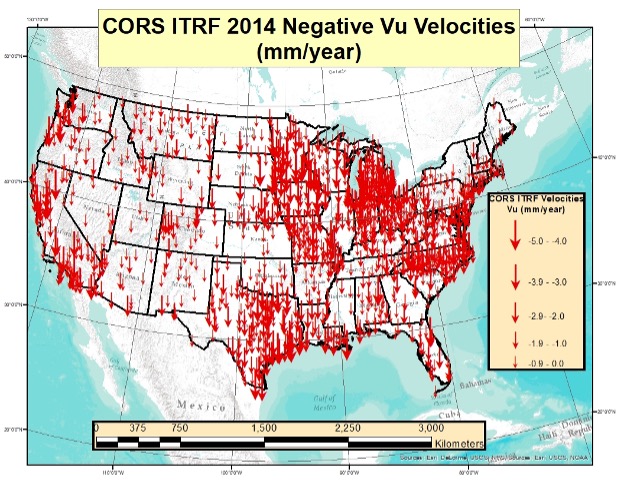
    I also generated plots that separately depict the positive and negative upward velocities for the conterminous United States. There are more negative upward velocity values than positive values.

    CORS ITRF 14 Positive Upward Velocities (Vu) in Conterminous U.S. (Values between 0 and 5 mm/year)

    (Image: Dave Zilkoski)
    Image: Dave Zilkoski


    CORS ITRF 2014 Negative Upward Velocities (Vu) in Conterminous U.S. (Values between -5 and 0 mm/year)

    (Image: Dave Zilkoski)
    Image: Dave Zilkoski

    The table below provides the number of CORS with negative upward velocity values and the number of CORS with positive values for every state and territory of the United States. I have highlighted the states and territories that have more positive values than negative values. As you can see, only six states have more positive upward velocities than negative values. Four of the six states are in Northeastern United States.

    Table of ITRF 2014 Positive and Negative Upward Velocities for United States

    (Image: Dave Zilkoski)

    So far, this column has only addressed the vertical movement at the NCN CORS.  The values at the sites indicate the potential movement of marks in the area of the CORS. The rates are based on GNSS data and have an estimate of error associated with them.

    I’m not sure how NGS will address the vertical movement effects in the new, modernized NSRS. That said, NGS will be monitoring the CORS and looking for trends to help describe the movement at the CORS. These trends will be an indication of what may be happening in the area.

    In addition to the movement of individual marks, there are geophysical reasons for changes in the geoid. As I stated in previous columns, orthometric heights in NAPGD2022 will be defined through ellipsoid heights and GEOID2022. Therefore, changes in the geoid model will be very important to users estimating orthometric heights using GNSS.

    As stated in the NGS 64 report, NGS has set a goal of maintaining geoid accuracy at 1 centimeter (1 standard deviation) in both absolute and differential geoid undulations. Figure 13 from the NGS 62 Report depicts an estimate of the secular change in the geoid. As indicated in the plot, the changes are very small, ranging from –1.25 mm/year to 1.5 mm/year.

    What I find interesting is the small negative change in the southeastern United States. There are other drivers for geoid changes. Future columns will address some of these changes and what it means to users.

    Figure 13 from NOS NGS 62 Report

    (Image From NGS Website: Blueprint 2 Revised NOAA_TR_NOS_NGS_0064.pdf)
    Image from NGS website: Blueprint 2 Revised NOAA_TR_NOS_NGS_0064.pdf

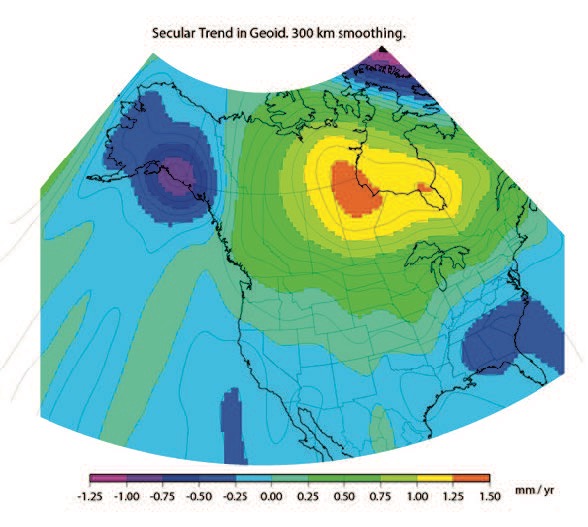
    Figure 13 – Secular Geoid Change


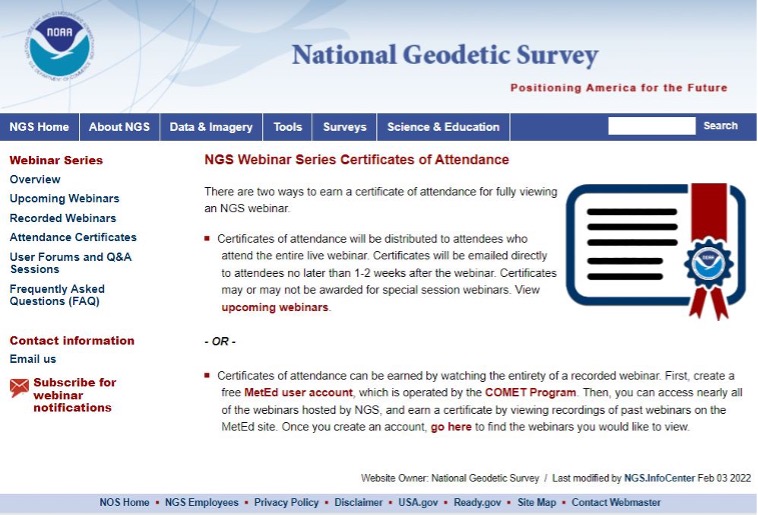
    Lastly, I’d like to highlight a new service from NGS: “NGS Webinar Series Certificates of Attendance.” See the box titled “Ways to Earn a Certificate of Attendance.” Basically, users can earn certificates by viewing a webinar after it has been posted by NGS.  This is very useful for users who could not attend the original webinar. I encourage all users to check out the site to find out more information about the new service.

    Ways to Earn a Certificate of Attendance

    (Image from NGS Website: (https://geodesy.noaa.gov/web/science_edu/webinar_series/certificates.shtml )
    Image from NGS website: https://geodesy.noaa.gov/web/science_edu/webinar_series/certificates.shtml


  • The effects of tectonic plate movement on the modernized 2022 NSRS

    The effects of tectonic plate movement on the modernized 2022 NSRS

    It’s the beginning of 2022 and the new, modernized NSRS is only about three years away. Hopefully, everyone has been reading NGS’s blueprint documents updated during 2021, and participating in NGS’s webinar series. Together, they provide the latest information about the changes from the existing NSRS to the new NSRS.

    My previous columns highlighted many aspects of the new geometric reference frame and geopotential datum. In this month’s column, I will highlight the time-dependent aspect of the modernized NSRS and why it is necessary for the new system.

    As I stated before, NOAA’s National Geodetic Survey (NGS) is developing models and tools for users to be able to transform coordinates between the four national terrestrial reference frames and the International Terrestrial Reference Frame, the Geopotential Datum and the North American Vertical Datum of 1988 (NAVD 88), as well as estimate coordinates at epochs different from the survey observation epoch by accounting for movement.

    What does NGS mean by estimate coordinates at epochs different from the survey epoch, and why is it necessary to account for movement for the new, modernized NSRS? This column will address these issues.

    NGS’s January 2022 (Issue 27) edition of NSRS Modernization News announced a paper about the modernized NSRS and a change in name to the Intra-Frame Velocity Model (IFVM). See the box below. Users can sign up for these newsletters here,  and can obtain access to previous newsletters here.

    The Latest Issue of
    NSRS Modernization News

    Image: From GovDelivery Communications Cloud on behalf of: NOAA's National Ocean Service)
    Image from GovDelivery Communications Cloud on behalf of NOAA’s National Ocean Service.

    The new paper was published in October 2021 and is titled “The Mathematical Relation between IFVM2022 as Expressed in ITRF2020 with IFVM2022 as Expressed in the Four Terrestrial Reference Frames of the Modernized NSRS with Dependence on EPP2022.” It can be downloaded here.

    The paper describes the mathematical relationship between the Intra-Frame Velocity Model (IFVM2022) and the Euler Pole Parameters (EPP2022).

    The NSRS Modernization News announcement states that the IFVM2022 name has been changed to the Intra-Frame Deformation Model (IFDM2022). The latest version of blueprint 1 and the October 2021 (NOS NGS 90) report were published before the name changes, so they refer to IFVM2022 instead of IFDM2022.

    Photo:

    Why is it necessary to account for movement? Coordinates basically change because the Earth’s surface is moving due to the movement of major tectonic plates. See the box below for information about why it is called plate movement or tectonic shift. NGS understands this and is attempting to manage the changing coordinates by providing a time-dependent component.

    Image: National Ocean Service Website
    Image: National Ocean Service website
    Screenshot: NOAA Website
    Screenshot: NOAA Website

    NGS will be defining the following four geometric terrestrial reference frames that are based on the tectonic plates (see map below):

    • North American Terrestrial Reference Frame of 2022 (NATRF2022)
    • Pacific Terrestrial Reference Frame of 2022 (PATRF2022)
    • Caribbean Terrestrial Reference Frame of 2022 (CATRF2022)
    • Mariana Terrestrial Reference Frame of 2022 (MATRF2022)

    Four Tectonic Plates Part of NGS’s New NSRS

    Image: Dave Zilkoski
    Image: Dave Zilkoski

    As previously stated, NGS is developing models and tools for users to be able to transform coordinates between the four national frames and the International Terrestrial Reference Frame, as well as estimate coordinates at epochs different from the survey observation epoch by accounting for movement. These models are denoted as EPP2022 and IFDM2022.

    So, what are EPP2022 and IFDM2022? And what does this mean to surveyors and mappers?

    EPP stands for Euler pole parameters (a way of describing a plate’s rotation) and IFDM2022 is a way of computing the drift in coordinates.

    Why Euler Pole? See the box titled “Who was Euler?”

    Who was Euler?

    Leonhard Euler was a Swiss who lived in the 1700s. He was one of the greatest mathematicians that ever lived and has been called the greatest mathematician of the 18th century. He founded the studies of graph theory and topology, and made pioneering and influential discoveries in many other branches of mathematics such as infinitesimal calculus. He introduced a lot of modern mathematical terminology and notation, including the notion of a mathematical function. He is also known for his work in mechanics, fluid dynamics, optics, astronomy and music theory.

    The definition of Euler’s fixed point theorem states that any motion of a rigid body on the surface of a sphere may be represented as a rotation about an appropriately chosen rotation pole, called a Euler pole. This theorem has been used by geologists to understand and describe the motions of tectonic plates.

    NGS’s 2021 revised Blueprint 1, NOAA Technical Report NOS NGS 62, Blueprint for the Modernized NSRS, Part 1: Geometric Coordinates and Terrestrial Reference Frames provides an explanation of Euler poles and “plate-fixed” frames. As stated in the “Who was Euler?” box, the definition of Euler’s fixed-point theorem states that any motion of a rigid body on the surface of a sphere may be represented as a rotation about an appropriately chosen rotation pole, called a Euler pole. The following is stated in the NOS NGS 62 report under “Plate-Fixed Frames and Euler Poles,” section 4:

    When considering only the rigid (not deforming) part of a tectonic plate, the horizontal motion of the plate (relative to a global plate-independent reference frame, like the ITRF) can be modeled as a rotation about a geocentric axis passing through a fixed point on Earth’s surface. Although such models must make certain assumptions (such as the rigidity of the plate), the dominant motion of the majority of points on most tectonic plates is the rotation about a fixed point. That point is known as an “Euler pole.”

    What is important to know is that the determination of a plate’s Euler pole location and the angular velocity with which the plate rotates can be empirically determined using GNSS observations from a CORS network distributed throughout the plate. Figure 1 from the NOS NGS 62 report provides a plot of the North American plate Euler pole and the vectors of the horizontal velocities at select CORS (see the box titled “Figure 1 from NOS NGS 62”).

    Figure 1 from NOS NGS 62

    Photo: NGS Website
    Photo: NGS website

    Every place on Earth is moving. That includes neighboring marks on the same tectonic plate. What this means is that after the Eulerian motions are removed, the remaining motions left over change the relative differences in coordinates of neighboring marks located on the same tectonic plate. Figures 2 and 3 from the NOS NGS 62 report provide plots of estimates of these remaining velocities (see the boxes titled “Figure 2 from NOS NGS 62” and “Figure 3 from NOS NGS 62.”)

    Figure 2 is a plot of the non-Eulerian motions east of 110° west longitudes. As stated in the report, most of the velocities are less than 2 mm/year. The concept is that the EPP2022 and IVDM2022 models will remove the Eulerian and non-Eulerian movement of the marks.

    Figure 2 from NOS NGS 62

    Image: NGS Website
    Image: NGS website

    Figure 3 is a plot of non-Eulerian vectors west of 110° west longitude. As indicated in the plot, the large vectors in Western California, Western Oregon and Western Washington show areas of deformation near plate boundaries that don’t appear to be adequately captured just from the North American plate rotation.

    Figure 3 from NOS NGS 62

    Image: NGS Website
    Image: NGS website

    It should be noted that the size of the vectors on Figures 2 and 3 depict a different magnitude of movement. Figure 2 depicts vectors at 1-3 mm/year and Figure 3 depicts movement at 10-30 mm/year.

    To better visualize the potential size of the movement, I downloaded the CORS ITRF2014 coordinates and velocities from NGS’s website and compiled the results. See the boxes titled “CORS ITRF 2014 Horizontal Velocities” and “Table of ITRF 2014 Horizontal and Upward Velocities of U.S. CORSs.”

    CORS ITRF 2014 Horizontal Velocities

    Computed Velocities Only (Downloaded Jan. 13, 2022)

    Image: Dave Zilkoski
    Image: Dave Zilkoski

    The box titled “CORS ITRF 2014 Horizontal Velocities” provides the horizontal vectors based on NGS’s file downloaded on Jan.13. Only CORSs designated as operational and computed velocities were included in the plot.

    I have also created a table that includes a summary of the ITRF rates for CORS labeled as part of the United States. The table includes the following information for each State and Territory of the United States:

    1. Number of CORS
    2. Minimum Horizontal Velocity (mm/year)
    3. Maximum Horizontal Velocity (mm/year)
    4. Average Horizontal Velocity (mm/year)
    5. Minimum Upward Velocity (mm/year
    6. Maximum Upward Velocity (mm/year),
    7. Average Upward Velocity (mm/year).

    See the table below.

    Table of ITRF 2014 Horizontal and Upward Velocities of U.S. CORSs

    Computed Velocities Only (Downloaded Jan. 13, 2022)

    Highlighted Territories are not on the North American Plate (GU, HI, PR, and VQ) and higlighted States are partly inside or close to the boundary of the North American Plate and another tectonic plate (AK, CA, OR, WA).
    Highlighted territories are not on the North American plate (GU, HI, PR, and VQ), and highlighted states are partly inside or close to the boundary of the North American plate and another tectonic plate (AK, CA, OR, WA).

    The highlighted territories in the table are not on the North American plate (GU, HI, PR and VQ), and the highlighted states are partly inside or close to the boundary of the North American plate (CA, OR, WA). This is one of the reasons why their minimum and maximum horizontal velocity values are different from most of the other states’ values.

    To visualize the relative differences in horizontal velocities between neighboring CORSs, I plotted the ITRF 2014 Horizontal Velocities for CORSs located in North Carolina (see the box titled “CORS ITRF 2014 Horizontal Velocities in North Carolina”). Looking at the figure, it’s obvious that all of the velocities are around 14 mm/year and moving in the same direction.

    CORS ITRF 2014 Horizontal Velocities in North Carolina

    Computed Velocities Only (Downloaded Jan. 13, 2022)

    Photo: Dave Zilkoski
    Screenshot: Dave Zilkoski

    I plotted the horizontal velocities for Missouri to provide an example of the velocities in the central region of the conterminous United States. The magnitude of the velocities is similar to that for North Carolina, but the direction of the vector is slightly different. North Carolina’s average horizontal velocity is 14.1 mm/year and Missouri’s average horizontal velocity is 14.6 mm/year.

    CORS ITRF 2014 Horizontal Velocities in Missouri

    Computed Velocities Only (Downloaded Jan. 13, 2022)

    Image: Dave Zilkoski
    Image: Dave Zilkoski

    To emphasize the differences along the boundaries of the tectonic plates, I’ve included a plot of the CORS ITRF 2014 horizontal velocities for the State of Oregon and a plot of the states along the West Coast of the United States. See the boxes titled “CORS ITRF 2014 Horizontal Velocities in Oregon” and “CORS ITRF 2014 Horizontal Velocities Along West Coast of CONUS.” As indicated in the plot, there are significant changes in horizontal velocities near the Oregon coast. The values decreased by about 10 mm/year from the inland CORS to the CORS along the coast.

    CORS ITRF 2014 Horizontal Velocities in Oregon

    Computed Velocities Only (Downloaded Jan. 13, 2022)

    Image: David Zilkoski
    Image: Dave Zilkoski

    The plot of the CORS ITRF 2014 Horizontal Velocities Along West Coast of CONUS clearly indicates the change in magnitude the closer the CORS are to the Pacific and Juan de Fuca plates.

    CORS ITRF 2014 Horizontal Velocities Along West Coast of CONUS

    Computed Velocities Only (Downloaded Jan. 13, 2022)

    Image: David Zilkoski
    Image: Dave Zilkoski

    For completeness, I’ve also included a plot of the horizontal velocities for Alaska.

    CORS ITRF 2014 Horizontal Velocities in Alaska

    Computed Velocities Only (Downloaded Jan. 13, 2022)

    Image: David Zilkoski
    Image: Dave Zilkoski

    To better visualize the horizontal and upward velocities of CORS among states, I plotted the average horizontal and upward velocity value for each state based on that states’ CORS. See the box titled “Average Velocities by State.”

    Average Velocities by State

    Image: David Zilkoski
    Image: Dave Zilkoski

    I also computed an average horizontal velocity value based on CONUS CORS east of 110° west longitude (denoted here as a regional horizontal velocity value). [I used the CORSs east of 110° west longitude to be consistent with NGS’s Figure 2 in NOS NGS 62.]

    The box below summarizes the average horizontal motion for each state. The table provides:

    1. The Number of CORS East of 110° West Longitude
    2. Average Horizontal Velocity (mm/year)
    3. Average Horizontal Velocity minus Regional Horizontal Velocity (mm/year).

    This provides an estimate of the variation of the relative horizontal motion between States.

    Table of ITRF 2014 Horizontal Velocities minus Regional Velocity of U.S. CORS East of 110° West Longitude

    Image: David Zilkoski
    Table only includes CORS East of 110° West Longitude (Image: Dave Zilkoski)

    The box titled “Horizontal Velocities in NC Minus Average Velocity” depicts the resulting horizontal velocities with an average velocity removed (the average velocity was based on NC CORS only) for all CORS in North Carolina. As one can see from the plot, most of the resulting horizontal velocities are less than 1 mm/year, but they are still not zero. Once again, this is only meant to provide an idea of the size of the relative vectors between CORS in North Carolina.

    As indicated in the NOS NGS 62 report, these horizontal velocities will be small, but they will not be zero. Hence the reason that NGS needs to provide models and tools for users to be able to transform coordinates between the four national frames (NATRF, PATRF, CATRF and MATRF) and the International Terrestrial Reference Frame (ITRF), as well as to estimate coordinates at epochs different from the survey observation epoch by accounting for movement within the reference frame. Surveyors in California have been dealing with these types of movements for many years now.

    Horizontal Velocities in NC Minus Average Velocity

    (Downloaded Jan. 13, 2022)

    Image: David Zilkoski
    Image: Dave Zilkoski

    I plotted the ITRF 2014 upward velocity values of the CORS in North Carolina to depict an estimate of the vertical movement of the CORS in North Carolina. See the box below. The vertical velocities values are much less than the horizontal velocities, but they still are not zero. A future column will address the upward velocities based on the ITRF 2014 rates and crustal movement models.

    CORS ITRF 2014 Upward Velocities in North Carolina

    (Downloaded Jan. 13, 2022)

    Image: Dave Zilkoski
    Image: Dave Zilkoski

    This column explained why it is important to account for movement of marks everywhere and not just in areas influenced by active crustal movement due to earthquakes such as in Southern California. It provided information about the CORS rates of movement based on NGS’s ITRF2014 coordinates and velocity information. It highlighted NGS’s reports that describe models that will facilitate users transferring coordinates between reference frames and dealing with intra-frame movement between marks based on survey performed at different epochs. This is not just a horizontal positioning issue.

    A future column will address estimates of vertical velocities in the new, modernized NSRS.

  • NGS to perform another Multi-Year CORS Solution

    NGS to perform another Multi-Year CORS Solution

    The National Geodetic Survey (NGS) is performing another Multi-Year CORS Solution (MYCS) of the National CORS. This will mean the CORS coordinates will be updated to be consistent with the latest International Terrestrial Reference Frame of 2014 (ITRF2014). NGS has provided preliminary information from the new MYCS at this website. It should be noted that these values are considered beta so they are not final. They may change before they are adopted by NGS for publication. This column will provide potential changes in ellipsoid heights based on the updated beta CORS coordinates (downloaded on January 11, 2019).

    NGS has a website that describes the CORS coordinates and how they are established. (See box titled “Excerpt from web page https://www.ngs.noaa.gov/CORS/coords.shtml.)

    Excerpt from NGS website

    Screenshot: NGS website Screenshot: NGS website

    What is a Multi-Year CORS Solution? NGS provides a short explanation on their web page (see box titled “Description of MYCS1.”)

    Description of MYCS1

    (https://geodesy.noaa.gov/CORS/coords.shtml#MYCS1)

    Multi-Year CORS (MYCS1) Solution

    To obtain the new coordinates that were just described the CORS team completed a full reanalysis of all data from CORS and from a set of global sites with the goal of simultaneously computing a fully consistent set of coordinates, GPS satellite orbits and Earth Orientation Parameters (EOP). This initial Multi-Year CORS (MYCS1) effort is the first of a series of reprocessing projects that will occur periodically in the coming years. The last time a reanalysis of CORS data occurred was in 2002 and numerous inconsistencies and changes have occurred in our processing techniques since that date. The concern over the overall quality of the solutions was not limited to NGS, but also to other geodetic groups, in particular IGS. Thus, IGS requested participation in a reanalysis of all data collected since 1994 to establish a new consistent set of GPS orbits, clocks and EOPs. This project was called IG1/repro1. NGS elected to contribute to this effort as an IGS Analysis Center and used this opportunity to simultaneously reprocess all its CORS data to provide a single consistent set of coordinates for all sites computed using the best available methods.

    For regional and site specific plots and many details about the MYCS1 please consult the FAQ. The FAQ also includes comparison between the current and previous frame coordinates.

    As noted in the explanation, MYCS1 was the first of a series of reprocessing projects that will occur periodically in the coming years. The current CORS coordinates are referenced to IGS08 epoch 2005.00 (see box titled “Description of IGS08 epoch 2005.00 Coordinates”). The updated coordinates will be consistent with the International Terrestrial Reference Frame of 2014. ITRF2014 is the latest frame realization of the International Earth Rotation and Reference Systems Service (see box titled “Description of ITRF2014”). What will be important to users is how much have the coordinates changed due to the reprocessing.

    Description of IGS08 epoch 2005.00 Coordinates

    (https://geodesy.noaa.gov/CORS/coords.shtml#IGS08)

    IGS08 epoch 2005.00 Coordinates

    Since April 17, 2011, the National Geodetic Survey (NGS) and the other Analysis Centers of the International GNSS Service (IGS) have been providing GPS satellite orbits (ephemerides) that are referred to a new terrestrial reference frame, called IGS08 and defined by the IGS. This new frame is based on GPS observations and was designed to be consistent with the International Terrestrial Reference Frame of 2008 (ITRF). ITRF2008 is the latest frame realization of the International Earth Rotation and Reference Systems Service (IERS) and is a multi space-based geodetic technique solution, combining Very Long Baseline Interferometry (VLBI), Satellite Laser Ranging (SLR), Doppler Orbitography and Radiopositioning Integrated by Satellite (DORIS) and GPS data. Although, the best fitting Helmert transformation between IGS08 and ITRF2008 for a set of well-established, international GNSS satellite tracking sites is the identity function, the transformed ITRF2008 positions have a site specific “correction” applied to them to create IGS08 positions (for additional details on IGS08 consult the following IGSMAILs 6354, 6355, 6356, 6374). Thus the IGS08 position for a particular site may differ from its corresponding ITRF2008 position; however, the velocities remain identical. By using IGS08 coordinates and the associated absolute antenna calibrations in combination with IGS orbits a consistent frame is realized. In addition, NGS has updated the IGS orbits from January 1, 1994 to April 16, 2011 in its online storage with the recently released IGS reprocessed (repro1) orbits that are all aligned consistently with IGS05. For most non-research applications, users can freely mix IGS05 and IGS08 orbits to compute coordinates for control points. Additional information is available in the following IGSMAIL 6475.

    On October 7, 2012, the IGS introduced an update to IGS08, called IGb08 (see IGSmail 6663).
    This change is transparent/invisible to most users as it focused on introducing positions for: 3 new stations at multi-technique colocations, and 33 IGS reference frame stations with IGS08 coordinates invalidated by positional discontinuities. Coordinates for stations with velocity discontinuities were not updated.

    Description of ITRF2014

    (http://itrf.ign.fr/ITRF_solutions/2014/)

    Screenshot: International Terrestrial Reference Frame

    How does this fit into what surveyors use, that is NAD 83 (2011, MA11, PA11)? NGS provides a description of CORS coordinates and NAD83 (2011, MA11, PA11) on their web page (see box titled “Description of NAD83 (2011, MA11, PA11)”). NGS provides CORS coordinates in both IGS08 epoch 2005.00 and NAD83 (2011, MA11, PA11) epoch 2010.00. See box titled “Current CORS Coordinate Listing for a CORS in Monroe, NC (NCMR)” for an example of a CORS in North Carolina. The beta website contains links to the updated CORS coordinates based on ITRF 2014 (see box titled “Updated CORS Coordinate Listing for a CORS in Monroe, NC (NCMR)” – ftp://www.ngs.noaa.gov/cors/coord/beta_coord_14/ncmr_14.betacoord.txt).

    Description of NAD83 (2011, MA11, PA11)

    (https://geodesy.noaa.gov/CORS/coords.shtml#NAD83)

    NAD83(2011,MA11,PA11) epoch 2010.00 Coordinates

    On September 6, 2011, NGS updated the National Spatial Reference System NAD 83 (CORS96, MARP00, PACP00) positions and velocities for all CORS sites, to NAD 83 (2011, MA11, PA11). The NAD 83 (2011) frame, which is relative to the fixed North American plate, is used to define the coordinates for sites located in the CONterminous United States (CONUS), Alaska and US territories in the Caribbean. The NAD 83 (MA11) frame is realized with respect to the fixed Marianas plate and is used to define coordinates in the Marianas. The NAD 83 (PA11) is a Pacific plate fixed frame and is used to define coordinates in Hawaii, American Samoa, the Marshall Islands and other US territories residing on the Pacific Plate. For informative articles about NAD 83 see Snay and Soler, 2000, Snay, 2003. The new realization of NAD 83 involves no datum change, which means that, the origin, scale and orientation of NAD 83(2011) are identical to those of NAD 83(CORS96), and the same for the two other frames. The coordinates are not the same in the old and new realizations for multiple factors including the switch to absolute antenna calibrations, new/revised processing algorithms, improved discontinuity identification, several years of additional GPS data, change in reference epoch, and an improved definition of the global reference frame, IGS08. For a description of how NAD 83 is related to the global reference frame see Craymer et al., 1999, Snay and Soler, 1999. Users working in Canada should consult Craymer, 2006 for a review of how NAD 83 is implemented in Canada. Concisely, the two biggest changes are caused by the change in reference epoch and the move from relative to absolute antenna calibrations.

    Current CORS Coordinate Listing for a CORS in Monroe, NC (NCMR)

    (ftp://www.ngs.noaa.gov/cors/coord/coord_08/ncmr_08.coord.txt)

    Data: National Geodetic Survey

    Updated CORS Coordinate Listing for a CORS in Monroe, NC (NCMR)

    (ftp://www.ngs.noaa.gov/cors/coord/beta_coord_14/ncmr_14.betacoord.txt)

    Data: National Geodetic Survey

    A March 2017 presentation by NGS employee Kevin Choi does an excellent job of explaining the CORS status and why NGS is reprocessing the CORS to be consistent with the latest ITRF. It is dated because it was presented in March 2017 but the reasons for reprocessing and recommendations are still valid today.

    Slides from NGS Presentation titled “CORS, OPUS, and Reprocessing status”

    by Kevin Choi

    (https://www.ngs.noaa.gov/CORS/Presentations/NSPS_MAPPS/CORS-OPUS-Repro2-version1.pdf)

    Slide: National Geodetic Survey presentation by Kevin Choi

    Slide: National Geodetic Survey presentation by Kevin Choi

    Slide: National Geodetic Survey presentation by Kevin Choi

    Slide: National Geodetic Survey presentation by Kevin Choi

    The text box titled “Slides from NGS Presentation, titled ‘CORS, OPUS, and Reprocessing status by Kevin Choi,’” contains four slides from Kevin Choi’s presentation that explains why NGS periodically performs a multi-year reprocessing of the National CORS. As stated in the slides: (1) some CORS coordinates are outside their allowable 2/4 cm (H/V) threshold, (2) some stations that had modeled velocities will now have computed velocities, (3) there are new CORS stations since the last reprocessing, and (4) there is an updated ITRF (ITRF2014 and a corresponding IGS14). What’s really important to the user of CORS is, how much have the coordinated changed and what does it mean to me. This column will focus on changes in ellipsoid heights. I downloaded the CORS coordinate information for both the updated ITRF2014 values (ftp://www.ngs.noaa.gov/cors/coord/beta_coord_14/nad83_2011_geo.comp.txt and ftp://www.ngs.noaa.gov/cors/coord/beta_coord_14/nad83_2011_geo.htdp.txt) and the current IGS08 values (ftp://www.ngs.noaa.gov/cors/coord/coord_08/nad83_2011_geo.comp.txt and ftp://www.ngs.noaa.gov/cors/coord/coord_08/nad83_2011_geo.htdp.txt) from NGS’ website. See box titled “Excerpt from ftp://www.ngs.noaa.gov/cors/coord/beta_coord_14/nad83_2011_geo.comp.txt” for a sample of the contents of the file of the stations with computed velocities and the box titled “Excerpt from ftp://www.ngs.noaa.gov/cors/coord/beta_coord_14/nad83_2011_geo.htdp.txt” for a sample of the contents of the file of the stations with modeled velocities. As previously stated, the ITRF2014 coordinates are “Beta” and can change before being officially published. I generated several plots that depict the difference between the two sets of ellipsoid heights referenced to NAD83 (2011).

    Excerpt from ftp://www.ngs.noaa.gov/cors/coord/beta_coord_14/nad83_2011_geo.comp.txt

    Data: National Geodetic Survey Data: National Geodetic Survey

    Excerpt from ftp://www.ngs.noaa.gov/cors/coord/beta_coord_14/nad83_2011_geo.htdp.txt

    Data: National Geodetic Survey

    The column labeled “Site Status” indicates whether the site is (1) Decommissioned, (2) IGS station and not a National CORS, (3) Non-Operational, and (4) Operational. A summary of the status of the Stations is listed in the text box titled “A Summary of ITFR2014 CORS Stations.”

    A Summary of ITFR2014 Station

    Image: International Terrestrial Reference Frame

    The file also provides the velocity of the station (modeled or computed) in the north (Vn – units mm/yr), east (Ve – units mm/yr), and up (Vu – units mm/yr) component. The box titled “A Summary of the Velocity Values of ITRF2014 Stations” provides a statistically summary of the velocity components of the stations.

    A Summary of the Velocity Values of ITRF2014 Stations

    Image: International Terrestrial Reference Frame

    Image: International Terrestrial Reference Frame

    Image: International Terrestrial Reference Frame

    The text box titled, “Differences between 2014 Reprocessed CORS Ellipsoid Heights and Published CORS” depicts the differences in NAD83 (2011) ellipsoid heights between all common CORS between the two set of values in conterminous United States. There appears to be several CORS that have very large changes in ellipsoid heights.

    Differences between 2014 Reprocessed CORS Ellipsoid Heights and Published CORS

    Sources: Esri, DeLorme, USGS, NPS, NOAA

    The box titled “Differences between 2014 Reprocessed CORS Ellipsoid Heights
    and Published CORS – Less Than +/- 1 cm” depicts the differences that are between -1 cm and 1 cm.

    Differences between 2014 Reprocessed CORS Ellipsoid Heights and Published CORS – Less Than +/- 1 cm

    Sources: Esri, DeLorme, USGS, NPS, NOAA

    The box titled “Differences between 2014 Reprocessed CORS Ellipsoid Heights and Published CORS – Greater Than +/- 1 cm” depicts the differences that are less than – 1cm or greater than 1 cm. As the plots indicate, most of the differences are between +/- 1 cm.

    Differences between 2014 Reprocessed CORS Ellipsoid Heights and Published CORS – Greater Than +/- 1 cm

    Sources: Esri, DeLorme, USGS, NPS, NOAA

    The box titled “Differences between 2014 Reprocessed CORS Ellipsoid Heights and Published CORS – Greater Than +/- 2 cm” depict the differences that are greater than absolute 2 cm (that is, less than – 2 cm and greater than 2 cm). The plot clearly indicates that most of the station coordinates will change less than +/- 2cm.

    Differences between 2014 Reprocessed CORS Ellipsoid Heights and Published CORS – Greater Than +/- 2 cm

    Sources: Esri, DeLorme, USGS, NPS, NOAA

    The text box titled “Differences between 2014 Reprocessed CORS Ellipsoid Heights and Published CORS in North Carolina” depicts the differences in NAD83 (2011) ellipsoid heights between all common CORS between the two set of values in North Carolina. Most of the differences are less than a centimeter.

    Differences between 2014 Reprocessed CORS Ellipsoid Heights and Published CORS in North Carolina

    Sources: Esri, DeLorme, USGS, NPS, NOAA

    The box text titled “Differences between 2014 Reprocessed CORS Ellipsoid Heights and Published CORS in North Carolina – Greater Than +/- 5 mm” depict the differences greater than absolute 5 mm. The plot clearly shows that the coordinates of most stations in North Carolina will change less than 5 mm.

    Differences between 2014 Reprocessed CORS Ellipsoid Heights and Published CORS in North Carolina – Greater Than +/- 5 mm

    Sources: Esri, DeLorme, USGS, NPS, NOAA

    The box titled “Differences between 2014 Reprocessed CORS Ellipsoid Heights and Published CORS in Alaska” depict the differences in Alaska. Most of these differences are less than a couple of cm but there are a few large differences.

    Differences between 2014 Reprocessed CORS Ellipsoid Heights and Published CORS in Alaska

    Sources: Esri, DeLorme, USGS, NPS, NOAA

    The box titled “Differences between 2014 Reprocessed CORS Ellipsoid Heights and Published CORS in Anchorage, Alaska, Region” depict the differences in the Anchorage, Alaska, region. There are a couple of stations in the Anchorage region that their ellipsoid heights will change over 10 cm.


    Differences between 2014 Reprocessed CORS Ellipsoid Heights and Published CORS in Anchorage, Alaska, Region

    Sources: Esri, DeLorme, USGS, NPS, NOAA Sources: Esri, DeLorme, USGS, NPS, NOAA

    This column discussed the preliminary results of NGS’ second Multi-Year CORS Beta Solution of the National CORS. The CORS coordinates will be updated to be consistent with the latest International Terrestrial Reference Frame of 2014 (ITRF2014). NGS has provided preliminary information from the new MYCS at the following website: ftp://www.ngs.noaa.gov/cors/coord/beta_coord_14. It was noted that these values are considered “Beta” so they are not final. It was emphasized that they may change before they are adopted by NGS for publication. This column provided potential changes in ellipsoid heights based on the updated beta CORS coordinates (downloaded on January 11, 2019). Future column will provide more details after NGS completes their analysis and adopts the final coordinates for the MYCS.