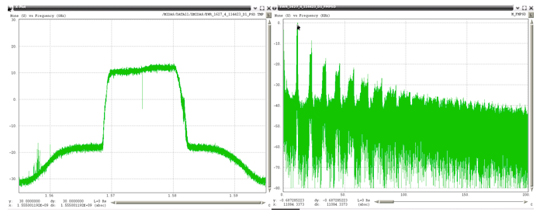
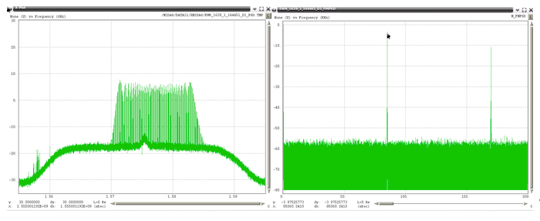
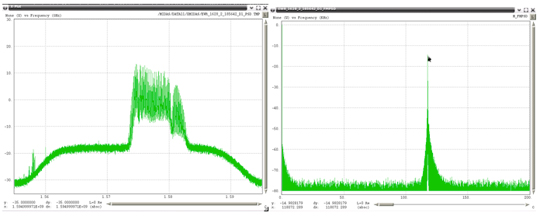
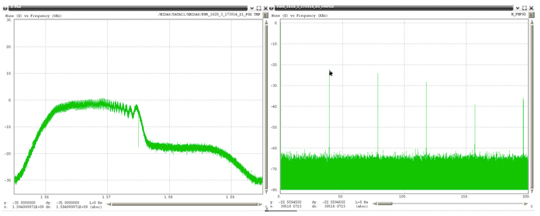
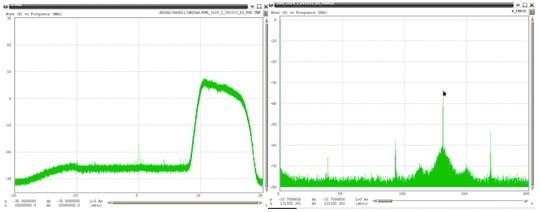
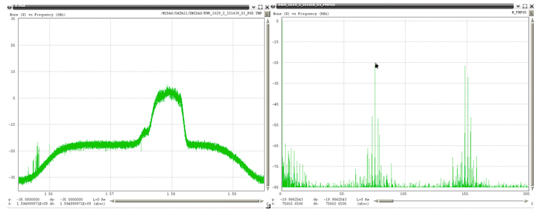
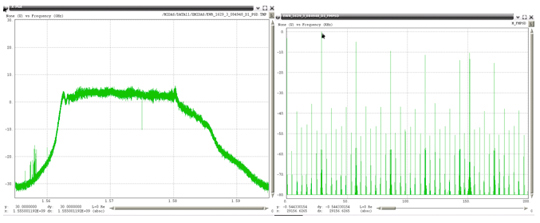
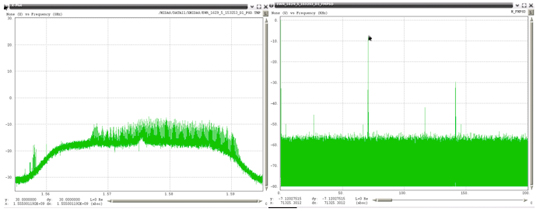
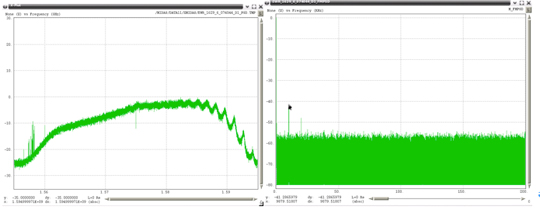
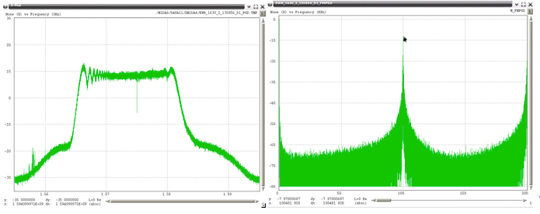
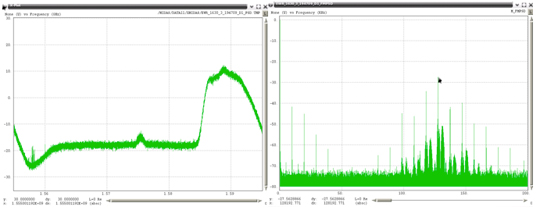
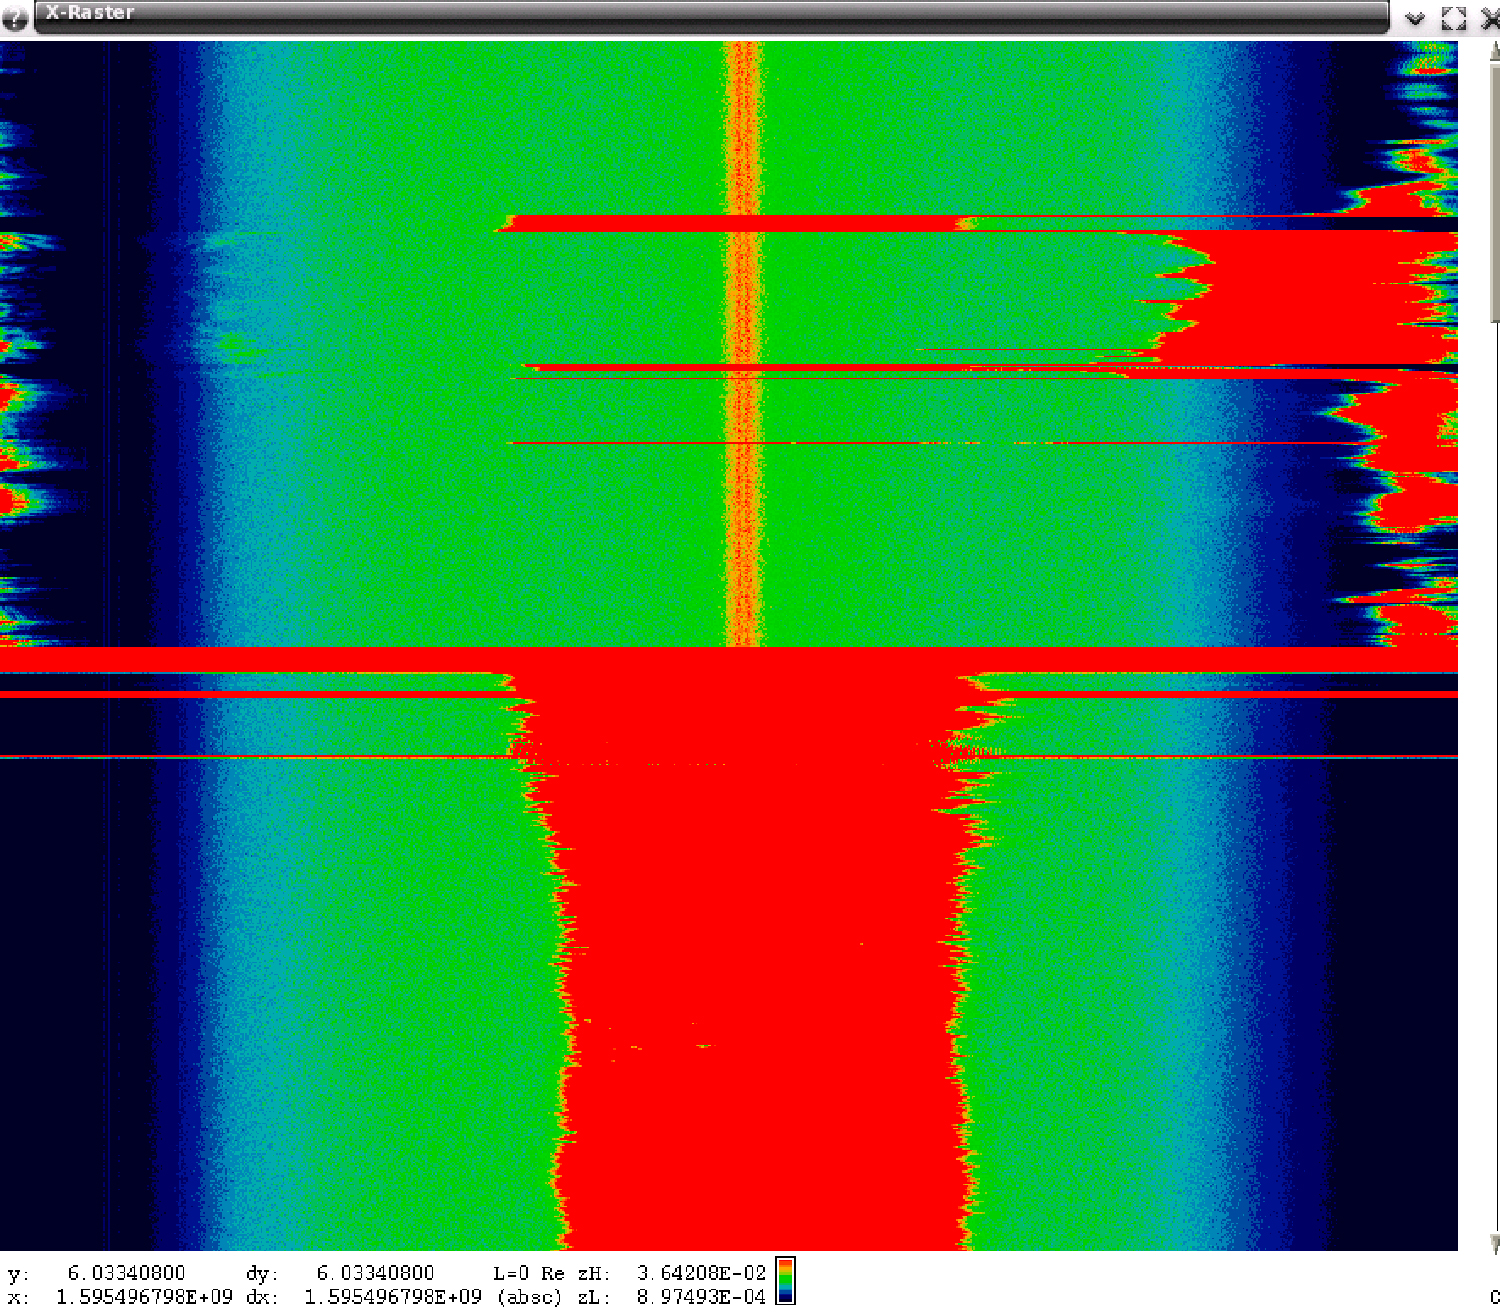
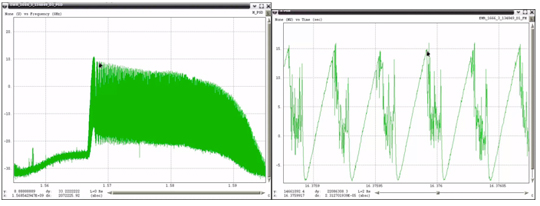
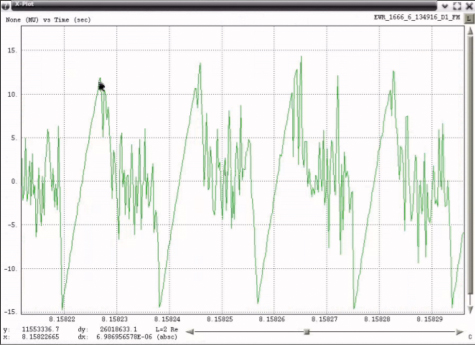
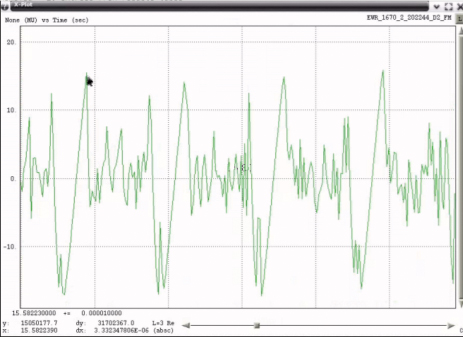
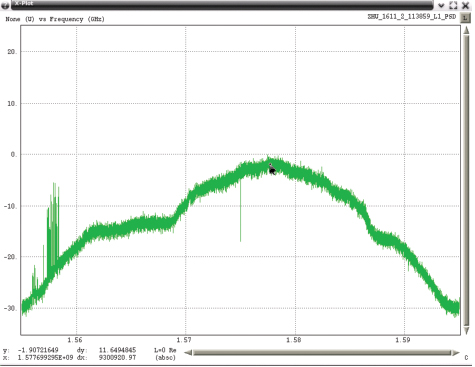
Drones planned for a New Year’s light show in Budva, Montenegro, were deliberately shot down, according to an analysis that Croatian company Mirnovec provided news outlet Vijesti.
Mirnovec’s owner told Vijesti the culprit used an anti-drone jammer, a gun of the type used by security forces.
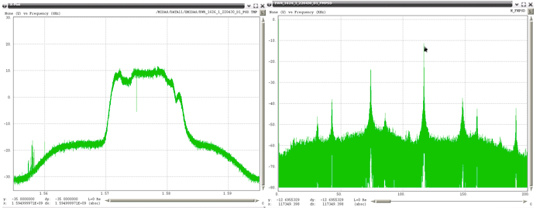
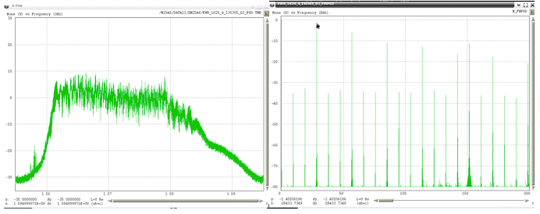
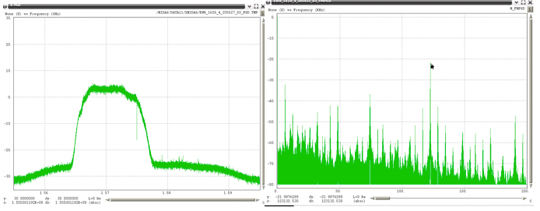
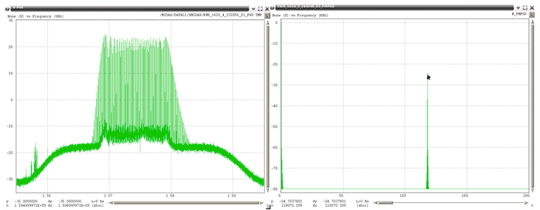
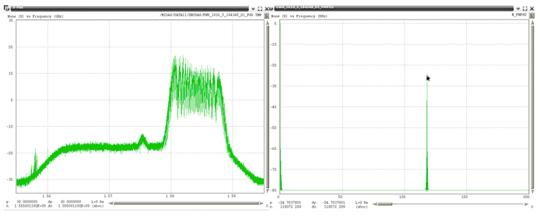
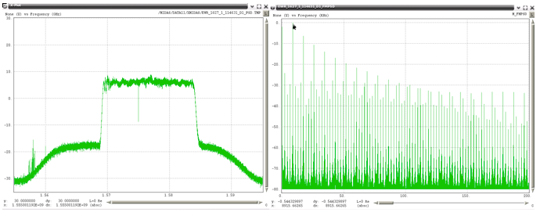
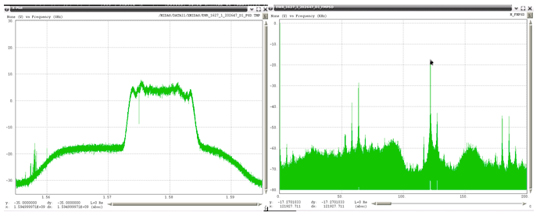
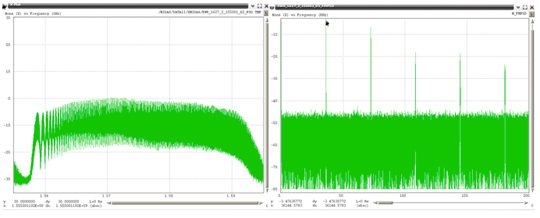
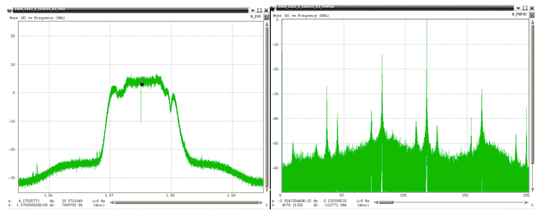
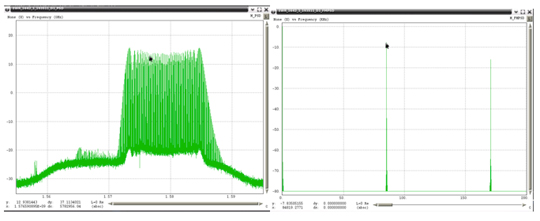
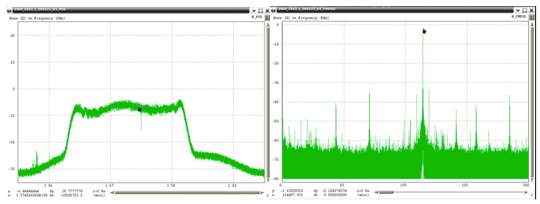
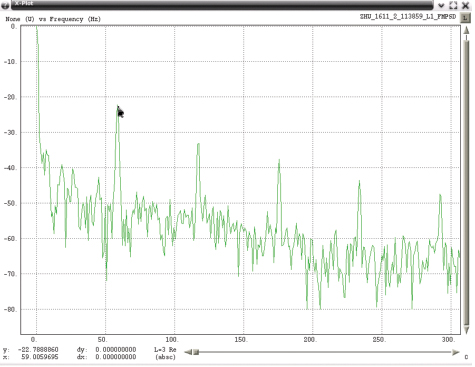
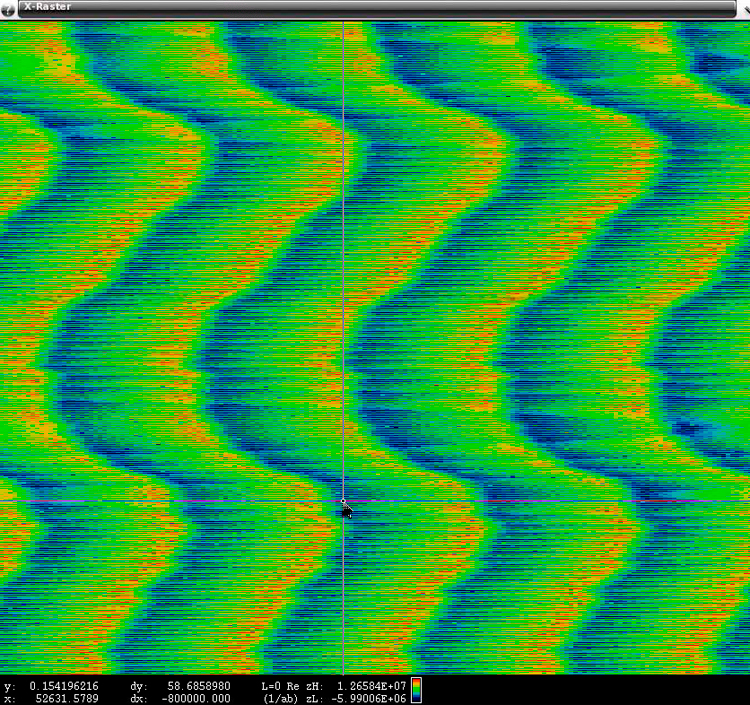
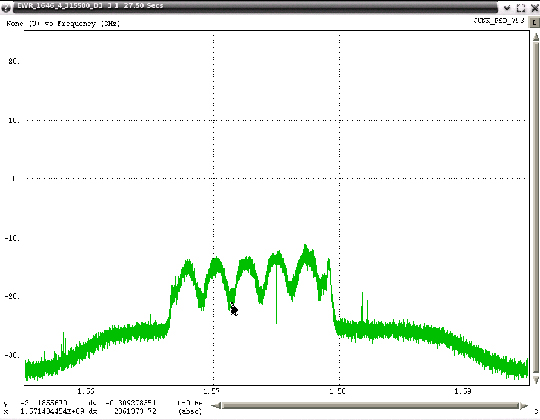
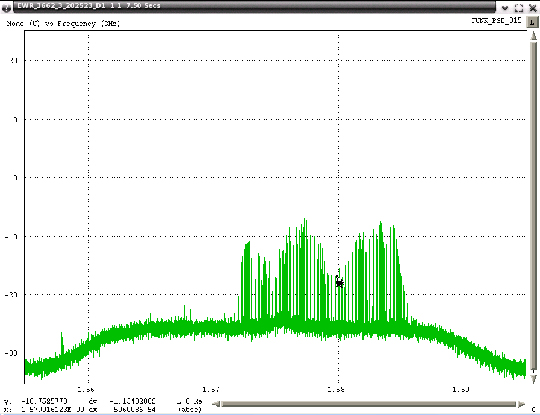
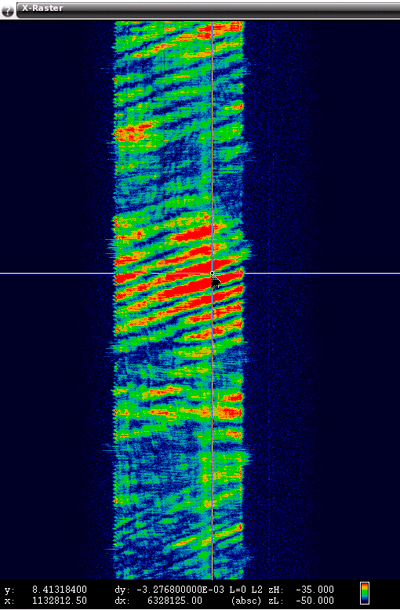
The document “GNSS RF interference analysis: Incident during a drone show,” summarizes technical findings related to a loss of GNSS navigation during the show. About 15 seconds after the launch of 600 drones from the parking lot in front of the Port Authority began, they began to return. Some drones fell into the sea and some collided with drones taking off. After 40 seconds, the operator stopped the launch. The drones fell for another 20 seconds.
Skydel Solutions has released SDX Release 17.8, which offers a host of improvements, according to the company. The 17.8 release offers an advanced jamming feature, as well as improvements for Gaussian noise, spectrum view and the graphical user interface (GUI).
The new advanced jamming option provides unique interference testing capabilities for SDX users. It leverages the power of the GPU/SDR combo to create a new way to simulate interferences, enabling transmitter trajectories and user-defined waveform creation.
Skydel Solutions will be exhibiting at ION GNSS+ in Portland, Oregon, in booth #100. Attendees can learn about the new system and watch a demonstration of SDX’s latest features. Also, Skydel’s Iurie Ilie will host a technical session about spoofing on Friday, Sept. 29, at the conference.
With SDX’s Advanced Jamming package, users can:
Create user-defined waveforms. Chirp, CW, BOC, AWGN, BPSK and pulse interference modulation are supported and can be combined at will to create custom, complex interference waveforms.
Create multiple real-time jammers. Users can create a single or multiple jammer transmitters with user-defined waveforms. Up to 100 interferences can be generated in real time.
Add dynamics to transmitters. Users can create more realistic jammers for simulations; SDX’s dynamic jammers can change position relative to the receiver as the simulation progresses. Their power levels are defined from the transmitter’s point of view. During the simulation, SDX automatically calculates the resulting signal at the receiver antenna in real-time and takes into account the transmitter antenna pattern, the propagation loss and the receiver antenna pattern. The transmitter, like the simulated receiver, has six degrees of freedom. Furthermore, the trajectory may even be defined in real-time using the hardware-in-the-loop API.
Actions Necessary to Reduce Vulnerability and Ensure Availability
By Brad Parkinson
(From the 25th Anniversary GNSS History Special Supplement)
Introduction
Brad Parkinson
About 40 years ago, we had a vision for positioning, navigation, and timing (PNT). That vision was more than successful, and became known as GPS. In some respects we have been almost too successful: PNT is frequently taken for granted. PNT, in the form of GPS, has become a powerful worldwide enabler for productivity and for safety. Estimated yearly value runs to many tens of billions of dollars.
For several years, I have been concerned about comments that denigrate GPS because the signal strength is relatively weak. The speakers have gone on to say it can be completely replaced with inertial or other techniques. Recently, comments by government officials further energized me to look at the full picture.
What can we do to reduce the vulnerability and ensure that the expectations of the users are going to be met? I summarize my solution as the PTA program and will elaborate in this article. At a top level, the term PTA means: Protect, Toughen, and Augment GPS to assure PNT. Note I say PNT, not GPS. The central issue is assuring access of PNT to the user, not the source of the information. I strongly believe that PTA is both achievable and absolutely necessary. Protecting PNT is particularly important to Europeans as they are just about to launch their fledgling Galileo system.
Speeches and travel only reach a limited number. When GPS World invited me to write a piece for the magazine’s 25th anniversary issue, it seemed an ideal opportunity to expand knowledge of the PTA program. The following is an edited form of a talk I have given a number of times, most recently at the European Navigation Conference in Rotterdam in April 2014.
GNSS initiatives and the GNSS community are growing rapidly, and certainly we are very enthusiastic about the progress of Galileo. But some places in the U.S. community are saying, “Well, this GPS band is underutilized; devoting all that bandwidth to a single system is not prudent.”
I beg to differ with that view. If you look at the separate signals in the L1 band around the world, by the year 2023 they will grow to be well more than 400 individual signals. Those signals service over 2 billion users, from emergency service providers to precision agriculture to crustal monitoring and many, many more. I have an entirely separate talk on “GPS for Humanity,” but that is not our subject today.
Calling the GPS frequency band “underutilized” simply points out ignorance, even among our supporters. For example, we say PNT to emphasize that GNSS provides four dimensions. Certainly, timing is the forgotten fourth dimension of GPS, and even our politician friends rarely understand the importance of this aspect. Yet we know that highly accurate timing, supplied by GPS, is absolutely critical for power distribution, for telecommunications, and for the financial sector.
It is instructive to summarize the penetration of the PNT “Stealth Utility” into the fabric of our society.
Market Size. Overall, GPS has more than 2 billion users worldwide. This represents a very diverse user group; we providers are continually seeing new and innovative ways to use GPS.
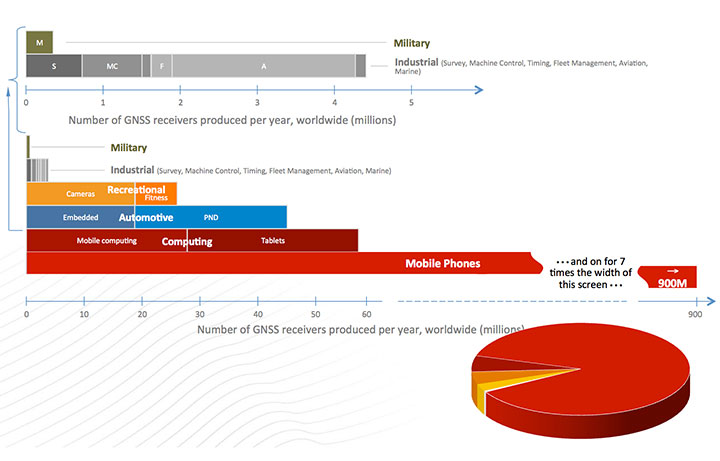
Figure 1, for which I am indebted to Frank van Diggelen, gives an estimate of the number of receivers currently fielded. Notice the number of military receivers: less than half a million. The gray bar depicts the industrial uses such as survey and machine control, which come in at about 4.5 million; these tend to be extremely high enhancers of industrial productivity.
Figure 1. GNSS market size, 2012.
We have to change the chart scale to depict bigger market segments. For example, recreation, automotive, and computing are shown on the lower half of the chart. In fact, mobile phones will still not fit on the chart. Attesting to the size of the estimated mobile phone base: one company alone will produce more than 900 million GPS-equipped smartphones this year. The pie diagram shows the dominance of mobile devices, but much higher productivity gains come from high-precision devices whose impact is very disproportionate to numbers of receivers.
We asked some economists, just what is all this worth? They looked at a subset of all the industries and concluded that GPS has a positive net effect to the tune of at least $32 billion annually. They had an expanded study that suggested about $90 billion annually. So, for those who question the value of GPS, the answer is that the net yearly returns to our national investment are more than 1000 percent. (Note: National investment is about $3 billion annually.)
To ensure these enormous economic benefits of PNT, there are two fundamental needs, and we providers must assure that they are met. The first and most important need is availability.
Availability. When we say availability, it is defined in a certain way; it means that PNT is available at the application-specified accuracy. We usually measure that accuracy at the 90th percentile: only 10 percent of the time can that error be exceeded.
Integrity. The second user need is the required integrity. That means that when the user expects a specific accuracy, the system is not lying to him. Integrity assurance is very much a focus of both the International Civil Aviation Organization (ICAO) and, in the United States, the Federal Aviation Administration (FAA). In many cases they require that PNT errors not exceed specified bounds more than once in 10 billion measurements (1 x 10⁻⁷). This integrity level requires so many samples, it is virtually impossible to verify experimentally; we have not had that many airplane landings, but it can be calculated. The metric we use is how many minutes GPS is not available — unavailability — at the specified accuracy and integrity. That is more easily understood than availability that aproaches 99.9XXX percent. The usual goal is that unavailability be zero.
We have an independent assessment of how well we are doing: FAA’s Wide Area Augmentation System (WAAS). They put out a report card with a lot of numbers. GPS clearly deserves a grade of A+.
And it will get better. The U.S. government’s PNT Advisory Board, which I co-chair, recently advocated that the full navigation message be added at the new civil frequencies, the L2C and L5C signals. The Air Force has now complied, thanks to strong support from General Willie Shelton. This makes two more civil signals fully available. They currently expect 2.9 meter ranging accuracy, but by the end of the year the Air Force operators expect the same full accuracy as the rest of the signals, on the order of 0.5 meter of ranging error.
This is an outstanding picture.
So What’s the Problem? A statement made by a high-level U.S. government official in my presence exemplifies the problem: “GPS is much too vulnerable. We must replace it with new inertials and chip-scale atomic clocks.”
I found this statement appalling. Unfortunately, it was a meeting where you don’t normally speak up, and I didn’t. Nonetheless, to me, that was totally wrong.
GPS indeed has a very weak signal, and it depends on having clear line-of-sight to four satellites. But in my opinion, a much better statement is what I call the PTA solution. Our goal should be to:
Protect the system and the signal.
Toughen the receiver and the system.
Augment GPS as needed to ensure users’ PNT requirements are met.
The focus is ensuring positioning, navigation, and timing (PNT), not merely ensuring GPS.
Fundamental Prerequisites for PNT
The first prerequisite for GPS-based PNT is a receivable, clear, and truthful(truthful implies full integrity) ranging signal. There are five main challenges to this.
Too-powerful authorized signalsnearby. This aspect snuck up on our community. The FCC authorizers were about to license a powerful signal in the frequency band adjacent to GPS, drowning out any hope of receiving the GPS signal. This can be called the authorized jammer. All PNT providers must be very vigilant about this; we have seen ignorant elements of the government poised to do great harm with well-intended but destructive actions, without knowledge of the unintended consequences.
Natural Interference. This interference, the cause of delays and attenuation, is reasonably well understood, and the subject of much research, dating back to when we first defined GPS. Random events such as solar flares can potentially cause great harm.
Inadvertent Natural or Manmade Jamming. A nearby device that creates spurious, destructive emissions can be a serious problem for GPS receivers. This class tends to be manageable by well-designed receivers.
Collateral Interference. An example is a person who wants to evade tracking but is inadvertently jamming nearby GNSS receivers in addition to his own local receiver.
Deliberate Jamming or Spoofing. This is perhaps the major concern for developers and users. I will discuss this further later.
There is a second major prerequisite: satellite geometry. The user who cannot see enough of the sky is called “sky-impaired.” There are two possible underlying problems:
The satellite constellation has “brown-out” because of failures or inadequate numbers; or
The user is operating in a mountainous or urban area with high, local shading angles.
Overcoming sky-impairment requires a denser constellation, or use of multiple GNSS.
Protect, Toughen, Augment
What can we — as developers, operators, and manufacturers — do to overcome the PNT availability challenges for our users? My solution is PTA. The good news is that quite a few of the actions I recommend are underway — in fact, many of GPS World’s readers are active participants.
I am going to examine these three PTA principles, expand on them a bit, and hopefully explain a few things that help focus on a broad solution.
Protect the System and the Signal
This can be organized into seven actions: three PreActions and four ReActions. PreActions are before there is serious interference, and ReActions obviously come after interference is occurring.
First, the PreActions.
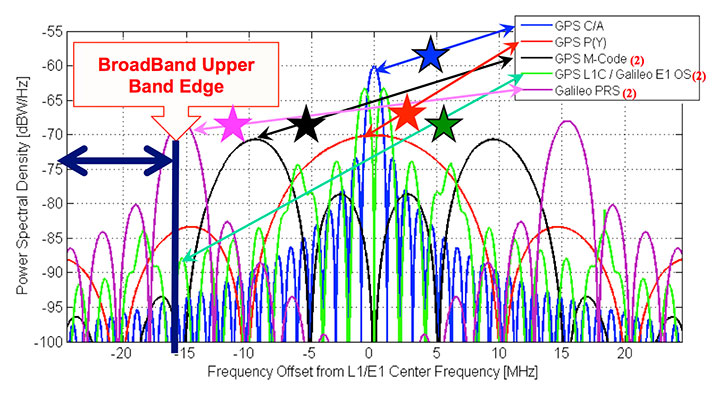
Protect the Spectrum. The chart in Figure 2 represents the frequency plan for the L1 band, and displays some of the sources of the 400 signals I referenced earlier. The blue star, GPS L1 C/ A, is the only fully operational and reliable signal in the world right now. The red star is the U.S. GPS military signal. You can see it has important power lobes close to the band edge. The black star is M-code, the new military signal of the United States.
Figure 2. Frequency plan for the L1 band.
The Galileo power curve, which is pale green, has very significant nodes close to the band edge. Of course, the Galileo PRS (the magenta star) is right on the band edge. The imperative for these wider bandwidths is that they produce sharper correlation edges and consequently produce greater measurement precision. This leads to greater accuracy, and greater usefulness and utility for many PNT users.
Reallocation of radio bands adjacent to GNSS poses a significant threat. The band edge of the proposed high-power communication signal (sometimes called broadband) appears as the black vertical line. It is obviously very close to the edges of many of the colored PNT signals. Tests conclusively demonstrated unacceptable levels of interference with L1 C/A.
Consider the proposed, high-powered terrestrial signal one quarter-mile from a GPS receiver. This produces a power ratio of 5 billion (broadband) to one (GPS). To visualize that power ratio, consider Niagara Falls, which produces about a billion watts. Compared to that, GPS power is a tablespoon of water dropped from five feet, once per second (about 0.2 watts). This is the power ratio that was almost authorized with 40,000 ground-based transmitters in the U.S. At a city block away, the effect is 10 times worse.
To quantify interference effects, some initial tests were run and measured broadband effects used for analysis. Cell-tower locations near Las Vegas, Nevada, approximated the broadband transmitter locations. The nearby airport, McCarran Field, has three RNAV (GPS) approaches. As expected, GPS users on the ground would be significantly jammed, but the effect on aircraft would be nine times worse than the impact on ground receivers. This is due to altitude (line of sight), geometry, and the sensitivity of aircraft receivers.
The 12 broadband transmitters around McCarran Field would jam all of the RNAV GPS approaches to all three runways. Signals of this type would effectively shut down or severely limit operations at the airport.
Signals in the GPS band will increase in the next decade as the newer GNSS become operational. The proposed, adjacent broadband is even more incompatible with these newer signals since they will be closer in frequency. Note that the whole approach was rejected, solely on the basis of L1/CA. It was not even tested against the other, more susceptible, modern signals. The worst would have been yet to come, had they been authorized to broadcast in the adjacent band.
Adjacent bands can continue to broadcast non-GNSS signals originating in space because the power levels will be comparable with the PNT spectrum. But we must be very vigilant to stop any high-power terrestrial signals from being allowed. They would become, effectively, authorized jammers. There should be no spectrum reallocation to ground transmitters until technology has been thoroughly demonstrated to solve any problems, (particularly for the high-precision users) and there is enough time to re-equip the users.
Europeans should have two other important frequency authorization concerns. First, there is a legal barrier within the United States to using Galileo signals. They have not been formally authorized. I think it is a bureaucratic glitch, but it is something we in the United States have to solve; we do want to use all GNSS signals. Stay tuned!
There is another concern. A group at the Electronic Communications Committee, European Commission, recommends allowing pseudolites in the L1 GNSS band. As an experienced user of pseudolites for aircraft landing and some other applications, I believe this is a very risky idea; pseudolites can be very useful, but frequencies should be found elsewhere to avoid unexpected interference.
Stiff Legal Penalties for Interference. The second PreAction is to enact stiff legal penalties for GPS jamming, both in terms of jail time and fines. The goal is to deter the ubiquitous $33 GPS jammer that one can buy on the Internet.
On the U.S. FCC website, the agency lists the penalties for having a GPS jammer. Forfeitures range up to $16,000, and they might even put you in jail. The Australians take a much stronger view: up to five years imprisonment or $850,000 in some cases. Some people are alarmed by these heavy penalties and call them brutal. However, they are not always imposed, and if jamming and spoofing is intentional, especially where the landing of airplanes is concerned and lives are at stake, I think a strong deterrent is warranted.
Stop Jammer Manufacturing, Sales. The third pre-action is to prevent proliferation by shutting down manufacturing and web sales of jammers. What is the status?
The FCC website states that manufacturers should comply with the law: stop marketing these devices in the United States and stop selling and shipping to addresses in the United States. The loophole is you apparently can manufacture these devices if you sell them outside the U.S. Now, I have a little difficulty with this. I have pointed this out to the DHS and others; hopefully, stronger action will be taken.
The FCC told me in an open meeting a few months ago that they were shutting down the websites where these devices are sold. But about three weeks ago, I went online and immediately found a website that sells nine different devices to jam GPS and cellphone devices. Indeed, there were jammers, all very affordable, for jamming just about everything. More recently, the FCC assessed a multi-million dollar penalty against such a jammer manufacturer. We will see if this actually happens. I hope they accelerate these efforts.
Now for the ReActions.
Detect Jamming. To stop jamming, the first step is to know when it is occurring. There are a variety of ways to do this. Some devices or concepts are already on the table: for example, a Chronos CTL3510 GPS Jammer Detector, an Exelis Signal Sentry Jammer Detector, and the J911 cell phone detection and reporting of jamming, an example from NavSys.
The idea behind the NavSys J911 is that all GPS-equipped smartphones have the capability to detect jamming. This does not pinpoint jammer location, but alerts authorities to the problem. Phone location can be reported to a central database for the next two actions.
Pinpoint Jammer Location. Techniques range from directional antennas to time-difference-of-arrival using Fast Fourier Transforms. The latter was demonstrated for the FAA at Stanford more than 10 years ago: location pinpointed within five meters. Cell towers could implement such techniques, since they have accurate time and could run correlations. There are already commercial GPS jamming locators: something called a JLOC (NaySys Jammer Locator). The British are using similar techniques for jammer detection on some of their freeways.
Eliminate Jammer. Having pinpointed the jammer, the next step is to physically eliminate it. What is the status? At Newark Airport there is an FAA, ground-based GPS augmentation system antenna right next to the turnpike. They are part of a blind landing system. In early 2010, there was an infamous jammer interfering with the FAA GPS receiver. It took three months to locate the offending truck driver and shut down the jammer. The good news is that, more recently, in the same general location, they located a similar moving jammer within 24 hours after the interference started. However, these are very special locations. Recent studies have suggested that interference sources are much more widespread. Note: Only certain enforcement personnel are authorized to seize the jammer and arrest its operator.
Prosecute. Having located the offender, the law should then be applied to prosecute. Leeway should be applied, commensurate with the circumstances. In this New Jersey case, the authorities say the perpetrator is liable for a forfeiture of $31,875.
Toughen Receivers
There are at least five well-known ways to toughen receivers, thereby increasing jam resistance:
Increased satellite signal spreading (such as L1C, L5) allowing greater processing gain;
Integration with inertial navigation components;
Digital beam-steering or null-steering antennas;
Increased satellite power such as L5 (a difficult and fairly expensive technique);
Local antenna shading, for example, the top of an airplane, which is shaded from the jammer.
These improvements cascade and are cumulative, but a remaining issue is to make such techniques more affordable.
To illustrate these anti-jamming techniques, consider the effective area of a 1-kW jammer located on the Capitol building in Washington, D.C. A basic high-quality GPS receiver, within a line-of-sight range of 20 miles, will stop providing PNT. Simply using the newest L1C spread-spectrum GPS signal reduces the jamming area by about two thirds, allowing operation to about 10 miles from the Capitol. Adding inertial aiding allows PNT to within three miles, and adding digital beam-forming antennas and using aircraft natural shading brings the effective radius to about 0.1 mile, about the size of the capital building.
The point is toughening the PNT receiver with the technologies mentioned is an extremely effective strategy. It would require over 60,000 jammers to cover the same area as the original non-toughened GNSS receiver.
Some techniques are very affordable today, while others, such as digital beam-forming antennas, remain too expensive for the ordinary user. In addition, there is a potential U.S. problem of export restrictions. Unfortunately, many of these existing restrictions have simply incentivized non-U.S. development of equivalent capabilities.
Augment
The last element of the PTA construct is to augment or substitute PNT sources. We are all aware of the coming revolution in multiple PNT sources from new GNSS. An all-GNSS receiver diversifies the frequencies and the signals, thereby reducing vulnerability to interference. It also improves availability for the sky-impaired user because of densification of satellites sources. Using satellites from multiple constellations can significantly improve availability, provided integrity requirements are met.
With these additional GNSS constellations, there are three major levels of cooperation:
Compatible: no mutal interference;
Interoperable: working to allow common time and geodesy system;
Interchangeable: using accurately calibrated biases and offset. Any four SVs will suffice.
The major issue again is probably integrity, because to ensure economic value, availability requires known integrity. As far as the U.S. FAA and ICAO are concerned, for precision aircraft operations the integrity value should be that the system be “out of spec” less than once in 1 billion times. To be productive they also would like zero minutes of unavailability. That may seem extreme, but commercial aviation and public safety demand it. Regarding integrity, some new GNSS are clearly making faster progress than others.
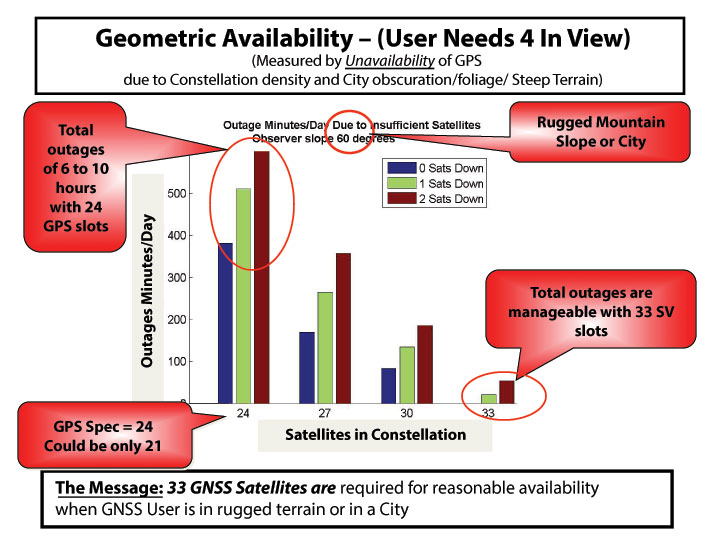
It is useful to further examine the densifying opportunity of additional GNSS. The chart in Figure 3shows how densification can impact the user. The number of satellites (SVs) available in the sky (assumed optimal distribution) is shown. The colors refer to whether 0, 1, or 2 SVs are out of commission for maintenance or repositioning (typical maximum is 1 for GPS). The measure of effectiveness is minutes of outage per day. Consider a shading angle of 60 degrees, representing a user near a rugged mountain slope area or a city. With the nominal 24 SV GPS constellation (the GPS specification is 24 despite the U.S. having 31 active SVs), the outages, due to geometry alone, are six to ten hours. Improvement with additional satellites is dramatic and quite non-linear. With 33 satellites (about a 37% increase in density) outages are zero minutes per day to 33 minutes if one satellite is out for maintenance (reduction by a factor of over 10!). Of course, SVs could be from different GNSS constellations if they are truly interchangeable and have the required integrity. The clear message is that about 33 SVs are needed to cover reasonably high elevation angles.
Figure 3. How densification of additional GNSS can affect the user.
Integrity Monitoring. Currently, the U.S. GPS control segment continuously monitors GPS satellites. If a fault is found, they set the satellite inoperative until the problem is resolved, which may take many minutes. This alarm time is not fast enough for precision aircraft landing and approach (the requirement is six seconds to alarm). For these rapid integrity alarms, the United States relies on the FAA’s WAAS, and Europe uses EGNOS to monitor the basic GPS L1 C/A signal. Soon, the EGNOS message will include Galileo integrity alerts. Unfortunately, the United States does not yet have a plan for reciprocal WAAS monitoring of Galileo signals. In fact, formal approval to even use these signals has not yet been granted by the U.S. FCC.
Self Integrity (RAIM). If an all-GNSS receiver has more than six satellites in view, the user can use the Receiver Autonomous Integrity Monitoring (RAIM) technique. This allows the user to cross-check each measurement against others to find erroneous satellites and guard against spoofing. Take the recent GLONASS situation. With a good RAIM PNT receiver, the user could quickly isolate the large errors from the combined set of GPS/GLONASS measurements. In fact, some deployed receivers did just that. If all GNSS are totally interchangeable, it will be enormously helpful to implement RAIM.
The recent, prolonged GLONASS outage saddened us all because it reduced the credibility of all GNSSs. We hope the Russians will be forthcoming in announcing what happened and the corrections that are being made; hopefully, it won’t happen again.
Fortunately, there is a third independent, real-time tracking network of 200+ sites, known as the Global Differential System (GDGPS). Although NASA administers GDGPS, local-country scientists maintain and operate individual sites in near real time. GPS is monitored down to centimeter precision.
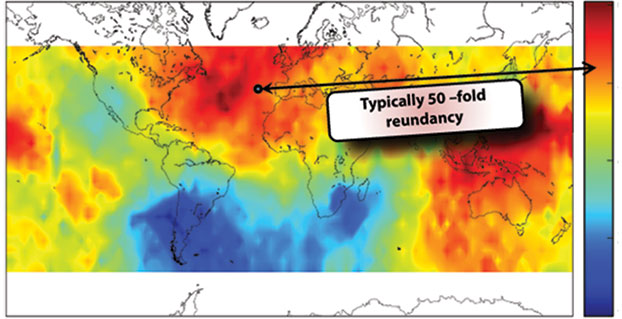
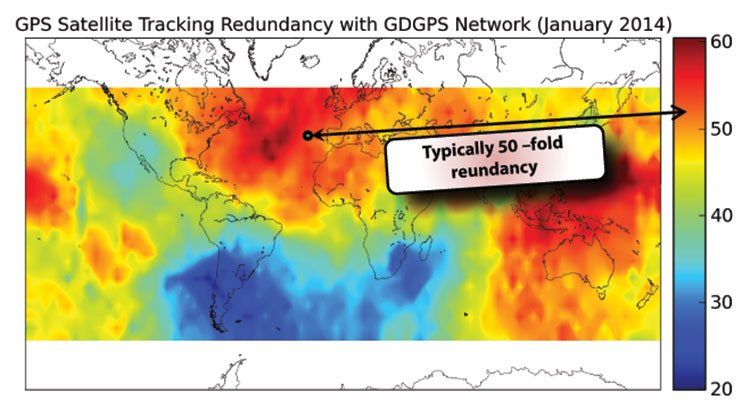
A central issue for GDGPS is whether the integrity monitor capability itself has integrity. Because of redundancy and independence, a form of inverse RAIM, hereby named System Autonomous Integrity Monitoring (SAIM), can be used. Figure 4 depicts the number of independent looks or ranging measurements to a single satellite over various points on the Earth. You can see in the dark areas the value is 60, and even in the relatively unmonitored areas around South America, the redundancy is 20. At a typical spot, perhaps off Spain, it depicts 50-fold redundancy. By cross-checking the dozens of GDGPS measurements for each satellite, a strong integrity cross-check can be created. The GDGPS plan is to also monitor Galileo as it becomes operational. Thus, GDGPS has excellent prospects to provide real-time integrity assessments for all users and all operational constellations. We need plans to connect all users to these potential integrity alarms.
Figure 4. The number of independent looks or ranging measurements to a single satellite over various points on the Earth.
There are three classes of ground-based augmentations:
Pseudolites. Ground augmentations could also include pseudolites broadcasting GPS-like signals for additional ranging. While somewhat helpful, this technique cannot cover large areas and can act as a strong interference source if the signal is in any GNSS frequency band. For this reason, in my opinion, pseudolites should never be authorized in GNSS frequencies.
Distance-Measuring Equipment. Modernized DME, planned as a GPS supplement by the U.S. FAA, is very valuable for the airborne users. Most ground users derive no benefit from DME because they do not have line of sight to the widely scattered transmitters. Ohio University’s Frank van Gras is working for the FAA on a DME plan should GPS not be available. It involves moving from the so-called legacy DME to the enhanced DME to ensure continuous aviation operations.
eLoran. eLoran, covering expandable local regions, uses a powerful signal at an entirely different frequency. It is two-dimensional, but in calibrated areas differential (eDLoran) is perhaps as accurate as 10 meters for harbor areas and similar purposes.
I chaired a study of eLoran for the FAA in 2006. Initially skeptical, the study members finally concluded (unanimously) that eLoran:
meets the needs of all identified critical applications: 10–20 meter navigation accuracy for harbor entrance; 0.3 mile required navigation performance (RNP 0.3); stratum 1 frequency precision and 50-ns time accuracy.
is a modern system: new infrastructure, solid state transmitters, state-of-the-art time and frequency equipment, uninterruptible power supplies; new operating concepts, time of transmission, all-in-view signals, message channel with differential corrections, integrity; new digital user equipment, processes eLoran and GPS signals interchangeably, compact H-field antennas eliminate p-static.
is affordable: Less than $143M to fully complete eLoran, avoid costs of decommissioning existing Loran-C infrastructure; operations and maintenance currently $37M/year, reduced with eLoran-enabled automation.
And our group concluded it was the most prudent and cost-effective general augmentation or backup to GPS.
The National PNT Advisory Board also unanimously recommended that we deploy eLoran. The departments of Transportation and Homeland Security supported it; then, after a change of administrations, in a budget crunch, it was defunded, and the dismantling of existing Loran C stations began. Congress now may be taking action, and the recent GLONASS outages should give an impetus to that.
Who Will Implement PTA?
To my knowledge, many elements are currently being pursued, some by GPS World readers. But I can identify no entity that has the authority, the knowledge, the breadth, and the resources to create a single, well-focused program. This reminds me of a fable from Aesop regarding ants. When no leadership emerges, the ants have to band together to solve the problem. Yes, I am suggesting that we are the ants and we all must contribute to the solution, as well as seeking governmental agencies to step up to the responsibility.
In that regard I have a “to do” list. We must:
Protect PNT.
Vigorously defend the spectrum.
Work with lawmakers to increase legal penalties for PNT interference.
Work with manufacturers and law enforcement to improve timeliness and accuracy of interference identification (crowd-sourcing, every cell phone a detector).
Field jammer location equipment.
Toughen PNT.
Develop industry (ICAO/RTCA/RTCM) standards for deep inertial integration and directional antennas.
Develop vector receivers (all GNSS).
Continue to implement ARAIM and inertial for integrity (+WAAS/EGNOS).
Encourage users to move to rugged receivers.
Augment PNT.
Expand integrity notifications to include GDGPS.
Develop RTCA standards for seamless DME and GPS/GNSS.
Implement eLoran and develop RTCM standards for seamless use.
Develop an international process for integrity certification of all GNSS (GLONASS, Galileo, and BeiDou).
In conclusion, the rumors of the death of GPS, in my opinion, are greatly exaggerated. Let’s not throw out the baby with the bath water. Instead let’s accelerate and expand PTA to Protect our band, and Toughen our receivers, and Augment GPS to ensure that PNT is available for all users now and in the future.
In the words of American poet Robert Frost,
The woods are lovely, dark and deep,
But we have promises to keep,
And miles to go before we sleep,
And miles to go before we sleep.
Thank you.
BRAD PARKINSON has been the Edward C. Wells Endowed Chair (emeritus) at Stanford University, where he is a recalled professor of aeronautics and astronautics.
He co-founded the well-known Stanford GPS Laboratory and led the development of many innovative uses of GPS, including blind aircraft landing, precision farm tractors, and the prototype of the FAA’s WAAS. He also directed development and was a co-PI for the successful test of Einstein known as Gravity Probe-B sponsored by NASA. He worked in various executive or board capacities at Trimble Navigation, Intermetrics, Rockwell International, and The Aerospace Corporation.
As an Air Force colonel, from 1972 to 1978, he was the chief architect and first director of the NAVSTAR GPS development program, retiring from the service after orbiting the first GPS satellites and proving GPS capabilities. He is a fellow of five professional societies and recipient of dozens of awards, including:sharing the 2003 Draper Prize with Ivan A. Getting for leading the development of the Global Positioning System.
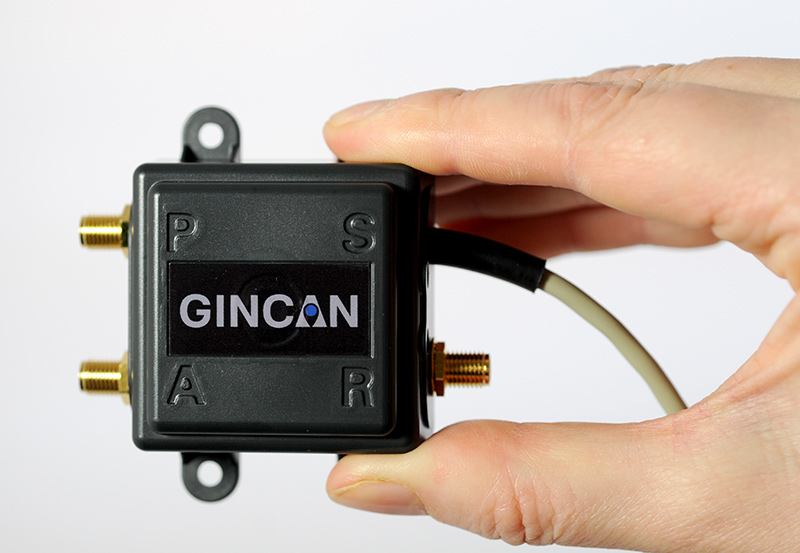
Chemring Technology Solutions has developed miniaturized GPS anti-jamming technology it has dubbed GINCAN. GINCAN is designed to combat illegal GPS jammers and is based on the adaptive antenna concept used by military systems. GINCAN has a chip footprint of six millimeters squared.
GINCAN’s reduced size and weight will significantly cut power usage and cost, the company said, making it ideal for combatting the widespread problem of low-powered GPS jamming. GINCAN can be integrated into a range of applications, including in-vehicle satellite navigation systems and cellular technology, and can be used for the protection of the critical infrastructures which rely on GPS to provide positioning and timing.
GPS jammers have already been developed to interfere with the European Union’s Galileo system, which will provide European satellite navigation independently from the Russian, USA and Chinese systems by 2019. Chemring Technology Solutions, based in Romsey, England, has anticipated this problem and its GPS anti-jamming technology will also support systems using Galileo.
Once the preserve of the military, there is now an increasing demand for GPS protection in the civilian market as illegal GPS jamming equipment becomes widely available on the Internet. The £1.5 million government-funded Sentinel project, designed to measure GPS jamming on UK roads, recorded more than 60 individual jamming incidents across six months at a single location. Such attacks could seriously impact industries, including maritime, aerospace, the emergency services and even stock market trading.
“Many years of developing GPS protection technology for the military has enabled our research and development team to miniaturize anti-jamming technology,” said Martin Ward, product manager, Chemring Technology Solutions. “GINCAN can now be easily integrated in to a range of applications to provide effective protection against jamming devices.
“As we become increasingly reliant on GPS technology, and low-cost jammers are proliferating, so a potential time bomb is being created. Chemring Technology Solutions is now able to offer the answer to this problem with jammer protection at a reduced size, weight, power and cost footprint.”
GINCAN is an export controlled product and subject to UK export restrictions.
I’ve written this many, many times in the past eight years that I’ve written for GPS World magazine, but I have to write it again — this is an exciting time for GNSS!
For me, high-precision GNSS is particularly exciting. I’ve been traveling like crazy, and involved in a number of really fun projects that incorporate high-precision GNSS. Of course, on these various projects I usually incorporate many types of technologies that support GNSS, such as computing, communications, power, and mechanical.
Along those lines, I find myself more and more frequently setting up custom RTK bases for companies because they’re getting cheaper and cheaper, regardless of the fact that there are an increasing number of publicly available real-time kinematic (RTK) base stations. Setting one up doesn’t just involve plugging power into a RTK base receiver and hitting the on/off switch. As I mentioned above, setting up an RTK base involves several different types of technologies. Sometimes, I set up a desktop computer next to the RTK base to act as a server to manage the RTK GNSS base and communications (both network and RTK communications) equipment.
In your mind, when you think of a desktop computer, you probably envision something that occupies 2-3 square feet (~one square meter) of desktop space, along with a keyboard and monitor. So, a consideration when deploying an RTK base is finding desk space somewhere in the user’s office to accommodate the desktop PC and other equipment.
Recently, I took a different approach. I found (actually, my client found) an incredibly small computer to be our server. Just as high-precision GNSS receivers are getting smaller and smaller, so are computers. The Intel Mini-PC measures 4 inches x 4 inches (10.16 x 10.16 centimeters) and has no hard disk. It uses solid-state drive (SSD) memory for storage. SSD technology is still somewhat expensive ($1+ per gigabyte), but it is small compared to a classical disk drive, and doesn’t have any moving parts. Furthermore, the Mini-PC has ethernet ports: when we connect a network cable to it, we could access the Mini-PC via Remote Desktop. That meant we didn’t need a keyboard or monitor. The Mini-PC had all the power we needed, and we could load any sort of control software on it because it runs the standard Windows 7 (or 8) operating system. Last but not least, the Mini-PC costs only $149. However, you need to add memory, SSD, and so on, so the real cost is ~$400 depending on your configuration. While not cheaper than similarly performing “boxes” available, it’s certainly one of the smallest.
Intel Mini-PC Measuring 4″ x 4″
In fact, it’s so small that we stuffed it inside a 14” x 12” electronics enclosure box along with the RTK GNSS base and other network equipment, and hung it out of sight on a closet wall. No desktop space required. Without stretching your mind much, you can see where desktop computing is headed; very small and inexpensive enough to be dedicated to specific tasks. Think about this and then consider the Internet of Things concept. It’s very exciting.
More RTK on Mobile Devices
Later this week I’ll be experimenting with RTK on mobile devices with the CRTN (California Real Time Network), a collection of 330 RTK bases located throughout California. I’ll be using a Panasonic ToughPad running ArcGIS Mobile (and maybe ArcPad) and an iPad using a cloud-based mapping service. The latter is particularly interesting because there are lots of cloud-based GIS data collection apps on the market and under development. Specifically, there’s a lot of subscription-based, cloud-based software. The challenge is that they are even less geodesy-intelligent than the “professional grade” GIS data collection software on the market. In other words, they read coordinates (NMEA format) from GNSS receivers and feed them directly into their app. No datum transformations are provided, neither horizontal nor vertical. That’s going to be a problem.
FCC Levies Record Fine Against Chinese Supplier of GPS and Mobile Phone Jammers
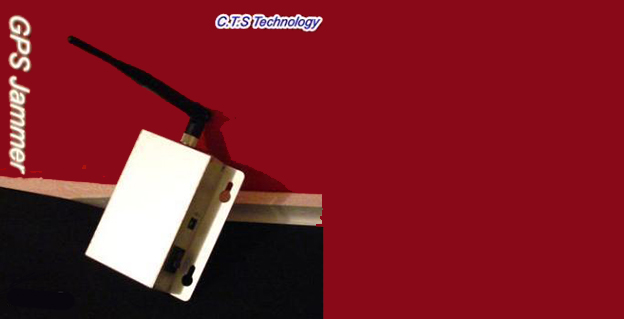
The Federal Communications Commission (FCC) announced that it plans to issue the largest fine in its history against C.T.S. Technology Co., Limited, a Chinese electronics manufacturer and online retailer, for allegedly marketing 285 models of signal jamming devices to U.S. consumers for more than two years. The FCC plans to levy a $34.9 million fine against CTS. The FCC reported that CTS sold 10 high-powered signal jammers to undercover FCC personnel.
The FCC is asking people to report the sale or use of an illegal jammer by contacting the FCC Enforcement Bureau through the FCC online complaint portal, or by calling 1-888-CALL-FCC (or 1-888-225-5322). To voluntarily relinquish a signal jammer, e-mail [email protected]. Additional information, including the FCC Consumer Alert on the jamming prohibitions and the FCC Enforcement Advisory to retailers regarding the marketing of illegal signal jammers, is available at www.fcc.gov/jammers.
You can view the FCC enforcement action against C.T.S. here.
Satellite Launch Pads are Warming Up
Two GPS Block IIF satellites, one launched in February and one launched in May, were set healthy in the past three weeks, making a total of six IIF GPS satellites in orbit broadcasting on three civil frequencies; L1, L2C, L5.
On July 31, the seventh GPS IIF satellite is scheduled for launch, followed by an October 2014 scheduled launch of the eighth GPS IIF satellite.
On June 14, Russia launched a GLONASS-M satellite. It has not been set healthy yet. There are a total of 24 healthy GLONASS satellites in orbit. You can check the current status of GLONASS satellites here.
On August 22, Europe is scheduled to launch the first two Galileo FOC (Full Operational Capability) satellites to add to the four test satellites in orbit that will be integrated into the final operational constellation. A second pair of Galileo satellites is scheduled for launch in November 2014. These are projected dates and subject to slippage.
Galileo Satellites in the Clean Room
Live Webinar from the Esri International User Conference on July 17
In a GPS World first, we’ll be producing a live Webinar from the Esri International User Conference next month on Thursday, July 17 @ 10 am Pacific Time in the exhibit hall at the San Diego Convention Center. Of course, the webinar will be focus on one of the hottest topics, high-precision GNSS on mobile devices; from iPads to Android tablets to smartphones.
Tune in or join us live from the exhibit hall floor! Register here.
The Federal Communications Commission plans to issue the largest fine in its history against C.T.S. Technology Co., Limited, a Chinese electronics manufacturer and online retailer, for allegedly marketing 285 models of signal jamming devices to U.S. consumers for more than two years.
The FCC applied the maximum fine allowed to each jammer model allegedly marketed by C.T.S., resulting in a planned fine of $34,912,500.
“All companies, whether domestic or foreign, are banned from marketing illegal jammers in the U.S.,” said Travis LeBlanc, Acting Chief of the Enforcement Bureau. “Signal jammers present a direct danger to public safety, potentially blocking the communications of first responders. Operating a jammer is also illegal, and consumers who do so face significant civil and criminal penalties.”
C.T.S. operates a website that markets consumer electronics to individuals in the United States, where it allegedly misled U.S. consumers by falsely claiming that certain signal jammers were approved by the FCC. In fact, the use of such devices by U.S. consumers is illegal under any circumstance. C.T.S. also sold 10 high-powered signal jammers to undercover FCC personnel.
The FCC also is ordering C.T.S. to cease marketing illegal signal jammers to U.S. consumers and provide information to the FCC about any persons and entities in the United Sates that purchased its devices.
Signal jammers are radio frequency transmitters that intentionally block, jam, or interfere with authorized communications, such as cellphone calls, GPS systems, Wi-Fi networks, and first responder communications. It is a violation of federal law to market, sell, import, or use a signal jammer in the United States and its territories, except in very limited circumstances involving federal law enforcement.
The FCC is asking people to report the sale or use of an illegal jammer by contacting the FCC Enforcement Bureau through the FCC online complaint portal, or by calling 1-888-CALL-FCC (or 1-888-225-5322). To voluntarily relinquish a signal jammer, e-mail [email protected]. Additional information, including the FCC Consumer Alert on the jamming prohibitions and the FCC Enforcement Advisory to retailers regarding the marketing of illegal signal jammers, is available at www.fcc.gov/jammers.
$2,000 for an RTK base and rover? Yes, it’s real. Well, at least it seems real.
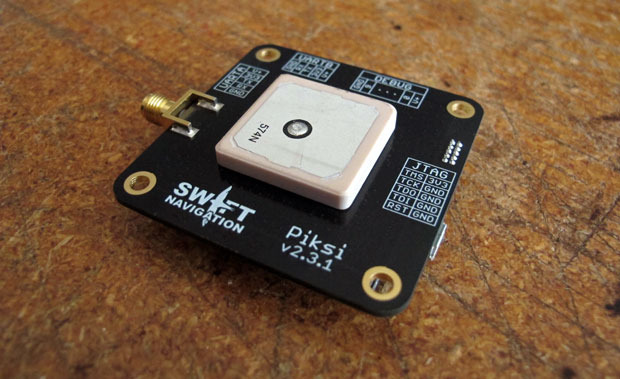
For $2,000, you can order an RTK base and rover set named Piksi, including radios.
It’s an intriguing opportunity, and might be the first brush stroke of the picture I’ve been painting (metaphorically speaking) for the past few years about inexpensive RTK receivers forthcoming. But, before you get really excited, read on.
Besides the attractive price, something else that makes Piksi interesting is the way the company is financed. The way that a typical company funds new product development is through its own cash flow or financing. The company designs and produces a product, then announces it to potential buyers (you), who then touch, feel and use the product to understand how it performs…all before making the decision to purchase. Piksi (Swift Navigation) doesn’t follow that model.
Piksi is using a new-age, crowd-sourced funding model called Kickstarter. With Kickstarter, a group of people (creators) offer to design and produce a certain product if they can recruit enough “investors” to fund their endeavor. The “investors” aren’t traditional venture capitalists, nor people who would own stock in said company. The investment is simply a commitment to buy the product based on the specifications provided by the creators, before the product is finished. If the company has enough commitments from “investors,” the creators commit to designing, building and delivering the product.
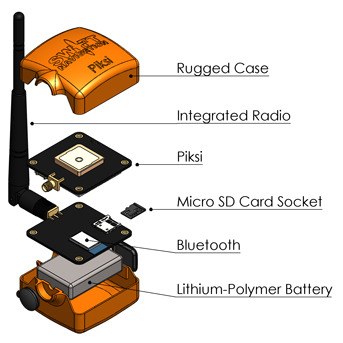
Furthermore, there are certain levels of investment available for Piksi, from $7 which will get you a Swift Navigation micro-USB cable, to $2,000, which will get you a ruggedized version of the complete RTK kit, including base, rover, XBee radios, Bluetooth and SD card storage. So far, Swift Navigation has raised $161,369 towards the project with today, September 4, being the last day. That’s far more than the $14,000 goal it set.
The caveat is that the product is not complete yet, at least the RTK portion. According to Swift Navigation:
We have already built a small batch of Piksi receivers that are ready to ship and have locked down all part sourcing and manufacturing for further batches, so there are unlikely to be any unanticipated delays in the delivery of Piksi hardware.
However, it’s difficult to know exactly how long the RTK functionality will take to implement — software development schedules seem to always run over their anticipated delivery dates, even when you take into account Hofstadter’s Law. We feel the goals we’re proposing to accomplish with this campaign are reasonable — adding a new set of software functionality (which we successfully implemented on a previous platform) upon an existing base of stable hardware and software.
The gamble that the investor takes is that Swift will be able to finish the product, produce it, and meet the performance specifications. However, that’s only part of the battle. I spent better than 10 years of my life managing the design and production (somewhat) of GPS-based hardware and software for mapping and surveying. There are a million details. A major part of developing a hardware/software product like this is making it reliable. What I mean by reliable is that it behaves the same way every time you push the ON button, and works consistently and reliably all day until you press the OFF button. That’s not easy to achieve without a lot of sophisticated testing in different environments, and nothing can fix a poor reliability design (except a redesign).
The guys behind the Piksi don’t seem to be total GPS-rookies, but do lack substantial real-world experience. Click here and then click on Bios to read about their backgrounds. But who knows? Maybe that’s an advantage, not being conditioned to “follow the rules.”
One last note, and an important one. It’s only an L1 system, so don’t get too excited. L1 means that you really can’t use an RTK network (practically speaking) and that the baseline distance needs to be pretty short. The RTK initialization and re-initialization times will be measured in minutes, not seconds, and that’s assuming they get the RTK algorithms correct (and reliable).
Sorry to burst your bubble.
Actually, the concept of an inexpensive, bootstrapped L1 RTK system is not difficult to envision. The GPS OEM boards are readily available, as well as the GPS antennae, wireless comms and the rest of the components. At the risk of sounding pompous, I could put that kind of project together. The trickiest part of the project would be developing/implementing reliable RTK software.
No matter what, it will be interesting to hear about what these guys come up with. In the words of the late Steve Jobs, “stay hungry, stay foolish.”
GPS jammers are cheap, but don’t get caught using one.
Even though they are illegal to market, sell and operate in the U.S., Americans are buying cheap GPS jammers, via Internet stores, from companies operating outside of the U.S. Operating one of these devices in the U.S. is a risky venture (as you’ll read below).
Although they don’t seem to be a serious threat yet, they could become a threat as GPS receivers become more ubiquitous and concerns about privacy continue to ramp up.
The Federal Communications Commission (FCC) is responsible for enforcing the U.S. laws enacted that prohibit the use of GPS jamming devices. If you look at the FCC’s enforcement history here, you’ll see that there isn’t much enforcement activity. However, a recent enforcement action was imposed on a guy in New Jersey who made the mistake of driving by the Newark International airport with his GPS jammer turned on. Uh oh. The FCC tracked down the offender and issued a Notice of Apparent Liability for Forfeiture that included a fine of nearly $32,000. Whoa, that’s a lot of dough. Wonder if he is trying to sue the company he bought it from? Not likely, as they are most certainly outside of the U.S. and out of reach of the U.S. judicial system. Caveat emptor.
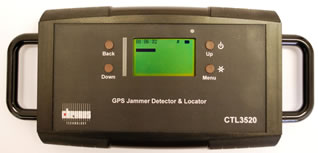
You can be assured that if jamming reports increase, there will be more jamming detection and location equipment deployed to hold people accountable, like this new, handheld GPS jammer detector and locator from Chronos:
You might want to visit this GPS.GOV website on GPS jamming. It contains a lot of information about the U.S. regulations surrounding the marketing, sales and use of GPS (and cell phone) jamming devices.
Third annual Field Technology Conference
In 2010, I, along with two colleagues, put together a conference here in Portland, Oregon, and named it the Field Technology Conference. We created the conference to focus on geospatial technology hardware and software used in the field. It’s the essence of what a conference should be, a group of people gathering to share ideas of common interest. It’s mostly devoid of commercial interests, save a few really neat (and valuable) giveaways and a few exhibit booths. You probably haven’t heard about the conference because we have a very small marketing budget, and the organizers (three of us) can only spend a few hours a month brainstorming, finding speakers, and organizing the event.
This year, our third, will focus on existing and emerging technologies: GPS/GNSS, UAVs, 3D printing, mobile devices, imagery and geospatial software. Our outdoor demonstration area was very popular last year so we’ll offer that again, as well as a UAV demonstration. We’re also planning an on-site demonstration of 3D printing. Can you imagine 3D printing a topographic survey?
Something new this year is our association with the CGSIC (Civil GPS Service Interface Committee). CGSIC is co-locating a regional event with our conference. What that means is that speakers from the U.S. government (Air Force, State Deptartment, DOT, etc.) will make GPS-centric presentations. CGSIC events are the only live communication channel between the U.S. Air Force GPS operations personnel and civilian GPS users. This is your chance to ask Air Force personnel questions, in person, that you’ve always wanted to know about GPS. If you’re unable to travel to Portland for the conference (October 23-24), GPS World magazine is planning on streaming the CGSIC presentations live over the Internet, as well as posting the recording on its website.
Although the conference is organized by the Western Forestry and Conservation Association (which organizes a lot of conferences), take a look at the agenda and you’ll see the content will be of interest to anyone involved with geospatial data collection and processing technology, not just foresters and environmental scientists. For conference details, click here.
When jamming interfered with GPS signals at Newark Airport, a three-month effort determined that low-power, mobile personal-privacy devices were responsible. This article describes how they were found and outlines how the observable parameters of such devices encompass a wide variation in RF spectra and internal modulation.
Personal privacy devices (PPDs) are now recognized as being responsible for causing interference to GPS receivers. However, in November of 2009, when the Local-Area Augmentation System (LAAS) installed its first Ground-Based Augmentation System (GBAS) at Newark International Airport (EWR), this fact was not known. Within the first month of its installation, anomalies in GBAS processing were correlated to the presence of radio-frequency interference (RFI). Initial efforts to determine the source of this unexpected RFI were not successful.
The Federal Aviation Administration (FAA) had a significant interest in finding this RFI source, leading to deployment of RFI detection and location equipment by several groups. Zeta Associates temporarily installed equipment in early January 2010 that was capable of detecting and characterizing RFI but did not have emitter location capability.
Determining that an RFI transmitter is in motion is more certain if the RFI is observed simultaneously by multiple sensors. However, analysis from hundreds of RFI events indicates that when an RFI source is in motion, observations collected by a single sensor can provide sufficient information to determine that the RFI transmitter is in motion.
Continuing interest in understanding PPD effects on GPS receivers led to the installation of remotely accessible monitoring equipment that provides detailed characteristics of these devices. Remote access facilitates monitoring, particularly since PPDs are present for 30 to 60 seconds at a time and only a few times a day.
Background
The January 2010 deployment included a WAAS GPS receiver, spectrum analyzer, and a Zeta custom-developed Snapshot System, assembled from commercial off-the-shelf (COTS) equipment for conducting WAAS site-installation surveys, and capable of capturing intermittent short-duration RFI events. It consists of a tuneable receiver (10 MHz to 3 GHz) whose RF front end spans 25 MHz that is digitized at a sample rate of 56 MHz, with storage capacity sufficient for up to 80 minutes. Once captured, the time-series data can be analyzed in many different ways. Possible analysis techniques include examination of the raw time samples, generation of spectral plots, or demodulation of the RFI signal. Each approach can lead to a better understanding of the underlying interference signal. If digital data is present and can be demodulated, it might be possible to associate the demodulated bits with a known transmitter.
Data can be captured manually or programmatically using a trigger determined by an algorithm that monitors WAAS GPS receiver automatic gain control (AGC) logs. The AGC function within a WAAS receiver has a well-behaved response for normal Gaussian noise RF environments. When RFI is present, the AGC exhibits atypical responses that then trigger the Snapshot System. As WAAS receivers utilize both L1 and L2, and each RF path has its own AGC, it is possible to detect the presence of potential RFI at either L1 or L2.
The Snapshot System RF input for this deployment was from a PCTEL antenna identical to those used at WAAS reference sites. This antenna incorporates a triplexer that provides three separate 40 MHz passbands each centered on L1, L2, and L5, with approximately 50 dB of gain. This antenna was located approximately one mile north of the four LAAS antennas within Port Authority of New York and New Jersey (PANYNJ) Building 80.
Within the first hour of being deployed on January 20, 2010 the Snapshot System had detected and captured one RFI event in the GPS L1 band. After one day, the Snapshot System had detected and captured more than 25 separate instances of RFI within the GPS L1 band. Most RFI events were narrowband (10s of kHz bandwidth) and short duration (no more than 3 seconds).
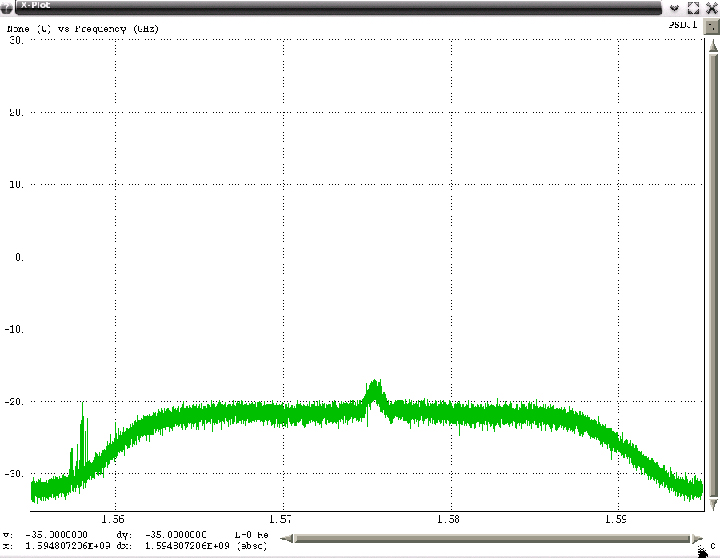
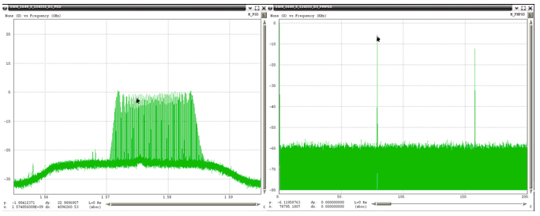
However, there also were five RFI events that spanned more than 15 MHz across L1 (Figure 1) were present as long as 20 seconds and at a power level as much as 25 dB above the receive antenna’s noise floor. Some of these RFI events were strong enough to reduce a WAAS G-II receiver C/N0 by as much as 20 dB and thereby resulted in loss of tracking for lower-elevation GPS satellites. Higher-elevation GPS satellites were able to continue tracking throughout these events but at a lower C/N0. The wideband RFI events were also detected by the SLS 4000 GBAS monitor and coincided with tracking problems in the LAAS GBAS receivers.
FIGURE 1. EWR wideband RFI.
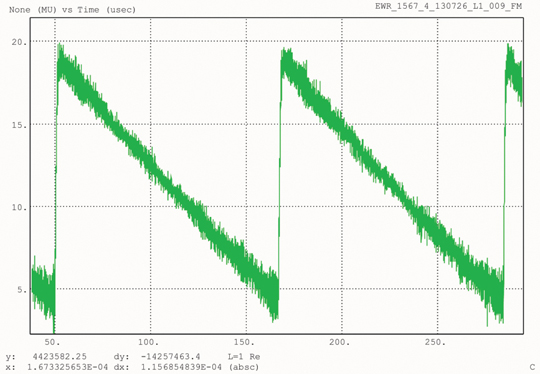
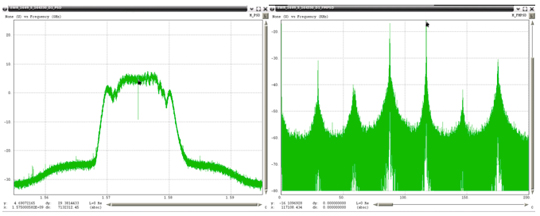
Two of the captured broadband RFI events were demodulated and analyzed. The underlying linear frequency modulation (FM) signal swept over more than 15 MHz in less than 1 millisecond (Figure 2).
FIGURE 2. FM demodulated wideband RFI.
At that time, it was not known if the source of the RFI was stationary or moving, whether it was unintentional (emanating from a licensed transmitter but with malfunctioning electronics), inadvertent (equipment normally used for test purposes and capable of operating in the GPS band but accidentally left on), or intentional (purposeful jamming of GPS).
Since the RFI was observed by GPS receivers separated by 1,700 meters, a search was undertaken to identify any other GPS receivers in the vicinity of EWR. One National Geodetic Survey (NGS) continuously operating reference site (CORS) NJI2 is located near EWR about 4,500 meters northwest from Building 80. Analysis of data from NJI2 during the same time periods that RFI was detected by the WAAS and LAAS receivers did not contain any indication of RFI, and therefore suggested that the source of RFI was more localized to EWR.
The Snapshot System remained in place for approximately two weeks before moving to another location. Collected data was analyzed, showing that wideband RFI was associated with significant degradation to both the WAAS and LAAS receivers. Additional characteristics noted the RFI was intermittent, lasting typically 30 seconds but no more than 60 seconds, was observed more often Monday through Friday, and most frequently around 8 a.m. local time.
Locating The RFI
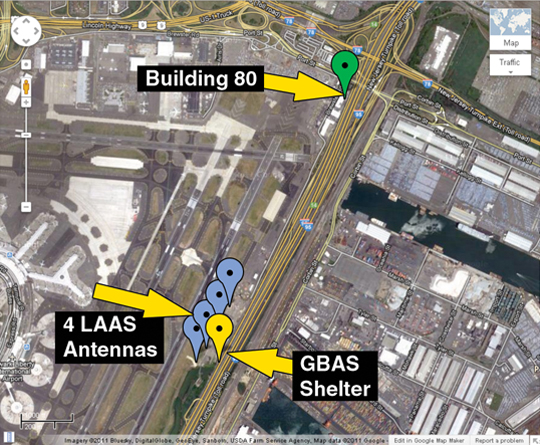
Figure 3 shows a Google map of EWR with blue dots indicating the location of the four LAAS antennas, a green dot for Building 80, and a yellow dot for the GBAS shelter. EWR is adjacent to the New Jersey Turnpike (NJT), which has seven southbound and seven northbound lanes of traffic.
FIGURE 3 Google map of EWR.
Since the Snaphsot System did not include location capability, other teams with direction-finding equipment, including beam-forming antennas, travelled to EWR to try to locate the RFI source. These teams were on site at various times from February to March. However, those efforts did not provide sufficiently reliable information to reduce the search area. By mid-March, the search area remained identical to that of January.
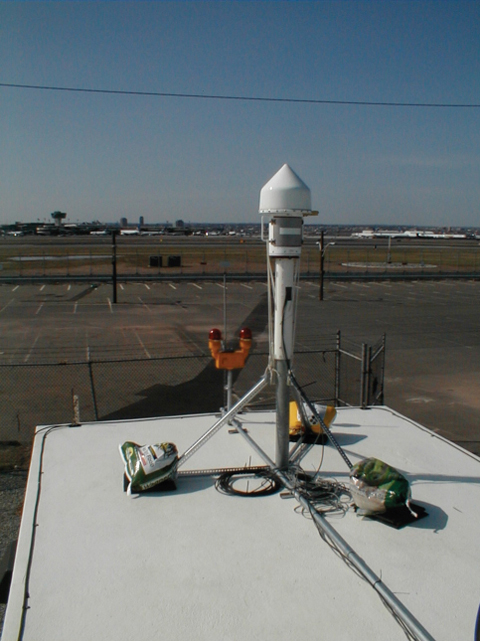
Zeta then deployed two WAAS G-II receivers separated by considerable distance (1,722 meters) to monitor for RFI, and analyze each receiver’s response only when RFI sufficient to significantly degrade GPS reception was detected. One receiver was located within Building 80, and the second receiver within the GBAS shelter near the LAAS antennas. This configuration was designed to determine degradation relative to each reference receiver and thereby establish probable search areas for the RFI emitter. The Zeta equipment also incorporated a rotating directional antenna (at the GBAS shelter shown in Figure 4) that was commanded to rotate only when significant RFI was detected.
FIGURE 4A. Antennas on roof of GBAS shelter.
FIGURE 4B. Antennas on roof of GBAS shelter.
The expectation was that RFI would be detected simultaneously by both GPS receivers, and that the relative degradation in normalized C/ N0 would provide an indication as to which location lay in closer proximity to the RFI source. The rotating high-gain directional antenna would then indicate a reduced probable search area consistent with the relative degradation between the two receivers. At the time this equipment was deployed, it was still thought that the RFI was most likely stationary and high-power. However, the measurement results were quite different than expected. Subsequent data analysis from this equipment revealed that the RFI was low-power and moving, specifically moving along the NJT.
The Zeta equipment was deployed on March 19, 2010, and remained in place while operating automatically. On March 25, data collected during the previous week were analyzed. During this 1-week collection there were 11 instances when both receivers detected wideband RFI events and one antenna rotation even partially tracked one wideband RFI emitter. Such data was indicative of a non-stationary emitter, a finding that was quite significant. Based on data from the two receivers, the apparent velocity of the RFI emitters ranged between 45 miles per hour (mph) to 72 mph. Initial analysis of antenna-rotation data also indicated the RFI source was east of the GBAS shelter and moving south on the NJT.
Understanding the importance of degradations from both receivers was crucial in determining that the RFI has attributes of transmitting at low power and is moving. Had a single stationary RFI emitter been responsible for these observations, the degradations measured at each receiver would have occurred at essentially the same time, not 50 to 80 seconds apart. A high-power moving RFI emitter would also have produced degradations at both receivers at the same time, and since that was not observed, the conclusion was that the RFI emitter was relatively low in output power. Low-power RFI emitters will cause significant degradation to GPS receivers only when they are in close proximity to them, on the order of hundreds of meters.
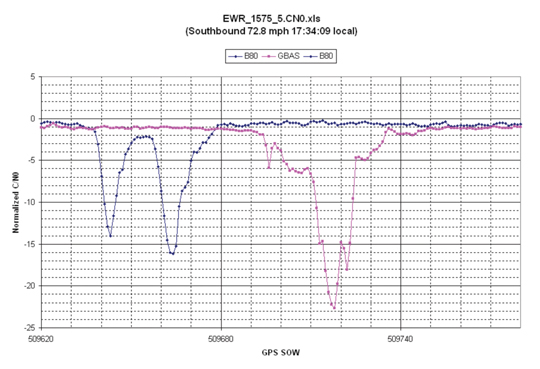
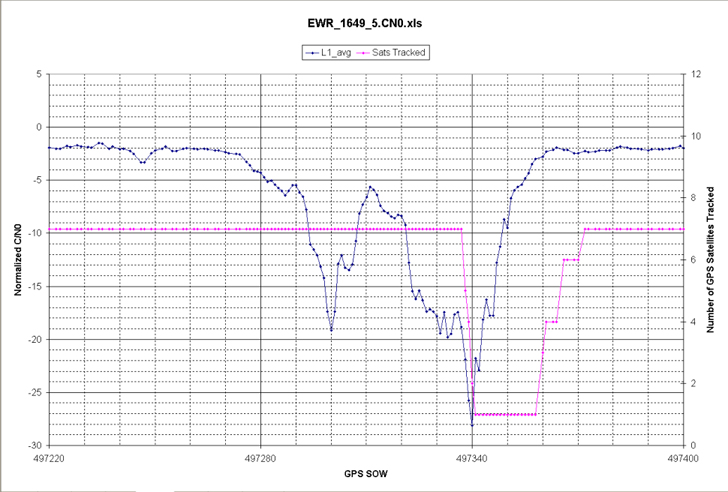
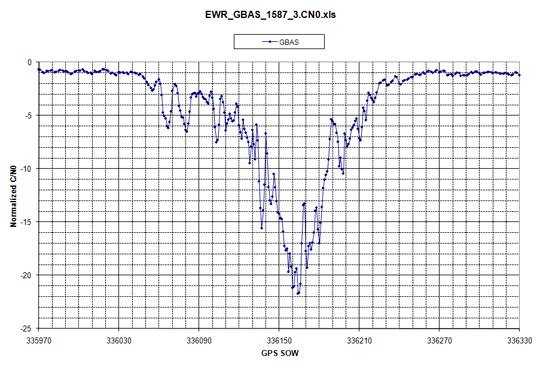
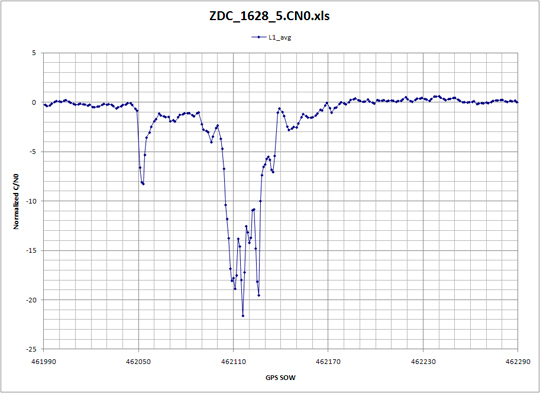
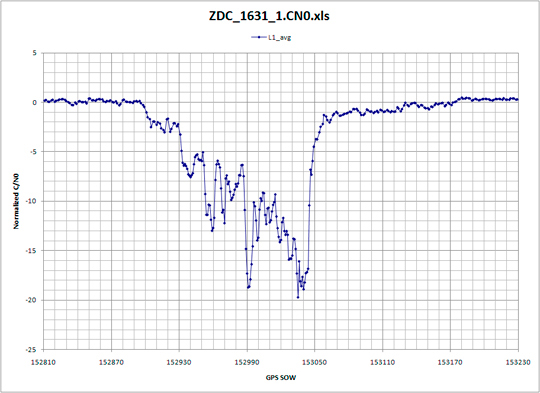
Receiver data logs were processed specifically for degradation in normalized C/N0. Normalized C/N0 was only computed for those satellites above 20 degrees, and all of those results were averaged together. Prior knowledge regarding WAAS PCTEL antennas has established an expected C/N0 versus satellite elevation that is accurate to approximately ±1 dB with a nominal mean of 0 dB. This normalized C/N0 represents an average of all satellites in view. However, individual satellite signal strength can vary greater than ± 1 dB. Significant deviations of more than –3 dB are indicative of strong RFI within the GPS processing band. Normalized C/N0 was plotted for each day that data was collected, followed by expanding those time periods where significant degradation was present.
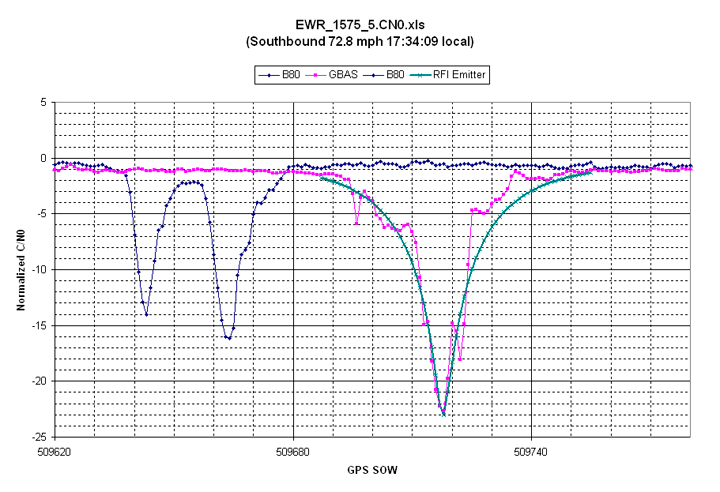
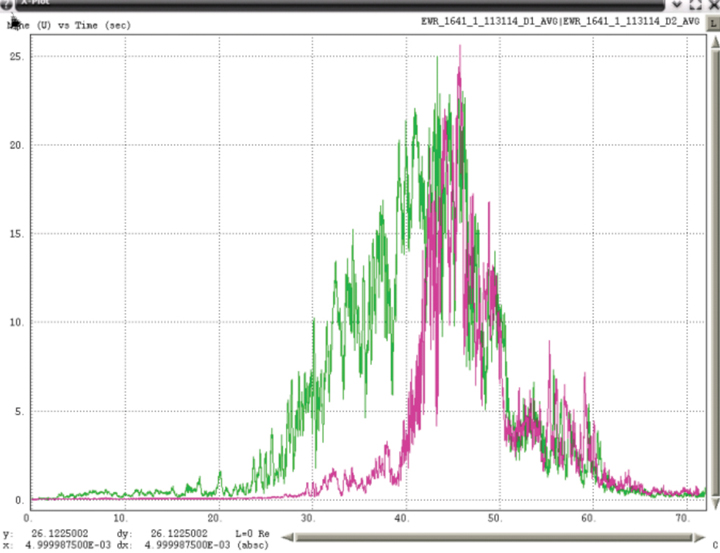
Figure 5 shows data of the first evidence of a low-power moving PPD. Data for Building 80 receiver is in blue and data from the GBAS shelter receiver in pink. Since Building 80 is north of the GBAS shelter, when degradations occurred first at Building 80, this implies that the RFI emitter is moving from north to south. Similarly, when degradations were first seen at the GBAS shelter, the RFI emitter was moving from south to north. This plot uses major time grids of 60 seconds and minor grids of 10 seconds.
FIGURE 5. Normalized C/N0 observed at Building 80 and GBAS shelter.
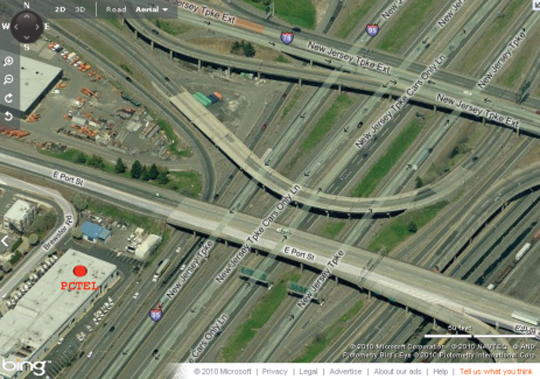
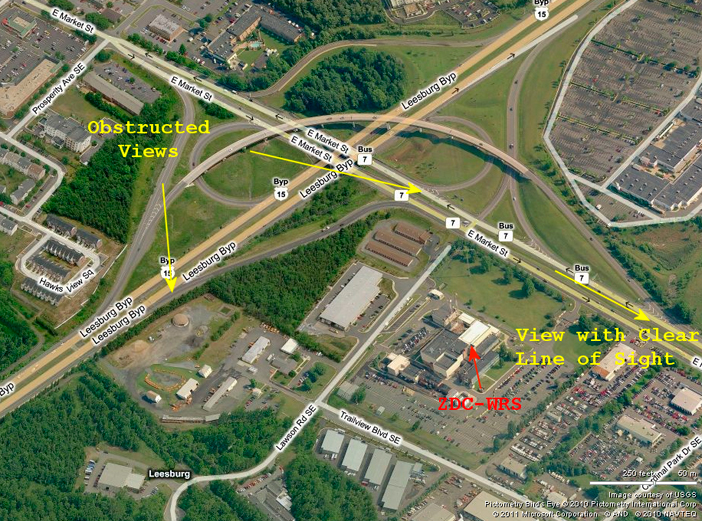
The double separate degradations observed by the Building 80 receiver have only been observed from monitoring equipment located at that building, and have since been associated with travel paths of PPDs on the nearby highways. Both GPS receiver and spectral data contain this same characteristic. This characteristic is due to the fact that vehicles traveling south on the NJT have clear line of sight to the roof of Building 80 (shown by Figure 6) before they travel under Interstate 78, after which they pass next to Building 80. During the time that they are under Interstate 78, their transmissions are blocked in the direction of the roof of Building 80.
FIGURE 6A. View of NJT near Building 80.
FIGURE 6B. View of NJT near Building 80.
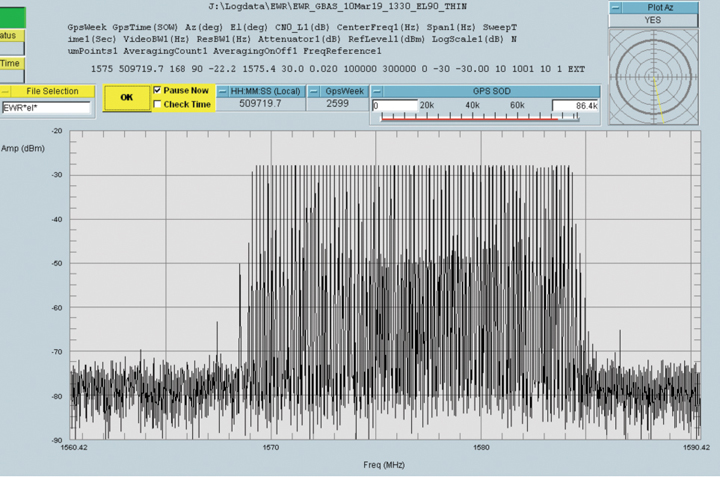
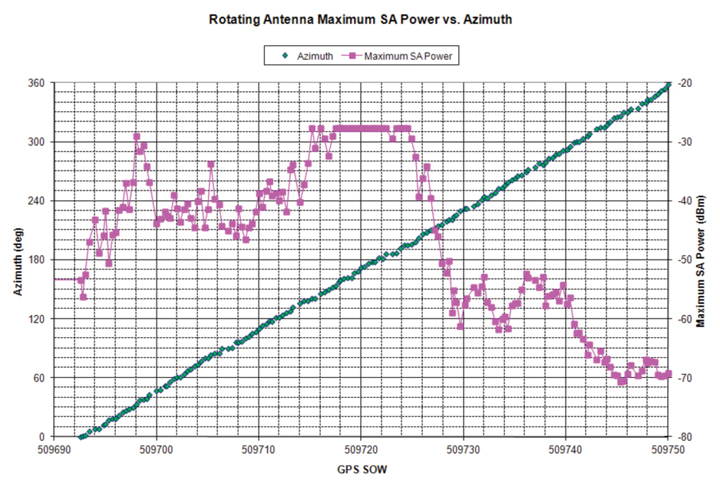
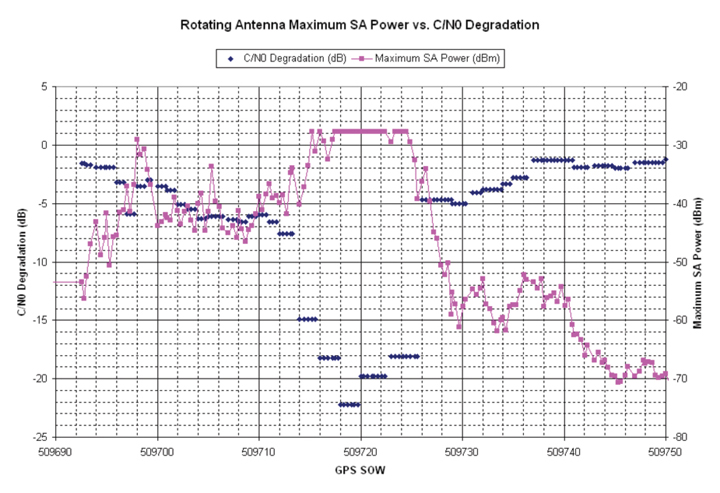
Spectral data as observed by the 4-foot reflector is shown in Figure 7. Figure 8 shows spectral maximum data as collected by the 4-foot linearly polarized reflector along with additional information.
FIGURE 7. Wideband RFI observed by 4-foot reflector (click to enlarge.)
FIGURE 8A. Pink represents spectral maximum data as observed through the reflector, green represents the azimuth of that antenna, and blue the reported degradation of the GBAS shelter receiver.
FIGURE 8B. Pink represents spectral maximum data as observed through the reflector, green represents the azimuth of that antenna, and blue the reported degradation of the GBAS shelter receiver.
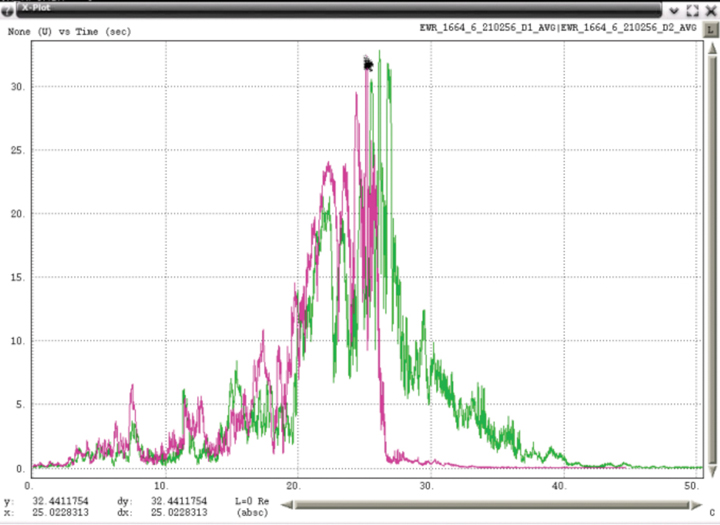
When the GBAS shelter receiver at first detected RFI, the reflector began rotating from an azimuth of 0 degrees in a clockwise direction. At the same time, a spectrum analyzer began capturing spectra at a rate of 3 per second. The first spectral maximum was observed at an azimuth of 30 degrees, a direction in which the antenna was pointed towards the NJT, to a location approximately 900 meters away from the GBAS shelter. The next time spectra were at high levels occurred for azimuths between 145 to 195 degrees, or southeast of the GBAS shelter. The approach of using a rotating antenna was originally intended to provide a direction towards a stationary source and not to track a moving emitter. However, it appears that to some extent, the rotating antenna in fact did track a moving emitter from north to south.
On the afternoon of the day these results were communicated to the FAA lead for the EWR RFI investigation, all search activities were shifted to the NJT and away from the airport operating area. Just south of the GBAS shelter there is an official-use overpass that straddles the NJT. All detection equipment was positioned onto the overpass, under the hypothesis that the RFI was emanating from vehicles traveling the NJT. Evidence substantiating this initial finding was found within a day, and approximately one month later a concerted effort was undertaken to identify and stop a single vehicle that was using a PPD.
The Zeta equipment remained in place for many months and continued to provide additional evidence of PPD characteristics. Early in the investigation it was hoped that only a few PPDs had been responsible, but as more data was collected it became evident that many different types of PPDs were traveling along the NJT past EWR.
Modeling PPD Effect
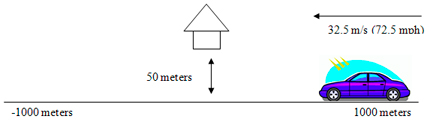
Once it was realized that the RFI was from low power moving emitters, a simple model was used to predict their degradation effect on WAAS GPS receivers. The model shown in Figure 9 was used for the purpose of computing distance between the RFI emitter and a WAAS antenna and to then compute the additional level of interference noise power that the WAAS antenna would receive. Here, the WAAS PCTEL antenna is located 50 meters from a road that is 2000 meters long and straight and has an RFI emitter transmitting +25 dBm, moving at 32.5 meters per second (72.5 mph) and with clear line of sight to the WAAS antenna.
FIGURE 9. Simple model of moving emitter.
FIGURE 10. Model of normalized C/No due to a PPD.
With these assumptions it is a simple matter to compute the additional noise power at the WAAS antenna. Non-coherent summation of the RFI noise and inherent system noise was used to compute the total noise power and therefore the additional degradation in C/N0. The resulting predicted degradation was overlaid on one of the actual RFI events and is shown as a green line in Figure 10. The predicted degradation closely resembles actual event data logged by receivers.
The shape of degradation in normalized C/N0 versus time has been observed in nearly all of the EWR RFI events that have been analyzed. The magnitude of degradation depends on the power of the RFI and its proximity to the GPS antenna, while its time duration depends on the velocity of the vehicle carrying the PPD. The shape is directly related to the distance versus time between the vehicle and the WAAS antenna. Faster/slower moving vehicles with PPDs will simply shrink/stretch the time scale. Curved roadways would have different shapes that could also be readily predicted.
CORS data was revisited after realizing that PPDs were traveling the NJT. Specifically, two CORS sites CTDA (70 meters from Interstate 95) and NJDY (380 meters from Interstate 95) were identified. Data from those two sites were analyzed for a couple of weekdays. Possible evidence of PPDs was found within that data. Reported Signal to Noise Ratio (SNR) from CTDA and NJDY contained variations similar to those observed by GPS receivers at EWR during times when PPD induced RFI has been detected.
Continued RFI Monitoring
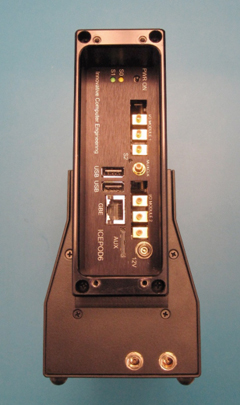
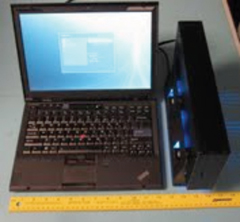
The LAAS program desired continued monitoring of RFI from PPDs near EWR, including estimates of their effective isotropic radiated power (EIRP). Additional equipment was assembled to provide this capability and installed on March 3, 2011. This monitoring equipment is located within the GBAS shelter at EWR and comprises several COTS components that incorporate improvements beyond the first Snapshot System used at EWR. Improvements include an upgraded Snapshot System (Figure 11), an RHCP directional antenna, and a wireless modem that provides remote access to the monitoring equipment.
Figure 11A. Snapshot System ICEPOD6-M5.
FIGURE 11B. Snapshot System laptop.
Remote access makes it possible to analyze captured RFI data from any computer connected to the Internet, and to modify software if necessary. The new equipment configuration, specifically the use of an AEL AST 1507AA RHCP antenna, was chosen with the explicit purpose of establishing more accuracy in estimated EIRP.
Analysis of data collected during 2010 indicated three significant sources of error in estimating EIRP; Free Space Loss (FSL) from not knowing the exact position of the PPD on the NJT, polarization mismatch loss between the PPD antenna and the receive antenna, and the effects due to transmission from within a vehicle. Differences in FSL loss between the closest southbound lane on the NJT and the most distant northbound lane is on the order of 11 dB. If it is known that the PPD is traveling south, the difference in FSL between the nearest to farthest southbound lanes is less but still about 6 dB. FSL differences for northbound lanes are smaller, on the order of 3 dB. Knowing the direction of travel reduces this uncertainty but does not eliminate it. The WAAS PCTEL antenna is RHCP, but at the horizon has an axial ratio of approximately 5 dB. Many PPDs appear to be using quarter wavelength dipole antenna that are mounted with a rotatable connector. Assuming all PPD antennas are linearly polarized, there would then be an uncertainty of about 5 dB when using data observed by the WAAS PCTEL antenna. The AEL antenna has an axial ratio of 0.2 dB at L1 and significantly reduces uncertainty of polarization mismatch loss. Even though the AEL antenna has a 3 dB mismatch loss, that loss has an uncertainty of 0.2 dB for any orientation of the PPD antenna. The PCTEL antenna has a symmetric gain response relative to the NJT. The AEL antenna was pointed to the north intentionally so that observed RFI power will be stronger when a PPD is north of the GBAS shelter. Simultaneous capture of real time samples from both antennas by the ICEPOD6-M5 provides an indication of the direction in which the PPD is traveling. The third uncertainty comes from the effects of the PPD being located within a vehicle. Vehicular effects on the PPD transmitters were not accounted for due to difficulty in using a simple model. Aloi [1] has measured vehicular effects of quarter wavelength dipole antenna (typically used by PPDs) and has previously published [1] [2] on the effect of vehicles on GPS signals. His most recent findings have not yet been published but indicate that the type of vehicle, the location of a dipole antenna within it, and the position outside of the vehicle from which power is being measured, can lead to significant variation (10 to 15 dB) of the observable power. Consequently, the reported EIRP estimates from the Snapshot System have been referenced to a point just outside the vehicle and do not attempt to account for vehicular effects.
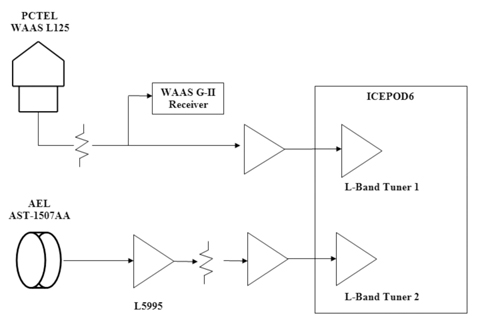
Figure 12 shows a block diagram of the current monitoring equipment. The PCTEL antenna along with the WAAS G-II receiver is used for monitoring GPS signals. WAAS G-II receiver logs are monitored continuously and saved to disk, but snapshots are only taken if the RFI algorithms indicate that RFI is present. A snapshot will be taken if any of three tests (based on AGC, normalized C/N0, or spectral power) are exceeded. Narrowband RFI tends to most impact the AGC response, while wideband RFI tends to trigger the normalized C/N0 metric. Since the Snapshot System is also continuously monitoring the RF spectra from both antennas, an additional test checks if there are significant spectra changes.
FIGURE 12. Current Snapshot monitoring block diagram.
The AEL antenna is connected to a filter/low noise amplifier (LNA) (Delta Microwave L5995) identical to those within the PCTEL antenna, before it is connected to one of the two L-band tuners (900 to 2200 MHz) of the ICE-Online ICEPOD6-M5, which includes 1 TB of long-term storage and 8 GB of high-speed RAM and is capable of sustained data transfers of as high as 400 MB/s between the L-band tuners and disk. Sample rates and RF filtering are programmable and have been set to use a complex sample rate of 40 MSPS and an RF bandwidth of 30 MHz. When RFI is present, data transfers are 320 MB/s. The internal 1 TB disk can store approximately 100 minutes of RFI. Software parameters limit RFI data capture for any single event to no more than 90 seconds. Implementation of a circular buffer within the high-speed RAM (8 seconds for each L-band tuner path) allows continuous capture of RF data while waiting for a trigger indicating that RFI is present. To reduce false alarms, RFI must be present for at least 4 seconds before data is captured. However, no RFI data is lost, because the circular buffer is longer than 4 seconds. RFI data captures typically contain 3 seconds of data at the beginning, with no RFI, and therefore make it possible to observe the onset of the RFI.
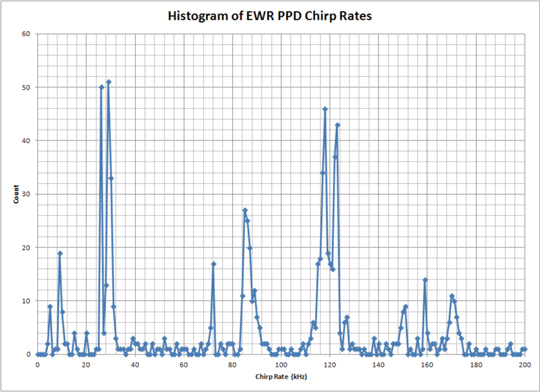
The new equipment has captured hundreds of RFI events, spanning a wide range in bandwidth (7 MHz to an estimated 150 MHz), chirp rate (9 kHz to 170 kHz), and power levels (–10 dBm to as much as +20 dBm). Accurately estimating EIRP of moving emitters is a challenge and requires detailed knowledge of the characteristics of all components used in generating the estimate. Furthermore, distance to the RFI source can only be inferred, since its movement precludes exact measurement, and consequently there will always be some uncertainty in any reported EIRP. However, even with these qualifications, there is evidence from Snapshot System data that some of the RFI sources are transmitting at power levels as much as +20 dBm.
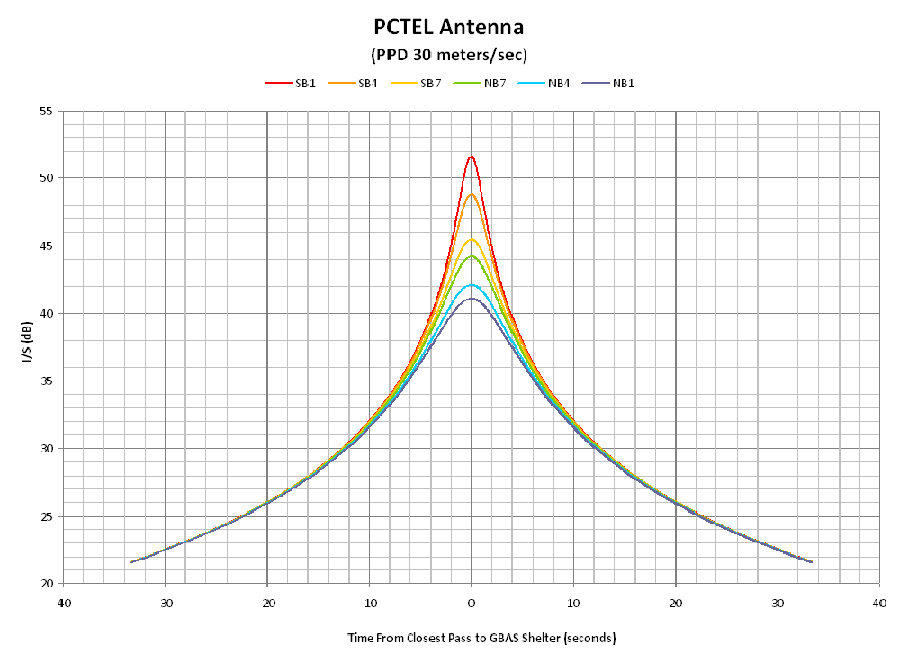
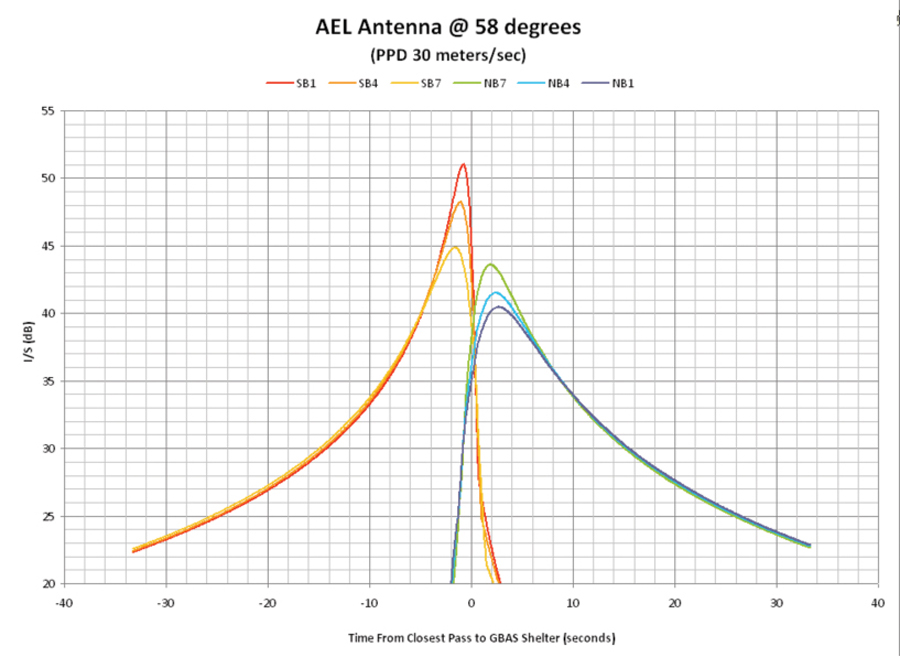
Modeling Antenna Responses
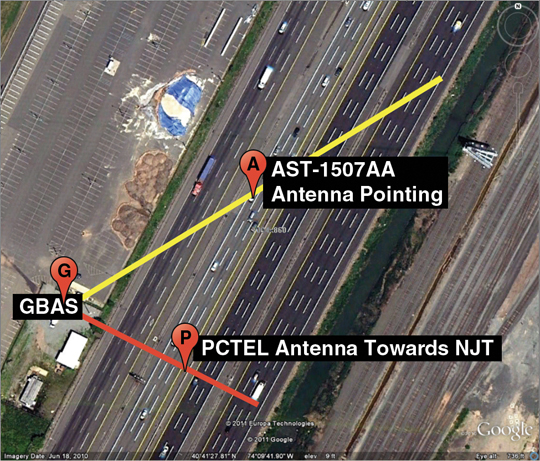
The use and orientation of the two antennas was chosen to determine the direction that PPDs are traveling and thereby reduce some of the uncertainty with respect to their exact location. Figure 13 shows the direction (58 degrees) in which the AEL antenna is pointed.
FIGURE 13. Pointing direction of the AEL antenna.
The combination of its beam width (70 degrees) and axial ratio (0.2 dB) results in a nearly uniform gain across all lanes north of the GBAS shelter. Although FSL still depends on the exact location of the PPD, this approach does reduce many of the uncertainties associated with estimating EIRP. Since the PCTEL antenna has an omnidirectional pattern it will have a symmetrical response.
To determine the time that maximum PPD power would be observed by each antenna, a model was used that assumed the PPD was transmitting at constant power, with fixed polarization, travelling at a constant velocity, and there were no obstacles between the transmitter and each antenna. FSL was calculated for each second of travel and used to determine the magnitude of RFI power that would be received. This value was then used to calculate a nominal Interference to Signal (I/S) relative to the GPS signal. The distance between each antenna and each of the travel lanes on the NJT were also used. The intent of this model was to understand how I/S would vary with time for each of the NJT travel lanes. Figure 14 shows the predicted I/S for the PCTEL antenna and Figure 15 for the AEL antenna. In each of these plots red, yellow and orange represent 3 of the 7 south bound travel lanes and green, blue and purple represent 3 of the 7 north bound travel lanes. A time of 0 was used for the time when the PPD is nearest physically to the GBAS shelter. A nominal velocity of 30 meters/second (67 MPH) was used for the PPD and I/S was computed for 30 seconds before and after its closest approach (± 900 meters north and south of the GBAS shelter). If the PPD travels slower than 30 m/s then the following curves would be wider for the same times. Similarly, if the PPD travels faster, these same curves would be narrower.
FIGURE 14. Predicted I/S for PCTEL antenna (click to enlarge.)
FIGURE 15. Predicted I/S for AEL AST-1507AA (click to enlarge.)
Modeling of the AEL antenna took into account its pattern and orientation. It has less gain towards the south, and consequently observed power from a PPD located south of the GBAS shelter is much less. A southbound PPD will initially be within the main beam of the AEL antenna; therefore the expected interference to signal ratio (I/S) will gradually increase until it passes to the south of the GBAS shelter. Similarly, a northbound PPD will not exhibit significant I/S until north of the GBAS shelter. Figure 15 indicates that the maximum I/S occurs within 2 seconds of the point where the PPD is closest to the GBAS shelter. Typical GPS receivers can tolerate an I/S of 30 dB for CW type signals.
Processed RFI data does display some of these characteristics but with some important differences. PPD power was measured once every millisecond using Snapshot System data and total power within the bandwidth of that PPD was calculated. Total power from both the PCTEL (green) and AEL (pink) antennas were then plotted together with one example for a southbound PPD in Figure 16 and a northbound PPD in Figure 17.
FIGURE 16. RFI Power of southbound PPD (click to enlarge.)
FIGURE 17. RFI Power of northbound PPD (click to enlarge.)
Although the envelope of the measured average power tends to have the shape that modeling predicts, there are significant variations over short periods of time. Figure 18 expands a portion of one example and indicates that RFI power varied by more than 17 dB in 0.2 seconds. Examination of spectral data for time intervals of less than one second frequently contains significant changes in observable power. Swept CW from PPDs should exhibit relatively flat RF spectral power, but typical observed spectra include sloping across the band and notches. Possible explanations for these observations include: blockage and diffraction from other vehicles near the one containing the PPD, multipath from other vehicles on the NJT, and the effect of transmitting from within a vehicle. Although some of the snapshot captures exhibit smooth power variation similar to predicted, the vast majority of the hundreds of snapshots exhibit significant variations in power.
FIGURE 18. RFI Power of southbound PPD (expanded).
Examples of Observed PPDs
The variety of PPDs observed by the updated EWR monitoring equipment has been surprising. Within its first month of operation, more than 40 PPDs were observed with no less than 19 from unique and different PPD transmitters. Classification of PPD transmitters is based on the combination of RF spectra and the spectrum of the FM demodulated data. Although the observed PPD transmitters use a linearly swept FM sawtooth, most contain deviations from a pure linear sweep. Figure 19 shows examples of FM demodulated time series. Rather than attempting to uniquely describe the attributes of each type of deviation, it is simpler to compute the spectrum of the FM demodulated data. The fundamental frequencies of chirp rates that have been observed have spanned 9 kHz to 170 kHz. Figure 20 shows a histogram of chirp rates observed near EWR and indicates that the most frequent rates have been 9, 26, 29, 72, 85, 118, 123, 159 and 170 kHz.
FIGURE 20. Histogram of EWR PPD chirp rates.
Examples of the 19 unique PPDs (detected within one month) are shown in Figure 22 through Figure 40, with the RF spectrum shown on the left, and the spectrum of the FM demodulated shown on the right. In each of these plots the scaling for the RF spectra is identical, spanning 40 MHz centered on 1575 MHz with a vertical scale using 10 dB per grid. All of the FM demodulated spectra use a horizontal axis that spans 0 to 200 kHz. For references purposes Figure 21 shows the RF spectra when no RFI is present.
Some of these PPDs were transmitting at power levels (observed by the PCTEL antenna) as much as 40 dB above the LNA noise floor. Most spectra were not centered symmetrically about L1 with some completely outside the mainlobe of the GPS C/A code. A few were transmitting outside the programmed 40 MHz bandwidth of the Snapshot System (1555 to 1595 MHz). For those PPDs transmitting outside this band, estimates were made of the upper or lower frequencies using the linear slope of the FM demodulated data, and then extrapolating that slope based on the chirp interval.
Some of the FM demodulated spectra contain a single spectral line that indicates the waveform modulating the RF has a very linear sweep. Most contain additional harmonic lines about the major component and a few appear to have bandwidth about their main spectral component. The current hypothesis is that many of these devices are poorly shielded and that the internal oscillator used to modulate the RF is affected by other nearby signals that are then appearing at the RF output. Some of the possible sources could be circuits that are within the device itself but there is some evidence that a few of these devices are susceptible to energy external to the PPD. A Snapshot System located near Houston International Airport (ZHU) has captured data from PPDs that contain strong components at 58.7 Hz in addition to its linearly swept 97 kHz waveform. Since this frequency is sufficiently different from utility AC power sources (60 ± 0.03 Hz), it has been hypothesized the vehicle carrying that PPD, also has a power inverter. Most power inverters are specified to provide a frequency output of 60 ± 3 Hz. Figure 32 shows a spectral notch that was present at that single frequency throughout the complete capture and suggests that that particular device may have had an impedance matching problem in its transmission path.
FIGURE 21. Spectra with No RFI Observed by PCTEL (click to enlarge).
FIGURE 22. 1570 to 1583 MHz, Chirp 117.35 kHz.
FIGURE 23. 1556 to 1583 MHz, Chirp 28.43 kHz.
FIGURE 24. 1565 to 1578 MHz, Chirp 123.13 kHz.
FIGURE 25. 1568 to 1583 MHz, Chirp 111.08 kHz.
FIGURE 26. 1578 to 1589 MHz, Chirp 118.07 kHz.
FIGURE 27. 1568 to 1584 MHz, Chirp 8.92 kHz.
FIGURE 28. 1572 to 1584 MHz, Chirp 121.93 kHz.
FIGURE 29. 1557 to 1622 MHz, Chirp 36.14 kHz.
FIGURE 30. 1568 to 1582 MHz, Chirp 11.08 kHz.
FIGURE 31. 1570 to 1585 MHz, Chirp 85.06 kHz.
FIGURE 32. 1572 to 1582 MHz, Chirp 118.07 kHz.
FIGURE 33. 1529 to 1577 MHz, Chirp 39.52 kHz.
FIGURE 34. 1578 to 1594 MHz, Chirp 131.33 kHz.
FIGURE 35. 1575 to 1582 MHz, Chirp 75.66 kHz.
FIGURE 36. 1561 to 1586 MHz, Chirp 29.16 kHz.
FIGURE 37. 1568 to 1592 MHz, Chirp 71.33 kHz.
FIGURE 38. 1560 to 1595 MHz, Chirp 9.88 kHz.
FIGURE 39. 1564 to 1582 MHz, Chirp 100.48 kHz.
FIGURE 40. 1584 to 1599 MHz, Chirp 128.20 kHz.
A few snapshots have also provided evidence that some of the PPDs are erratic and probably not functioning as their manufacturer intended. Figure 41 contains a raster of 6 seconds of spectral data that shows a PPD whose output was meant to be between 1560 and 1580 MHz but for short periods of time was transmitting at frequencies above 1580.
FIGURE 41. Spectral Raster, PPD with Unstable Output.
Remarks on Additional PPDs
Since April 2011 the Snapshot System has captured many additional and different PPDs. No effort has been carried out to catalog all of the different types that have been observed but the following describes interesting and notable PPDs.
Figure 42 shows characteristics of a PPD that has had estimated EIRP approaching +20 dBm, to a point just outside the vehicle, and has also been associated with GPS receiver C/N0 degradation of more than -27 dB, strong enough to cause the WAAS receiver, located at the GBAS shelter, to lose lock on all GPS satellites for a short period of time.
FIGURE 42. 1568 to 1582 MHz, Chirp 118 kHz
Figure 43 shows a PPD that is one of the most frequently observed PPDs but that has not been associated with any significant degradation to the GPS receivers. Estimated EIRP for these PPDs has been on the order of no more than +10 dBm. One device with similar characteristics was procured and its measured power at the antenna output port was no more than +14 dBm. Marketing information on the internet for that PPD specified its output power as +25 dBm.
FIGURE 43. 1572 to 1589 MHz, Chirp 85 kHz.
Figure 44 shows a PPD that is transmitting at both L1 and L2. The EWR Snapshot System has been configured to only capture snapshot data at L1 due to the fact that LAAS only uses L1. However, the WAAS receiver used to monitor for RFI is a dual frequency receiver that on occasion has indicated simultaneous RFI at both L1 and L2. Even though the EWR Snapshot System has not captured data at L2, the simultaneous presence of both L1 and L2 RFI, provides strong circumstantial evidence that this RFI source was transmitting on both frequencies. A Snapshot System monitoring the WAAS Reference Station (WRS) at Leesburg Virginia has captured simultaneous L1 and L2 RFI events. Demodulation of that data indicated the two RF outputs had similar modulation but the demodulated data was not coherent. Therefore, that PPD was probably using individual, but similar waveform generators, for each RF output.
FIGURE 44. 1562 to 1583 MHz, Chirp 114 kHz.
Almost all PPDs have been observed individually. However, there have been at least three times in the last two years when two unique PPDs have been observed within 60 seconds of each other. Figure 45 plots normalized degradation in C/N0 while Figure 46 plots snapshot measured power for the same RFI event. Analysis of snapshot data for each of the times that had strong RFI power are shown in Figure 47 and Figure 48 and confirmed that there were in fact two unique PPDs observed approximately 40 seconds apart. Both were traveling south on the NJT and approximately 1200 meters apart.
FIGURE 45. Normalized C/N0 August 19, 2011
FIGURE 46. Snapshot Power August 19, 2011.
FIGURE 47. C/N0 -19.0 dB, Chirp Rate 78.97 kHz.
FIGURE 48. C/No -28.0 dB, Chirp Rate 117.24 kHz.
Most of the observed RFI events last for no more than 50 seconds although a few that lasted much longer have been correlated with slow traffic on the NJT. Figure 49 is from June of 2010, before the updated monitoring equipment was in place, and displays normalized degradation of C/N0. The time duration for which this RFI was observed was more than 3 minutes and was during a time when traffic was ‘slow’ on the NJT.
FIGURE 49. June 9, 2010, PPD, Estimated Velocity 10 m/s.
Very wide-bandwidth PPDs have recently been observed more often. The frequency span these devices are transmitting has had to be estimated due to the fact that the Snapshot monitor has 40 MHz of bandwidth, and these PPDs are transmitting beyond this bandwidth. Figure 50 through Figure 52 show examples of these types of PPDs. The left plot in these figures is the RF spectra and the right plot is the FM demodulated waveform. The latter each contain a linear component that is present for only a portion of the chirp interval. Under the assumption that the modulating waveform would be linear for the repetition interval, the slope of the visible linear component was extrapolated to the total chirp time interval. It is not possible to estimate the upper and lower frequency points for the last two examples, since neither of those had a frequency that began or ended within the observable 40 MHz bandwidth of the monitor.
Although the Snapshot System L-band tuners can be programmed for greater bandwidth, the limiting bandwidth is the bandpass filters contained within the LNA modules, which have bandwidths of 40 MHz.
Data captured by a Snapshot System operating near ZHU contains evidence that external energy may have coupled into that PPD and affected the modulation waveform. Figure 53 shows a plot of the RF spectra and an expanded portion of the FM demodulated spectra indicating the presence of a 58.7 Hz component. A raster of the demodulated FM, shown in Figure 54, highlights the 58.7 Hertz component.
FIGURE 53A. ZHU chirp 118 kHz with 58.7 Hz.
FIGURE 53B. ZHU chirp 118 kHz with 58.7 Hz.
FIGURE 54. ZHU raster of FM showing 58.7 Hz (Click to enlarge).
Careful analysis of normalized C/N0 has also provided clues as to the possible travel paths that a PPD might be using. RFI was suspected at the WRS located at Leesburg Virginia (ZDC). A Snapshot System was installed to detect and characterize possible RFI. Analysis of snapshot data did confirm that a few PPDs were traveling past ZDC. One of the PPDs was more disruptive than the others but fortunately was also following a very predictable schedule. It was regularly detected twice a day, first within 10 minutes of 4:30 AM local and next within 30 minutes of 2:30 PM. Normalized C/N0 contained similar patterns for each time of day and are shown in Figure 55 and Figure 56. Examination of the local roadways, shown in Figure 57, suggested the possible roads and direction in which this PPD was traveling. The WAAS antennas on the roof of ZDC have clear line of sight to state highway 7 for vehicles that are east of ZDC. Normalized C/N0 for morning events tended to have a relatively abrupt onset followed by a gradual return to normal while the afternoon events exhibited a gradual increase in degraded C/N0 followed by a quick return to normal. This observation lead to hypothesizing that the PPD was traveling east in the morning and west in the afternoon.
FIGURE 55. ZDC Typical Morning Degradation.
FIGURE 56. ZDC Typical Afternoon Degradation.
FIGURE 57. Roads near ZDC (click to enlarge.)
FAA Spectrum personnel were informed of this analysis and confirmed that this hypothesis was correct. Using this information they were able to detect the vehicle that was responsible and remove this particular PPD from service.
EWR RFI Event Statistics
A large number of RFI events have been detected at EWR since the updated Snapshot System was installed on March 3, 2011. These RFI events have been ranked according to the magnitude of degradation in normalized C/N0, as reported by the GBAS shelter WAAS receiver. The following plots show the total number of RFI events per day (red dots) and for every seven consecutive days (blue line). On average, PPD-induced receiver degradation of at least 10 dB has been observed two times a day. Although a small number of narrowband RFI events produced receiver degradation of as much as 10 dB, the vast majority of RFI events causing 10 dB or more of receiver degradation are due to PPDs.
Figure 58 indicates that since March 2011, more PPD RFI events are being observed. However, Figure 60 indicates that the higher-power PPDs are not being observed as often. One possible explanation is that the previously observed PPDs have stopped working, and the individuals using them have either not acquired replacements or they have acquired different ones with less-damaging RFI.
FIGURE 58. History of RFI > –10 dB (click to enlarge).
FIGURE 59. History of RFI > –15 dB (click to enlarge).
FIGURE 60. History of RFI > –20 dB.
Many recent PPDs have been transmitting with estimated frequency spans of 65 MHz to 140 MHz. Although the estimated EIRP of many of these very wide bandwidth PPDs has been as much as +10 dBm, their effect on GPS receiver processing has not been as damaging due to the fact that the RFI is within the GPS receiver processing bandwidth for only a portion of the time.
Spectra of Swept FM with Multipath
One of the most commonly observed characteristics in PPD spectral data has been uniformly spaced nulls as shown in Figure 61 and Figure 62. Figure 63 displays a spectral raster that shows how the nulls shift in frequency over time. Initially, there was uncertainty as to the mechanism responsible for these observations. Under the hypothesis that multipath might be responsible, a single ray multipath model was used to predict the spectral characteristics of a PPD that includes a multipath component. This analysis was pursued in the hope that it might provide additional information as to the exact location of PPDs.
FIGURE 61. PPD spectral nulls 2.4 MHz apart.
FIGURE 62. PPD spectra nulls 4.7 MHz apart.
FIGURE 63. Spectra raster shifting nulls.
The swept CW signals used by PPDs provide a useful source for characterizing multipath between the PPD and monitoring antennas. Equation (1) models observed CW that is the sum of the direct path and a single reflection in which reflected component has a path length difference of d meters.
(1)
Assuming the reflection is from a metal surface, it should experience a phase reversal. Therefore, destructive cancellation between the direct and multipath component will be present for those frequencies that have a path length difference that is an integer multiple of the wavelength. Equation (2) represents this condition.
(2)
Simplification results in the following expression.
(3)
As an example, if spectral nulls are observed at intervals of 10 MHz, then the path length difference is approximately 30 meters. Spectral nulls have been observed at frequency intervals ranging from 2 MHz to as much as 30 MHz. These null spacing’s translate to path length differences of between 150 meters to 10 meters. Multipath with a path length difference of less than 8 meters will exhibit a single null in the 40 MHz bandwidth of the Snapshot System and therefore cannot be estimated accurately using this technique. A path length difference of 8 meters is also what might be expected for two vehicles traveling side by side on interstate highways since interstate highway specifications require lanes to be approximately 4 meters wide.
Once a possible mechanism for the spectral nulls was hypothesized, additional analysis was performed on specific RFI events in which uniformly spaced spectral had been observed. Snapshot and GPS receiver data indicates the direction of travel for a PPD. With direction of travel known, it is possible to approximate the distance that the PPD is from the monitoring equipment. However, for those RFI events that were examined, the calculated path length difference was similar to or greater than the distance between the PPD and monitoring equipment. The most likely location of surfaces that would reflect the PPD transmission was other vehicles on the NJT. Had the surfaces responsible for the reflections been stationary objects nearby, then it might have been possible to hypothesize the most likely location of the PPD by combining receiver proximity and path length differences.
The magnitude of the reflection coefficient can be estimated by comparing the relative power of the spectral maximum and minimum. However the magnitude of the reflection coefficient can only be bounded since it depends on both the reflection coefficient and the relative path length difference. Since the reflected path travels farther, its magnitude will inherently be reduced, in addition to the loss from the reflection, and therefore the observed relative difference will be smaller than shown by equation (4).
(4)
For the examples shown in Figure 61 and Figure 62 the spectral max/min was on the order of 10 dB. By using 10 dB for SpectraMaxMin in equation (4), a reflection coefficient of at least 0.5 is calculated. Reflection coefficients of trucks with shipping containers will probably be much greater than 0.5 and could easily be as high as 0.9.
Direction-Finding Methods
After examining more than a thousand examples of PPDs and their effect on GPS receivers, I have concluded that any type of ground-based direction finding system intended to detect and locate low power moving PPDs over a large area using time-difference-of-arrival (TDOA) or beam forming (angle-of-arrival, AOA) techniques will face significant challenges.
Accuracy of TDOA-based location systems can be decomposed into two components: measurement accuracy, and the geometry of the equipment used to make these measurements. In 1982, Paul Chestnut calculated the relationship between accuracy and these two components, showing that geometry is a multiplicative factor. Direction-finding conceptual design typically strives to position the measurement equipment such that it surrounds the area to be monitored, if possible. For those situations where it is not possible to encircle the area, the measurement equipment will typically have a long baseline between its sensors and with a perpendicular orientation with respect to the monitored area. This strategy reduces errors due to geometry.
Measurement error depends on the observable power of the signal to be located. This component will most likely limit the ability to accurately locate low-power moving PPDs. Measurement data from GPS receivers demonstrate the ability to reliably detect the presence of these PPDs, but only when they have been within hundreds of meters. Most PPDs have been observed for 30 to at most 60 seconds. For PPDs traveling along the NJT at a velocity of 30 m/s, this time span implies that they were not detected until they were within 900 meters. Reliable detection was not demonstrated unless they were within 500 meters. This is a direct consequence of the fact that all GPS antenna are designed for hemispherical coverage for satellites above the horizon. The PPDs are at the horizon or lower relative to most GPS antenna patterns. If GPS antennas were used as part of a TDOA-based system, they would need to be positioned no further apart than approximately 600 meters. Using GPS antennas to detect and locate PPDs is inherently limited to proximity detection.
The ability to locate low-power PPDs within a larger area requires a system to be able to detect a PPD by all of its sensors simultaneously from distances much greater than 600 meters. In principal, higher-gain antennas orienting their main beam along the NJT would increase the distance over which PPDs could be detected. Even when high-gain directional antennas have been positioned along the NJT, the observed power has not followed predictions based strictly on FSL. One reason for this is that clear line-of-sight could not be achieved between the high gain antenna and the PPD. Vehicular effects might also be responsible for these observations. What is known is that the power observed by ground-based antennas has shown significant fluctuation, much greater than could be explained by FSL propagation. Ground-based direction finding systems for low-power moving PPDs must be able to simultaneously detect RFI by multiple sensors, in an environment that may at times shield the PPD from its sensors, and that also has fluctuating observable power.
The ability to observe, detect, and locate low-power moving PPDs over a large area would require a system to have its monitoring antenna located high above the NJT, and oriented to look down on the NJT and the surrounding area. Although such a system must still contend with shielding from the vehicle itself, it would be the only approach that could potentially observe these PPDs over a large area, simultaneously by all of its measurement sensors. Implementing such a concept may be expensive.
A less expensive approach might rely on proximity detection, with many sensors on the ground, each monitoring their own small area, and only report PPDs that travel close to each of them. One such approach, referred to as crowd sourcing, uses cell phones to aid in detecting and locating PPDs. Crowd sourcing is a form of proximity detection.
Summary
The first evidence of low-power moving PPDs along the NJT used two GPS receivers separated by considerable distance and then correlated their responses. This approach is only useful for detection of PPDs traveling in close proximity to the GPS receivers. Analysis of GPS receiver normalized C/N0 also provided a basis for determining if RFI might be from a moving emitter. The shape of normalized C/N0 versus time not only provides clues that the RFI source is in motion, but may even be correlated with their possible travel paths, when blockage exists between the GPS antenna and local roadways.
Autonomous operation is a necessity for detecting low-power moving PPDs, since they may be observable only a few times a day and for less than 60 seconds.
Capturing real-time samples of these intermittent RFI events determined the existence of many different types of PPDs. Almost all use some form of swept FM modulation. Analysis of their spectra and modulation indicates that many devices are probably not operating as their manufacturer intended. Modulation waveforms of PPDs have included triangle, highly linear sawtooth, sawtooth with synchronous perturbations on top of the fundamental sawtooth, and sawtooth with analog modulation. The leading hypothesis for this observation is that the devices are not shielded very well and that the internal modulator is susceptible to coupling from either other circuits within the PPD itself or from external electronic devices operating in the vicinity of the PPD.
Acknowledgments
The author thanks the FAA for support in this investigation, Rich Holley of ICE-Online for help in utilizing capabilities of the ICEPOD6-M5, and Julian Babel of the FAA Technical Center for regularly swapping external hard drives attached to the Snapshot System.
Joe Grabowski is a systems engineer at Zeta Associates where he works on a variety of GPS projects in support of the FAA, as well as communications systems and digital signal processing applications. He received an M.S.EE from Purdue University. Since 2010 he has been involved in the investigation of personal privacy device impacts on FAA SBAS and GBAS sites.